 ">
">
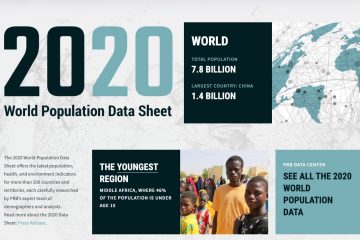
(July 2011) Global population will reach 7 billion later in 2011, just 12 years after reaching 6 billion in 1999.
Today’s world population is double the population in 1967. But while the overall growth rate has slowed, the population is still growing, and growth rates in some countries show little if any decline.
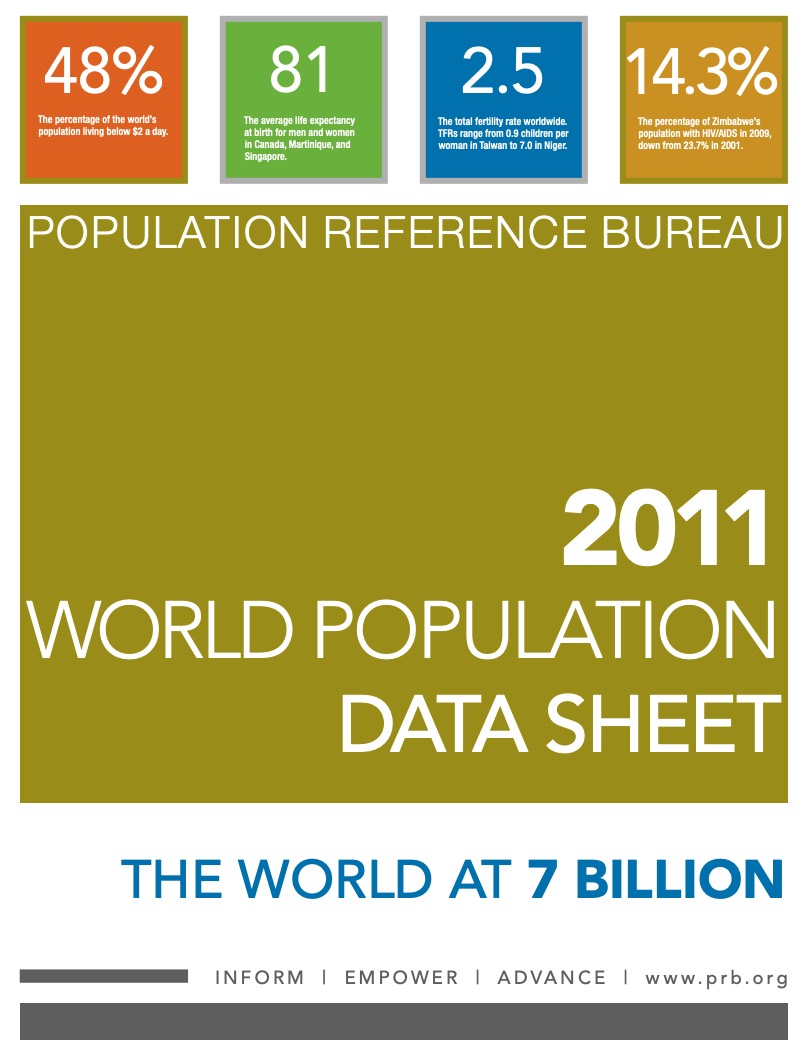
The Population Reference Bureau’s 2011 World Population Data Sheet and its summary report offer detailed information on 18 population, health, and environment indicators for more than 200 countries.
“Even though the annual population growth rate has declined to 1.2 percent per year, world population grows by about 83 million annually,” says Wendy Baldwin, PRB’s president. “If the late 1960s population growth rate of 2.1 percent—the highest in history—had held steady, world population would have grown by 117 million annually, and today’s population would have been 8.6 billion.”
“The world added the sixth billion and the seventh billion in a record 12 years for each,” says Carl Haub, PRB’s senior demographer and co-author of this year’s data sheet. “The eighth billion may also take about 12 years, but only if birth rates in all developing countries follow projections that assume a smooth decline to two children or fewer.”
Declines in birth rates have been virtually universal across countries, but the pattern of decline has varied widely. In some countries such as Germany, Russia, and Taiwan, birth rates have fallen far below two children. In other countries such as Bangladesh, birth rates have decreased and most families have between two and three children. In still other countries, birth rates remain high; for example, in Niger, seven children per woman continues to be the norm.
The 2011 World Population Data Sheet provides up-to-date demographic, health, and environment data for all the countries and major regions of the world. It shows just how stark the contrasts are between rich and poor countries, as illustrated by the table with data from Italy and the Democratic Republic of Congo (DRC).
Even though the DRC and Italy have almost the same population size today, the DRC is projected to more than double its population from 68 million today to 149 million in 2050. Italy’s population will likely grow very slowly from 61 million to 62 million over that same time. The cause of these enormous differences is lifetime births per woman and the share of the population in their childbearing years.
Key Demographic Indicators, 2011
|   | Congo, Dem. Rep. | Italy |
|---|---|---|
| Population mid-2011 | 68 million | 61 million |
| Population 2050 (projected) | 149 million | 62 million |
| Percent of population below age 15 | 46% | 14% |
| Percent of population ages 65+ | 3% | 20% |
| Lifetime births per woman | 6.1 | 1.4 |
| Annual births | 3,050,000 | 560,000 |
| Annual deaths | 1,140,000 | 590,000 |
| Infant mortality rate (per 1,000 live births) | 111 | 3.7 |
| Annual infant deaths | 340,000 | 2,000 |
| Gross national income per capita, 2009 | $300 | $31,870 |
OTHER HIGHLIGHTS FROM THE 2011 WORLD POPULATION DATA SHEET:
- HIV/AIDS prevalence in sub-Saharan Africa declined by 15 percent among adults ages 15 to 49—from 5.9 percent in 2001 to 5.0 percent in 2009. But prevalence among adults remains high in many countries—24.8 percent in Botswana and 25.9 percent in Swaziland.
- Nearly half the world (48 percent) lives in poverty on less than the equivalent of US$2 per day, including 80 percent of people in the Democratic Republic of Congo, 76 percent in India, 65 percent in Uganda, and 61 percent in Pakistan.
- Virtually all population growth is concentrated in the world’s poorest countries, making it difficult to lift large numbers of people out of poverty.
- Worldwide, women now average 2.5 children during their lifetimes and 4.5 in the poorest countries. Lifetime fertility is highest in sub-Saharan Africa at 5.2 children per woman. In the developed countries, women average 1.7 children. The United States is one exception among high-income countries, with a total fertility rate of 2.0 children per woman.
- The U.S. population increased by almost 10 percent between 2000 and 2010, but growth patterns varied widely. States in the South and the West grew the fastest, while many rural areas lost population, including much of the Great Plains and northern and central Appalachia.