
Change
Three Patterns of Population Change
Source: United Nations, World Population Prospects, The 2006 Revision.
Teachers Guide: Discussion Questions
- What percentage of the population of the Democratic Republic of Congo, the United States, and Germany are 0–4 years old?
Which of the three countries has the greatest proportion of people ages 65 and older?
Reading
- How can the age-sex structure of a population help determine the needs of that population?
- What does it mean to have a “young” or “old” population?
- How can migration affect the shape of a pyramid?
- What is “zero population growth”? Which pyramid represents this concept?
Data
The dependency ratio is a measure used to indicate the ratio of people in the “dependent” ages (under 15 and ages 65 and older) per 100 people in the “economically productive” ages (15–64 years of age). The formula for the dependency ratio is:

The age dependency ratio for the United States is shown below at 49.

This means that there were 49 people in the dependent ages for every 100 persons in the working ages.
- Calculate the dependency ratios for Kenya, Germany, Brazil, and Japan. Compare the components of each of them.
Discussion
Discuss the implications of high or low dependency ratios for economic resources and development.
Question and Answer: Why Does It Take So Long to Slow or Stop Population Growth?
Growth through natural increase occurs when the birth rate exceeds the death rate. For example, the U.S. birth rate in 2005 was 14 births per 1,000 people and the death rate was 8, yielding a net increase of six persons for every 1,000 persons in the United States, or approximately 1.7 million additional persons for that year. This rate of natural increase occurred in spite of a very small average family size measured by the total fertility rate—an estimate of the number of births to women during their lifetimes.
The rate of natural increase of a population depends on birth and death rates, which are strongly influenced by the population age structure. Births occur primarily to people in the younger-adult age groups. If there are comparatively more young adults than older adults where mortality is highest, then even at replacement fertility levels (when each woman has about an average of two children) there will be more births than deaths.
Hence, a relatively large number of couples each having one or two children can still produce a large excess of births. This phenomenon is known as population momentum.
In the United States, birth rates are higher than death rates at present, partly due to the relatively young age structure of the U.S. population. Immigrants, who are younger on average than the U.S.-born population, play a significant role in keeping the United States younger than most other developed countries. For example, among U.S. Hispanics, 40 percent of whom are foreign-born, there are approximately 10 births for every death.
The momentum of population growth in less developed countries will only be slowed when the large number of young adults resulting from previous high fertility have passed out of the childbearing years and a succeeding smaller generation reproduces at replacement level fertility. This momentum is very pronounced in China, where women have about two children, but the number of women having children is now much larger than in the previous generation. Thus, even though it has reached replacement level fertility, China’s population continues to grow.
Terms
The composition of a population as determined by the number or proportion of males and females in each age category. The age-sex structure of a population is the cumulative result of past trends in fertility, mortality, and migration. Information on age-sex composition is essential for the description and analysis of many other types of demographic data.
A dramatic increase in fertility rates and in the absolute number of births. In the United States this occurred during the period following World War II (1946 to 1964).
The number of live births per 1,000 population in a given year. Not to be confused with the growth rate.
The number of deaths per 1,000 population in a given year.
Less developed countries include all countries in Africa, Asia (excluding Japan), and Latin America and the Caribbean, and the regions of Melanesia, Micronesia, and Polynesia.
More developed countries include all countries in Europe, North America, Australia, New Zealand, and Japan.
Deaths as a component of population change.
The rate at which a population is increasing (or decreasing) in a given year due to a surplus (or deficit) of births over deaths, expressed as a percentage of the base population.
The number of children women are having today. The average number of children that would be born alive to a women during her childbearing years if she conformed to the age-specific fertility rates of a given year.
Aside from the total size, the most important demographic characteristic of a population is its age and sex structure, or the proportion of people at each age, by sex. The age-sex structure determines potential for future growth of specific age groups, as well as the total population. For these reasons, the age structure has significant government policy implications. A population of young people needs a sufficient number of schools and, later, enough jobs to accommodate them. Countries with a large proportion of older people must develop retirement systems and medical facilities to serve them. Therefore, as a population ages, needs change from childcare and schools to jobs, housing, and medical care.
Population Pyramids
The age-sex structure of a country can be studied through population pyramids. The overall shape of the pyramid indicates the potential for future growth. The four representations of population age-sex structure provide an overall example of what a pyramid for different levels of population growth would look like — rapid growth, slow growth, zero growth, and negative growth. The horizontal bars show the percentage (or in some cases the actual numbers) of males and females in each age group.
The country pyramids shown in “Three Patterns of Population Change” also represent different stages of population growth going on today. The first pyramid, representing the population of the Democratic Republic of Congo, with its wide base and narrow top, is typical of a young population. This shape is the result of high birth rates that feed more and more people into the lowest bars and in turn shrink the relative proportion at the oldest ages. As the death rate declines, more people survive to the reproductive ages and beyond. The births they have further widen the base of the pyramid. This shape is common in many less developed countries that have experienced improvements in life expectancy but continue to have high birth rates. It reflects both a history of rapid population growth and the potential for future rapid growth.
The second age-sex pyramid is typical of a slowly growing population. The United States is an example of a country in slow growth. The United States has had declining fertility and mortality rates for most of this century. With lower fertility, fewer people have entered the lowest bars of the pyramid, and as life expectancy has increased, a greater percentage of the “births” have survived until old age. As a result, the population has been aging, meaning that the proportion of older persons in the population has been growing. This trend was interrupted by the postwar baby boom, 1946-1964, when birth rates climbed again. (The bulge of the baby-boom generation can be seen in the pyramid for ages 40-59 in 2005.) After 1964, birth rates continued their downward trend until the late 1970s. As the last members of the baby boom approached their childbearing years during the 1980s, the number of births rose again, peaking in 1990. These children, the youngest generation, are represented by the slightly widening base of the pyramid. Even though the number of births per woman is lower than ever before, the population continues to grow because of the children and grandchildren of the huge baby-boom generation.
A few countries have reached zero population growth or are experiencing negative growth because of low birth rates and an old age structure coupled with minimal net migration. While Germany’s death rate exceeds its birth rate, its population continues to grow because of net migration. Pyramids in which the proportions of the population are fairly evenly distributed among all age groups are representative of many highly industrialized societies. Germany’s old population reflects an extended period of low birth and death rates. While fewer children have been born, most of those born survive through to old age. The net effect is zero growth or no natural increase. Germany’s pyramid also shows the effect of higher mortality among males. In an industrialized society, females generally outnumber males after age 40. This trend is particularly evident in Germany’s oldest age group.
While birth and death rates usually determine the basic pyramid shape, migration also affects it. Typically, most migrants are in the working ages, and often more males than females migrate across national borders. In some Middle Eastern countries a large number of men migrated to work in the oil fields, which caused a bulge in one side of the pyramid, while it took a “bite” out of the pyramid of some of the countries from which they came.
Short-term fluctuations in birth and death rates that produce unusual bites or bulges in population pyramids, such as the baby boom, often can be traced to such historical events as wars, epidemics, economic booms, or depressions. The decline in the birth rate during the Great Depression caused a small bite in the U.S. pyramid for the group born between 1930 and 1934. World Wars I and II caused a deficit of older men in Germany. The impact of these events emphasizes the interrelationships among population change and economic, social, political, and health factors.
Terms
The composition of a population as determined by the number or proportion of males and females in each age category. The age-sex structure of a population is the cumulative result of past trends in fertility, mortality, and migration. Information on age-sex composition is essential for the description and analysis of many other types of demographic data.
A dramatic increase in fertility rates and in the absolute number of births. In the United States this occurred during the period following World War II (1946 to 1964).
The number of live births per 1,000 population in a given year. Not to be confused with the growth rate.
The number of deaths per 1,000 population in a given year.
The number of persons added to (or subtracted from) a population in a year due to natural increase and net migration; expressed as a percentage of the population at the beginning of the time period.
Less developed countries include all countries in Africa, Asia (excluding Japan), and Latin America and the Caribbean, and the regions of Melanesia, Micronesia, and Polynesia.
The average number of additional years a person of a given age could expect to live if current mortality trends were to continue for the rest of that person’s life. Most commonly cited as life expectancy at birth.
More developed countries include all countries in Europe, North America, Australia, New Zealand, and Japan.
Deaths as a component of population change.
The net effect of immigration and emigration on an area’s population in a given time period, expressed as an increase or decrease.
A bar chart, arranged vertically, that shows the distribution of a population by age and sex. By convention, the younger ages are at the bottom, with males on the left and females on the right.
The rate at which a population is increasing (or decreasing) in a given year due to a surplus (or deficit) of births over deaths, expressed as a percentage of the base population.
A population in equilibrium, with a growth rate of zero, achieved when births plus immigration equal deaths plus emigration. Zero growth is not to be confused with replacement level fertility.
Environment
Annual Renewable Freshwater Availability per Capita, 1950, 1995, 2050
Source: Population Action International, Sustaining Water, Erasing Scarcity.
Teachers Guide: Discussion Questions
Reading
- Outline some of the links between population and the environment.
- Describe how consumption patterns and population size may each contribute to environmental degradation.
- What are the implications of disparity between population size and energy production and consumption?
Data
- Examine environmental data available online from organizations like the World Resources Institute (www.wri.org) and look at how these variables compare with what is happening in your local region or state with data available from organizations like the Environmental Protection Agency (www.epa.gov).
- Compare environmental data with demographic indicators on the World Population Data Sheet. Create two chloropleth maps for two comparable indicators.
Discussion
- What are some important considerations to keep in mind when developing strategies or plans to ensure sustainable development?
Question and Answer: Does the Relationship Between Population and the Environment Vary by Region?
Yes. When most people link population growth and environmental degradation, they are usually referring to less developed countries, where most of the world’s people live and population growth is high. But environmental problems exist in all countries regardless of the level of development. Most of the environmental degradation in industrialized countries, where only 20 percent of the world’s people live, is attributable to high consumption patterns; each individual in an industrialized country exerts more pressure on the environment than perhaps 20 to 30 people in the less developed world. For example, consumption patterns in the United States are indicative of the industrialized world’s disproportionate use of global resources. The United States has 5 percent of the world’s population but uses an estimated 24 percent of the world’s resources. According to Paul Ehrlich in his book The Population Bomb, the average American uses as much energy as two Japanese, six Mexicans, 13 Chinese, 31 Indians, 128 Bangladeshis, 307 Tanzanians, and 370 Ethiopians.
Experts are attempting to find quantitative ways to consider both consumption patterns and population size when determining the link between people and the environment. Environmentalists have been using an equation known as I=PAT, which attempts to factor both causes into determining environmental impacts.

The causes of tropical deforestation lay both in population growth in less developed countries and consumption levels in more developed countries. However, for some other environmental problems such as ozone depletion, most of the damage is due to the use of refrigerators and air conditioning systems in industrialized countries, not to population growth.
The adverse environmental impact of consumption patterns in more developed countries is likely to increase as less developed countries further industrialize and adopt consumption patterns similar to those of their more financially wealthy neighbors. Already, elites in the less developed countries mimic the prolific consumption of rich Americans or Europeans. Consumption has surged in China and India since the 1980s and, with the fall of the USSR, Eastern Europeans have increased their appetites for consumer goods. The most rapid growth in energy consumption now occurs in less developed countries because of rising affluence, consumption, and population.
Terms
Less developed countries include all countries in Africa, Asia (excluding Japan), and Latin America and the Caribbean, and the regions of Melanesia, Micronesia, and Polynesia.
More developed countries include all countries in Europe, North America, Australia, New Zealand, and Japan.
Population growth and distribution have significant roles to play in the sustainability of the world’s vast resources. Not only the number of people, but also the lifestyle, consumption patterns, and regions people inhabit and use directly affect the environment. The relationship between population growth and environmental degradation may appear to be rather straightforward. More people demand more resources and generate more waste. Clearly one of the challenges of a growing population is that the mere presence of so many people sharing a limited number of resources strains the environment. But when looking at the impact of human activities, the situation is more complicated due to the wide variety of government policies, technologies, and consumption patterns worldwide.
The link between population growth and the environment is found somewhere between the view that population growth is solely responsible for all environmental ills and the view that more people means the development of new technologies to overcome any environmental problems. Most environmentalists agree that population growth is only one of several interacting factors that place pressure on the environment. High levels of consumption and industrialization, inequality in wealth and land distribution, inappropriate government policies, poverty, and inefficient technologies all contribute to environmental decline. In fact, population may not be a root cause in environmental decline, but rather just one factor among many that exacerbate or multiply the negative effects of other social, economic, and political factors.
Many of the world’s population live in poor countries already strained by food insecurity; inadequate sanitation, water supplies and housing; and an inability to meet the basic needs of the current population. These same countries are also among the fastest growing places in the world. A large proportion of these populations are supported through subsistence agriculture. As populations grow, competition for fertile land and the use of limited resources increase. The people living in these countries are also moving toward a greater standard of living, perhaps matching the lifestyles of the more developed countries whose current consumption patterns and resource use are not necessarily sustainable.
Food Production
Meeting the increasing demand for food is probably the most basic challenge and the most salient population and environmental crisis. But the fear that population size would one day exceed the food supply has not proved true. With the development of fertilizers, pesticides, and more efficient farming techniques, crop yields per acre have increased and the amount of land under cultivation has expanded. World food production has kept pace with population growth. Yet ironically, millions of people do not have enough to eat. Food insecurity is often a result of the unavailability of food, insufficient purchasing power, inappropriate distribution, or inadequate use of food at the household level. Poverty, natural disasters, political violence, and other geopolitical factors create a disproportionate distribution of the world’s food.
The gains in food production have been a result of increased yields in fertile lands and new cultivation of marginal lands through industrial agriculture. However, improper use of machinery, chemicals, and extensive irrigation, has resulted in the degradation of land and water resources. Land is made vulnerable to wind and water erosion. Misguided irrigation practices can mean an increase in soil salinity and a greater demand on irreplaceable groundwater. Chemical runoff from fertilizers and pesticides also damage water resources.
Nonindustrial farming or traditional agriculture that continues to intensify in less developed countries often involves the cultivation of fragile soils that are difficult to farm, such as drylands, highlands, and forests. When farmland expands toward fragile lands in order to keep pace with the needs of a growing population in a region, it can lead to deforestation, erosion, and desertification.
Water Resource Management
Population growth and distribution have always been linked to the availability of freshwater and the sustainability of renewable water resources. The demand for water has grown significantly over the last 50 years not only because of population growth, but also because of an increase in the uses of water for households, agriculture, and industrial production. Appropriate management of the world’s water resources is essential for meeting the demands of a growing population and for expanding water uses. At the same time, we must also prevent the further degradation of our water sources and clean up polluted waters.
A significant number of the world’s population lack access to an adequate supply of safe water for household use. In certain less developed countries, more than one-half of the population is without access to safe water. Water shortages and polluted waters lead to food insecurity and major health problems among the world’s poor.
Because water does not stop at national boundaries, the use of water upstream, pollution, and reduced flows will affect countries downstream. The future of the world’s water resources depends on improving management policies and practices globally. Water management institutions must incorporate efficient techniques for using water in industry and agriculture. And most important, management policies must involve the interests of the local community in collaboration with national governments in order to protect water rights and ensure success of programs.
Energy
CO2 Emissions per Capita, 2002
| Metric tons | |
| Less developed | 2.1 |
| More developed | 11.7 |
| Africa | 1.1 |
| America-Latin America/Caribbean | 2.5 |
| America-North | 19.6 |
| Asia | 2.6 |
| Europe | 8.4 |
| Oceania | 12.2 |
Source: Carl Haub, 2007 World Population Data Sheet.
Carbon dioxide emissions have grown dramatically in the past century because of human activity, chiefly the use of fossil fuels such as oil and coal, as well as changes in land use such as cutting down forests. These emissions are a key contributor to climate change that is expected to produce rising temperatures, lead to more extreme weather patterns, facilitate the spread of infectious diseases, and put more stress on the environment. The United States is the largest contributor of total carbon dioxide emissions, and has one of the highest per capita rates. The U.S. per capita emission rate has risen from 19.2 metric tons per person to 19.9 metric tons between 1990 and 2002, according to the World Resources Institute. Per capita use also has gone up in China, rising from 2.2 to 2.9 metric tons between 1990 and 2002. China is expected to surpass the United States in total carbon dioxide emissions by 2009.
The vast majority of energy comes from the burning of fossil fuels (oil, natural gas, and coal). The increased use of fossil fuels has a negative effect on the health of the environment in terms of air and water pollution. Air pollution from greater coal use and vehicle exhaust has led to acid rain, which is particularly damaging to forests, lakes, and streams. Rising fossil fuel use also means a greater build-up of carbon dioxide in the atmosphere, higher greenhouse gas emissions, and global warming.
The environmental costs of using fossil fuels have led to efforts to decrease their level of use. Alternative energy sources that are more efficient are being sought, such as renewable resources like hydropower and solar power. Reducing the environmental costs from energy consumption and ensuring there will be an adequate supply of energy for the future involves the careful management of existing and potential resources.
Terms
The loss of trees due to overcutting of forests. One consequence of deforestation is soil erosion, which results in the loss of protective soil cover and the water-holding capacity of the soil.
The process of grasslands being converted to desert mainly as a result of deforestation, overgrazing, and erosion due to poor land management.
A situation that exists when people lack secure access to sufficient amounts of safe and nutritious food for normal growth and development and an active and healthy life. Food insecurity may be chronic, seasonal, or transitory.
A group of primary energy sources created from the incomplete biological decomposition of dead organic matter. The fossil fuels include oil, coal, and natural gas and account for about 90 percent of all the energy consumed in the world.
The practice of supplying land with water artificially by means of ditches, pipes, or streams.
Less developed countries include all countries in Africa, Asia (excluding Japan), and Latin America and the Caribbean, and the regions of Melanesia, Micronesia, and Polynesia.
More developed countries include all countries in Europe, North America, Australia, New Zealand, and Japan.
The surface water runoff from local precipitation, the inflow from other regions, and the groundwater recharge that replenishes aquifers.
Farming at a level at which only enough food is produced to meet immediate local needs.
Future Growth
Population Growth Through Natural Increase, 1775–2000
Source: Population Reference Bureau.
Teachers Guide: Discussion Questions
- What were the levels of birth and death rates in less developed countries and in more developed countries in 1775?
- Describe how the birth and death rates in the less developed and more developed countries changed from 1775 to 2000.
Reading
- What are the components of population change?
- How does the world population growth rate today compare with the growth rate at other times in history?
- What were the causes of the “mortality revolution” in Europe and North America?
- Compare and contrast the demographic transition in more developed and less developed countries.
- How are population projections made?
Data
The rate of natural increase is the difference between birth and death rates. It measures the degree to which a population is growing. Since birth and death rates are measured as the number of births (or deaths) occurring per 1,000 population, the difference is divided by 10 to convert this rate into a percentage.
- Using the birth and death rates from the World Population Data Sheet, calculate the rate of natural increase for five countries or regions. (Due to rounding, answers may differ slightly from the rates of natural increase on the data sheet.)
- Find five countries that appear to have reached the fourth stage of the demographic transition (in which death rates are higher than birth rates).
Discussion
- What technological, economic, and social factors might cause levels of mortality and fertility to change?
- What do you think the prospects are for the changes in birth and death rates in the United States?
- Examine the projections shown in “Future of World Population Growth: Three Scenarios, 2000 to 2050.” Which projection do you think is most likely? Why?
Question and Answer: When Could World Population Stop Growing?
World population will stop growing when the birth rate equals the death rate; no one knows whether this will happen.
The birth rate and the death rate would eventually reach equilibrium several decades after couples average two children each. This two-child average is called replacement level fertility, because each couple simply replaces themselves, not increasing the size of each generation. The total fertility rate (TFR) refers to the average number of children women are having. When the total fertility rate is at replacement (2.1 children per family), the two children born essentially replace the parents when they die. The replacement level TFR is 2.1, not 2.0, since not all females survive to their childbearing years. In countries with high mortality rates, such as certain African countries with high HIV/AIDS prevalence rates, replacement level fertility can be 3 or more.
When might it be possible for world population growth to come to an end? The United Nations has projected that growth could end in the latter part of this century if the use of family planning were essentially universal and couples limited themselves to fewer than two children. Under such a scenario, world population would be about 9 billion by the end of the century and in slow decline. There is certainly no guarantee that this will happen. If couples average more than 2.1 children in the long term, world population could pass 14 billion by century’s end.
We do know that world population growth is inevitable in the near term. But there is a wide range of possible world population scenarios. Three plausible projections published by the United Nations in 2006 lead to outcomes ranging from 7.8 billion people to 10.8 billion people in 2050.
Terms
The annual number of births per 1,000 total population.
The annual number of deaths per 1,000 total population.
Deaths as a component of population change.
The average number of children a women would have assuming that current age-specific birth rates remain constant throughout her childbearing years (usually considered to be ages 15 to 49).
Future Growth
Population change affects all our lives in a much more immediate way today than it has throughout most of human history. For the first one-half million years of human existence, the population growth rate was about zero. The population stayed about the same size from year to year. It was not until the 1700s that the modern era of population growth began. Between 1850 and 1900, the annual growth rate reached 0.5 percent. The rate surged to 2.0 percent by the mid-1960s, dropped to 1.7 percent by the mid-1980s, and declined to about 1.2 percent by 2005.
Why has world population grown at such different rates throughout history? Population change results from the interaction of three variables: births, deaths, and migration. This relationship is summarized by a formula known as the balancing equation. The difference between births and deaths in a population produces the natural increase (or decrease) of a population. Net migration is the difference between the number of persons entering a geographic area (immigrants) and those leaving (emigrants). Natural increase usually accounts for the greatest amount of growth in a population, especially within a short period of time. For the world, growth occurs only when there are more births than deaths; for individual countries, migration is also a factor.
The Mortality Revolution
Human population grew rapidly during the Industrial Revolution, not because the birth rate increased, but because the death rate began to fall. This mortality revolution began in the 1700s in Europe and spread to North America by the mid-1800s. Death rates fell as new farming and transportation technology expanded the food supply and lessened the danger of famine. New technologies and increasing industrialization improved public health and living standards. Late in the 19th century, birth rates also began to fall in Europe and North America, slowing the population growth that had resulted from continued moderately higher birth rates than death rates.
Since 1900, both birth and death rates in the more developed countries have continued to fall in tandem, with a few interruptions. A worldwide influenza pandemic in 1918 caused the death of between 20 million and 40 million people and produced a temporary increase in the death rate. A slight increase in birth rates occurred after World Wars I and II. Since the 1950s, birth rates have continued their decline, while death rates declined into the 1960s but have been slowly increasing since. In some European countries, declining birth rates and an increase in death rates are contributing to declining population size. The total fertility rate (TFR) in many more-developed countries is well below replacement levels of two children per couple.
The Demographic Transition
Demographers have attempted to explain the experience of these more developed countries as a demographic transition from high birth rates and death rates to the current low levels. This process tends to occur in three stages. First, birth and death rates are both high, so little growth occurs. Second, death rates fall due to improved living conditions, while birth rates remain high. During this period population grows rapidly. The third stage of the transition is reached when fertility falls and closes the gap between birth and death rates, resulting again in a slower pace of population growth. The figure “Population Growth Through Natural Increase” is a crude representation of this transition. All the more developed countries have entered this third stage of the demographic transition, and some have gone on to a fourth stage in which death rates are higher than birth rates, and the population declines.
Components of Population Change
In contrast to the more developed countries, the less developed countries—in Asia, Africa, and Latin America—had both higher birth and death rates in the 1900s than Europe and North America had in the 1700s, and these higher rates have continued throughout the 20th century. In most less developed countries, the mortality revolution did not begin in earnest until after World War II, and it followed a different pattern than that in European countries. Birth and death rates were higher at the start of the demographic transition than they had been in Europe or North America. Death rates fell rapidly in less developed countries through the introduction of medical and public health technology; antibiotics and immunization reduced deaths from infectious diseases; and insecticides helped control malaria.
In the second stage of the demographic transition of these regions, mortality declines led to continued population growth. With declining mortality and high fertility rates, the population growth of the less developed countries achieved an unparalleled 2.5 percent per year in the late 1960s. Overall, mortality rates in the less developed countries fell much faster than during the demographic transition in the more developed countries. As a result, there was a large gap in the percentage of growth between these two regions. Since 1970, birth rates have fallen in less developed countries, but the death rate has fallen faster. The population growth rate is still high, about 1.4 percent in 2005. While the patterns of fertility decline have varied dramatically throughout the less developed world, many countries are well into the transition process. Even in sub-Saharan Africa, where birth rates remained high through much of the 1980s and 1990s, fertility rates in most countries are declining.
Projections of World Population
No one really knows how large the world’s population will be in the future. But we can make educated guesses by looking at past and present trends in two of the components of population growth: births and deaths. The third component, migration, can affect the growth of individual countries, but not world population.
The figure “Future of World Population Growth” illustrates three scenarios for population change, depending on levels of fertility. World population is projected to increase to 8 billion by 2025 and to reach 9.2 billion by 2050 according to the medium scenario where fertility reaches 2.0 children per women.
Future of World Population Growth: Three Scenarios, 2000 to 2050
Source: United Nations, World Population Prospects, The 2006 Revision.
Most of the world’s population growth is likely to continue to be in less developed countries. Asia will continue to hold the majority of the world’s people, and Africa will gain a larger share than it has at present. The population of these regions would almost double by 2050 according to moderate projections. In 2050, close to 90 percent of world population could live in countries currently considered less developed, compared with about 80 percent today.
Terms
The annual number of births per 1,000 total population.
The annual number of deaths per 1,000 total population.
The historical shift of birth and death rates from high to low levels in a population. The decline of mortality usually precedes the decline in fertility, thus producing rapid population growth during the transition period.
The process of leaving one country to take up permanent or semipermanent residence in another.
The number of persons added to (or subtracted from) a population in a year due to natural increase and net migration; expressed as a percentage of the population at the beginning of the time period.
The process of entering one country from another to take up permanent or semipermanent residence.
Less developed countries include all countries in Africa, Asia (excluding Japan), and Latin America and the Caribbean, and the regions of Melanesia, Micronesia, and Polynesia.
More developed countries include all countries in Europe, North America, Australia, New Zealand, and Japan.
Deaths as a component of population change.
The birth rate minus the death rate, implying the annual rate of population growth without regard for migration. Expressed as a percentage.
The average number of children a women would have assuming that current age-specific birth rates remain constant throughout her childbearing years (usually considered to be ages 15 to 49).
Health
Major Causes of Death in the United States and Peru
* Primarily lower respiratory infections, including pneumonia.
Sources: National Center for Health Statistics, Leading Causes of Death, 1900-1998; World Health Organization, Causes of Death and Burden of Disease Estimates by Country, 2002; and National Center for Health Statistics, National Vital Statistics Reports 55, no. 19 (August 21, 2007).
Teachers Guide: Discussion Guide
- What was the leading cause of death in the United States in 2004? What proportion of deaths was attributable to this cause in the United States in 1900 and in Peru in 2002?
- What were the leading causes of death in Peru in 2002? How does this compare to the United States in 1900 and 2004?
Reading
- How have life expectancies changed in more developed countries since the Roman Empire?
- Why are infant mortality rates over 100 in some less developed countries?
Data
- Examine the columns on the World Population Data Sheet showing infant mortality and life expectancy. Find these variables for 10 countries and examine their relationship. Next, examine the relationship between the infant mortality rate, the birth rate, and GNI per capita.
Discussion
- Consider the implications of people’s health on decisionmakers in local governments.
Question and Answer: Does AIDS Have a Significant Impact on Population Growth?
The high degree of HIV prevalence worldwide has had an impact on population growth rates. In the early 1990s, few experts predicted the current level of HIV/AIDS cases. In fact, many believed that AIDS would have little or no impact on population growth. At that time, it was difficult to predict or imagine that there would be any country with 25 percent of the population between the ages of 15 to 49 living with HIV.
Since the bubonic plague of the 14th century, no epidemic has had as strong an influence on population growth as HIV/AIDS. The plague, or Black Death, killed an estimated 25 million to 35 million people in Europe alone, a number that represented approximately one-third of its population. According to recent estimates by the Joint United Nations Programme on HIV/AIDS (UNAIDS) and the World Health Organization (WHO), 33.2 million people were living with HIV in 2007.
Percent of World’s HIV/AIDS Cases, 2005
Note: Numbers are rounded.
Source: United Nations Population Division, Population and HIV/AIDS 2007 Wallchart.
In some regions, the impact of AIDS has been more pronounced. Africa accounts for 71 percent of the global HIV/AIDS cases, despite the fact that only 14 percent of the world’s population lives there. In nine countries in Africa, at least one out of every 10 adults is HIV positive. Asia makes up the next largest proportion of all HIV/AIDS cases at 14 percent.
For some countries, the AIDS epidemic has nearly erased improvements in life expectancy achieved in the last 20 years. In southern Africa, one of the worst affected regions, life expectancy has declined from 61 to 49 years over the last two decades. The most direct impact has been the increase in the overall number of deaths. Mortality patterns of adults are much higher than they would have been if AIDS were not so prevalent. Additionally, infant and child mortality rates in some countries are higher than they would have been in the absence of AIDS.
As AIDS reshapes the distribution of deaths by age, it is affecting the population composition of many places. Between 1985 and 1990, deaths in eastern Africa were concentrated among young children and older adults, while adults ages 20 to 49 accounted for a smaller share of deaths: 16 percent. However, by the year 2010, it is expected that deaths among adults ages 20 to 49 will double, accounting for almost 30 percent of AIDS deaths. Deaths of large numbers of women in their reproductive years and the lower survival prospects of infected children will also reduce the size of the younger population. The new age and sex structure for some populations will result in lower growth rates. Still, the overall population size of affected countries is projected to increase due to relatively high fertility levels. Additionally, deaths from HIV have seen a decline in recent years due to the scale-up of antiretroviral treatment. The greatest impact of the epidemic on population growth is that the rate of growth is now slower.
Terms
The composition of a population as determined by the number or proportion of males and females in each age category. The age-sex structure of a population is the cumulative result of past trends in fertility, mortality, and migration. Information on age-sex composition is essential for the description and analysis of many types of demographic data.
The annual number of births per 1,000 total population.
The number of persons added to (or subtracted from) a population in a year due to natural increase and net migration; expressed as a percentage of the population at the beginning of the time period.
The estimated percent of adults ages 15 to 49 living with HIV/AIDS.
The average number of years a newborn infant can expect to live under current mortality levels. Most commonly cited as life expectancy at birth.
Deaths as a component of population change.
Declining mortality, not rising fertility, has been the cause of the accelerating pace of world population growth. By attacking the causes of death that have kept population growth low for most of human existence, we have extended life expectancies and multiplied our numbers.
Life expectancy has increased steadily through history. During the Roman Empire, average life expectancy at birth was a brief 22 years. By the Middle Ages it had risen to about 33 years in England, and increased to 43 years by the middle of the 19th century. In the early 1900s, life expectancies in more developed countries ranged from 35 to 55. They have climbed to about 77 years today, and continue to improve. Meanwhile, life expectancy in less developed countries has gradually climbed, rising to about 65 years today.
Initial declines in mortality can be attributed to improvements in public health and living standards that accompanied the Industrial Revolution. Greater declines in the early 20th century were attributable to improvements in medical technology, which led to the control of such infectious diseases as smallpox and cholera. Further improvements in life expectancy are anticipated in most countries. In countries where death from infectious diseases is minimal, the improvements will come from the decline in mortality from degenerative diseases such as heart disease and cancer. However, in some countries, the spread of AIDS and other infectious ailments is a potential threat to further gains in life expectancy. In parts of Africa, where the spread of HIV infection is disproportionately high, life expectancy has been declining.
Causes of Death
The figure “Major Causes of Death in the United States and Peru” is useful for developing a better understanding of the changes in mortality in this century. It shows the major causes of death for the United States in 1900 and 2004, and for Peru in 2002. Each column accounts for all causes of death with the top causes specified. Some causes are combined because of their similarities. Data on cause of death should be interpreted cautiously because some causes are more easily identified than others and are reported more completely.
In the United States in 1900, pneumonia and influenza, tuberculosis, and diarrhea accounted for almost one-third of all deaths. Since then, mortality rates from these diseases have declined sharply. For example, pneumonia and influenza, which accounted for 12 percent of deaths in 1900 in the United States, accounted for 3percent in 2004. Heart disease and cancer, which account for half of all deaths today, caused only about 12 percent of deaths in 1900.
In Peru today, the causes of death are broadly dispersed. About half are attributable to the top four causes: cancer, respiratory infections, heart disease, and accidents. As Peru and other countries continue to develop, their causes of death may more closely resemble those of the United States today. As life expectancy improves and the role of infectious, parasitic, and respiratory infections further diminishes, more people will survive to older ages and chronic degenerative diseases such as stroke, cancer, and heart disease will make up a larger proportion of deaths.
In less developed countries, the chances of dying are greatest at infancy and remain high during the first few years of childhood. A newborn child is fragile and has not developed immunities to common ailments. When a country has a high rate of infant death, it usually signals high mortality risk from infectious, parasitic, communicable, and other diseases associated with poor sanitary conditions and undernutrition. As a result, the infant mortality rate (IMR), or annual number of deaths of children under age 1 per 1,000 live births, is considered one of the most sensitive measures of a nation’s health.
Worldwide, over 10 million children die annually before their fifth birthday. As the figure “Deaths by Cause for Children Under Age 5” indicates, about one-third of these deaths occur in the neonatal period (in the first 28 days of life). Neonatal causes include deaths from tetanus, severe infections, and premature births. Following neonatal causes, two of the primary causes of infant and child deaths are acute respiratory infections (such as pneumonia) and diarrhea. Other infectious diseases, such as malaria and measles, are also major causes of deaths to infants and children. Death from these conditions is almost unheard of for infants in more developed countries. However, in less developed countries where undernutrition is prevalent, medical facilities are scarce, and living areas may be unsanitary, infant deaths are common.
In 2007, world IMRs ranged from 2.4 per 1,000 births in Iceland to 166 per 1,000 births in Afghanistan, as shown in the figure “World Infant Mortality Rates in Selected Countries.” As countries develop economically, infant mortality usually declines. The IMR in the United States was probably about 100 in 1900—around the level of the IMRs of some of the poorest countries in the world today. The IMR in the United States has now fallen to below 10. Many countries have even lower rates, with Iceland, Singapore, Japan, and Sweden heading the list.
Terms
The annual number of deaths of infants under age 1 per 1,000 live births.
Less developed countries include all countries in Africa, Asia (excluding Japan), and Latin America and the Caribbean, and the regions of Melanesia, Micronesia, and Polynesia.
The average number of years a newborn infant can expect to live under current mortality levels. Most commonly cited as life expectancy at birth.
More developed countries include all countries in Europe, North America, Australia, New Zealand, and Japan.
Deaths as a component of population change.
Migration
REGIONAL ORIGINS OF IMMIGRANTS TO THE UNITED STATES, SELECTED YEARS
Source: Immigration and Naturalization Service, 2007 Yearbook of Immigration Statistics.
Teachers Guide: Discussion Questions
How has the proportion of Asian immigrants changed during the 20th century? The proportion of Latin Americans?
Reading
- How much does immigration contribute to population growth in the United States?
- Why do people move?
- Give examples of other “push” and “pull” factors.
Data
-
- Obtain data from a library, your state data center, the U.S. Census Bureau, or the Population Reference Bureau on the recent components of change for your state. How much growth in your state is due to net migration?
Discussion
-
- Where did your ancestors come from? If your ancestors are not American Indian, Alaska Native, or Native Hawaiian, when did they come to the United States? Why?
Question and Answer: How Densely Populated is the Planet?
World population grows as a result of births and declines as a result of deaths. Net migration is the difference between the number of people entering a geographic area (immigrants) and those leaving (emigrants). Over time, migration contributes more than just the initial number of people moving into an area, because the children and grandchildren born to the immigrant population add several times the original number to the population base. There is also an increase in the number of deaths as a result of in-migration.
Most Americans are immigrants or descendants of immigrants who arrived here over the past 200 years. Only a small fraction of the population is related to the American Indians who were here when the first European settlers arrived in the 1600s.
Australia and Brazil are other countries whose current populations consist primarily of descendants of persons who immigrated there during the past two centuries.
International Migration
In absolute numbers, international migration is at an all-time high. About 145 million people lived outside their native countries in the mid-1990s, and that number increased to roughly 175 million in 2005. Currently, the largest immigration flows are from Latin America and Asia into North America, and from Eastern Europe, the countries of the former Soviet Union, and North Africa into Northern and Western Europe. The Middle East draws migrants from Africa and Asia and hosts millions of refugees from within the region. There is considerable migration within Asia, Africa, and Latin America.
Why People Move
Most people move for economic reasons, but some migrate to escape political or religious persecution or simply to fulfill a personal dream. Some experts divide the many reasons people leave their homes for a new one into push and pull factors. Push factors might be widespread unemployment, lack of farmland, famine, or war at home. The Great Depression (1929–1939) is a good example of a push factor, as hard times encouraged more residents to leave the United States than move in. In the 1980s and 1990s, hundreds of thousands of Africans were pushed out of their homelands to neighboring countries because of famine and civil war.
Factors that attract migrants are called pull factors. These include a booming economy, favorable immigration laws, or free agricultural land in the area to which the migrant is moving. For example, the labor shortage in Japan is pulling record numbers of legal and illegal immigrants to fill the low-status, low-paying, or dangerous jobs that Japanese natives reject. In order to keep a working population that can support its elderly, Japan would need 17 million new immigrants by 2050, according to a recent United Nations report. Other estimates have said Japan would need 400,000 new immigrants each year; however the idea of increased immigration is not favorable to most Japanese.
The majority of migrants to the United States in the past 200 years were European. During the first decade of this century nearly 9 million immigrants entered this country, and more than 90 percent were from Europe (see chart, “Regional Origins of Immigrants to the United States, Selected Years”). By mid-century, just half of the migrants were from Europe. The total number of immigrants fell to around 1 million in the 1940s. In the 1980s the number of migrants increased to levels similar to those at the turn of the century. But 84 percent of these migrants were from Latin America and Asia, and just 10 percent were from Europe. The volume of legal immigration and the prevalence of migrants from Asia and Latin America will continue in the new century.
The origins of immigrants change over time, as do their numbers and the effect that they have on U.S. population growth. According to one estimate, about 42 percent of the U.S. population in 1900 resulted from immigration during the preceding century. Immigration was an even greater factor in growth between 1900 and 1950, when 20 million people entered the country. Natural increase added an average of 1 percent of the population increase per year during that period. At that rate the population would have doubled in about 70 years, but it took only 50 years to double. Migration stepped up the doubling by 20 years (see figure, “Percentage of U.S. Population Growth from Migration”). Many immigrants have children once they arrive in the United States, creating further momentum for population growth. Currently, fertility rates of immigrants are higher than those of the U.S.-born population.
The volume of legal migration has fluctuated since the 1930s. Immigration has accounted for an increasing portion of population growth as American women began having fewer children. If current patterns continue, the population of the United States could rise to 438 million in 2050, from 300 million in 2006. According to a recent report by the Pew Research Center, 82 percent of U.S. population growth between 2005 and 2050 will be due to new immigrants and their U.S.-born descendants.
Government Policies
Of the three components of population change, migration is the most difficult component to predict and is most affected by government policies. Because nations can control their borders, they may regulate the flow of legal immigrants. The oil-producing countries in the Middle East offered financial incentives to attract immigrants, just as the United States and Australia once offered free land. In 1990, Japan permitted employment rights and residence for ethnic Japanese from Latin America. The United States’ immigrant population (legal and illegal) reached an estimated 37.9 million in 2007. An estimated 12 million were unauthorized.
Terms
The process of leaving one country to take up permanent or semipermanent residence in another.
The process of entering one country from another to take up permanent or semipermanent residence.
The net effect of immigration and emigration on an area’s population in a given time period, expressed as an increase or decrease.
A migration theory that suggests that circumstances at the place of origin (such as poverty and unemployment) repel or push people out of that place to other places that exert a positive attraction or pull (such as a high standard of living or job opportunities).
The rate at which a population is increasing (or decreasing) in a given year due to a surplus (or deficit) of births over deaths, expressed as a percentage of the base population.
Population Growth
WORLD POPULATION GROWTH, 1950-2050
Source: United Nations Population Division, World Population Prospects, The 2008 Revision.
Teachers Guide: Discussion Questions
According to the projection shown on “World Population Growth, 1950–2050,” about how much growth is projected to occur in less developed countries between 1950 and 2050? How does this compare to population growth in more developed countries?
Reading
- During what “age” of human history did the world’s population begin to grow rapidly?
- What was the world’s population in 2005? How many people were added to the world population in 2005?
- In which region does the greatest share of the world’s population reside?
- Which regions have the fastest rate of population growth?
Data
Examine the World Population Data Sheet.
- Select five countries and find the corresponding population estimates and rates of natural increase. Apply the rate of natural increase to the population to find the number of people being added to those countries this year.
- Find the countries with the highest and lowest rates of natural increase. In which regions are these countries located?
Discussion
- World population growth was very slow during the Stone Age. Why was growth so slow during this period?
Question and Answer: Has the World’s Population Changed Much Over Time?
For the last 50 years, world population multiplied more rapidly than ever before, and more rapidly than it is projected to grow in the future. In 1950, the world had 2.5 billion people; and in 2005, the world had 6.5 billion people. By 2050, this number could rise to more than 9 billion (see chart “World Population Growth, 1950-2050”).
Anthropologists believe the human species dates back at least 3 million years. For most of our history, these distant ancestors lived a precarious existence as hunters and gatherers. This way of life kept their total numbers small, probably less than 10 million. However, as agriculture was introduced, communities evolved that could support more people.
World population expanded to about 300 million by A.D. 1 and continued to grow at a moderate rate. But after the start of the Industrial Revolution in the 18th century, living standards rose and widespread famines and epidemics diminished in some regions. Population growth accelerated. The population climbed to about 760 million in 1750 and reached 1 billion around 1800.
WORLD POPULATION DISTRIBUTION BY REGION, 1800-2050
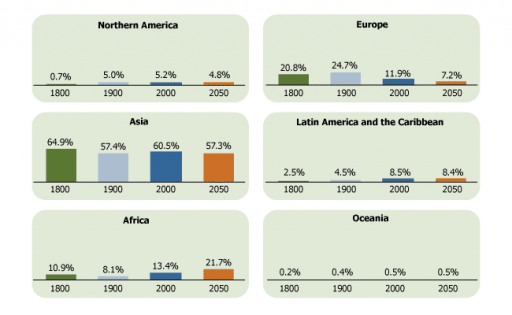
Source: United Nations Population Division, Briefing Packet, 1998 Revision of World Population Prospects; and World Population Prospects, The 2006 Revision.
By 1900, Asia’s share of the world population declined to 57 percent of the global total, as Europe, North America, and Latin America grew rapidly.
Since rates of population growth are currently highest in the less developed regions, their share of world population will increase. In 2000, Asia’s population rose again to account for 60 percent of the world total; Africa’s share increased to exceed Europe’s portion.
If current trends continue, Asia’s population will decrease slightly to 57 percent of the world total in 2050, Africa’s share of the world’s population will rise to about 20 percent, and Europe’s share will drop below Latin America’s.
Over time, the distribution of population changes because of variations in the rate of natural increase and net migration. In the United States between 60 percent and 70 percent of annual population growth is from natural increase and the rest is driven by international migration.
Rural-to-urban migration, combined with natural increase, is leading to a disproportionate increase in urban population, especially in less developed countries. A century ago, only 10 percent of the world’s population lived in urban areas. By 1950, the urban share had risen to 29 percent, and today it is 49 percent. By the year 2030, 60 percent of the world’s population is projected to live in urban areas, ranging from market towns to megacities. Urban areas are getting larger. In 1950, only the Tokyo and New York urban areas had over 10 million people. By 2025, there could be more than 25 urban areas with over 10 million people. Eight of these urban areas would hold over 20 million people each. Only two of the 10 largest urban areas projected for 2025 are expected to be in the more developed countries (see table, “Population of Cities With 10 Million Inhabitants or More, 1950, 2007, and 2025”).
POPULATION OF CITIES WITH 10 MILLION INHABITANTS OR MORE, 1950, 2007, AND 2025
(IN MILLIONS)
| wdt_ID | 1950 | Millions | 2007 | Millions | 2025 | Millions |
|---|---|---|---|---|---|---|
| 1 | ||||||
| 2 | New York | 12.3 | Tokyo | 35.7 | Tokyo | 36.4 |
| 3 | Tokyo | 11.3 | New York | 19.0 | Bombay | 26.4 |
| 4 | Mexico City | 19.0 | Delhi | 22.5 | ||
| 5 | Mumbai | 19.0 | São Paulo | 21.4 | ||
| 6 | São Paulo | 18.8 | Mexico City | 21.0 | ||
| 7 | Delhi | 15.9 | New York | 20.6 | ||
| 8 | Shanghai | 15.0 | Kolkata | 20.6 | ||
| 9 | Kolkata | 14.8 | Shanghai | 19.4 | ||
| 10 | Dhaka | 13.5 | Karachi | 19.1 | ||
| 11 | Buenos Aires | 12.8 | Kinshasa | 16.8 | ||
| 12 | Los Angeles | 12.5 | Lagos | 15.8 | ||
| 13 | Karachi | 12.1 | Cairo | 15.6 | ||
| 14 | Cairo | 11.9 | Manila | 14.8 | ||
| 15 | Rio de Janeiro | 11.7 | Los Angeles | 13.7 | ||
| 16 | Osaka | 11.3 | Rio de Janeiro | 13.4 | ||
| 17 | Beijing | 11.1 | Jakarta | 12.4 | ||
| 18 | Manila | 11.1 | Istanbul | 12.1 | ||
| 19 | Moscow | 10.5 | Guangzhou | 11.8 | ||
| 20 | Istanbul | 10.1 | Osaka | 11.4 | ||
| 21 | Moscow | 10.5 | ||||
| 22 | Shenzen | 10.2 | ||||
| 23 | Madras | 10.1 | ||||
| 24 | Paris | 10.0 |
Source: United Nations Population Division, World Urbanization Prospects, The 2007 Revision.
Terms
The number of persons added to (or subtracted from) a population in a year due to natural increase and net migration; expressed as a percentage of the population at the beginning of the time period.
Less developed countries include all countries in Africa, Asia (excluding Japan), and Latin America and the Caribbean, and the regions of Melanesia, Micronesia, and Polynesia.
More developed countries include all countries in Europe, North America, Australia, New Zealand, and Japan.
The net effect of immigration and emigration on an area’s population in a given time period, expressed as an increase or decrease.
The birth rate minus the death rate, implying the annual rate of population growth without regard for migration. Expressed as a percentage.
Percentage of the total population living in areas termed urban by that country. Typically, the population living in towns of 2,000 or more or in national and provincial capitals is classified as urban.
In 1800, the vast majority of the world’s population (85 percent) resided in Asia and Europe, with 65 percent in Asia alone (see chart, “World Population Distribution by Region, 1800–2050”). By 1900, Europe’s share of world population had risen to 25 percent, fueled by the population increase that accompanied the Industrial Revolution. Some of this growth spilled over to the Americas, increasing their share of the world total.
World population growth accelerated after World War II, when the population of less developed countries began to increase dramatically. After millions of years of extremely slow growth, the human population indeed grew explosively, doubling again and again; a billion people were added between 1960 and 1975; another billion were added between 1975 and 1987. Throughout the 20th century each additional billion has been achieved in a shorter period of time. Human population entered the 20th century with 1.6 billion people and left the century with 6.1 billion.
The growth of the last 200 years appears explosive on the historical timeline. The overall effects of this growth on living standards, resource use, and the environment will continue to change the world landscape long after.
Exponential Growth
As long ago as 1789, Thomas Malthus studied the nature of population growth in Europe. He claimed that population was increasing faster than food production, and he feared eventual global starvation. Of course he could not foresee how modern technology would expand food production, but his observations about how populations increase were important. Population grows geometrically (1, 2, 4, 8 …), rather than arithmetically (1, 2, 3, 4 …), which is why the numbers can increase so quickly.
A story said to have originated in Persia offers a classic example of exponential growth. It tells of a clever courtier who presented a beautiful chess set to his king and in return asked only that the king give him one grain of rice for the first square, two grains, or double the amount, for the second square, four grains (or double again) for the third, and so forth. The king, not being mathematically inclined, agreed and ordered the rice to be brought from storage. The eighth square required 128 grains, the 12th took more than one pound. Long before reaching the 64th square, every grain of rice in the kingdom had been used. Even today, the total world rice production would not be enough to meet the amount required for the final square of the chessboard. The secret to understanding the arithmetic is that the rate of growth (doubling for each square) applies to an ever-expanding amount of rice, so the number of grains added with each doubling goes up, even though the rate of growth is constant.
Similarly, if a country’s population begins with 1 million and grows at a steady 3 percent annually, it will add 30,000 persons the first year, almost 31,000 the second year, and 40,000 by the 10th year. At a 3 percent growth rate, its doubling time — or the number of years to double in size — is 23 years. (The doubling time for a population can be roughly determined by dividing the current growth rate into the number “69.” Therefore, 69/3=23 years. Of course, if a population’s growth rate does not remain at this rate, the projected doubling time would need to be recalculated.)
The growth rate of 1.2 percent between 2000 and 2005, when applied to the world’s 6.5 billion population in 2005, yields an annual increase of about 78 million people. Because of the large and increasing population size, the number of people added to the global population will riain high for several decades, even as growth rates continue to decline.
Between 2005 and 2030, most of this annual growth will occur in the less developed countries in Africa, Asia, and Latin America whose population growth rates are much higher than those in more developed countries. The populations in the less developed regions will most likely continue to command a larger proportion of the world total. While Asia’s share of world population may continue to hover around 60 percent through 2050, Europe’s portion has declined sharply and is likely to drop even more during the 21st century. Africa would gain part of Europe’s portion, and the population in Latin America and the Caribbean would remain relatively constant around 8 percent (see chart, “World Population Distribution by Region, 1800–2050,” above).
The more developed countries in Europe and North America, as well as Japan, Australia, and New Zealand, are growing by less than 1 percent annually. Population growth rates are negative in many European countries, including Russia (-0.5%), Estonia (-0.4%), Hungary (-0.3%), and Ukraine (-0.8%). If the growth rates in these countries continue to fall below zero, population size would slowly decline. As the chart “World Population Growth, 1950–2050” shows, population increase in more developed countries is already low and is expected to stabilize.
Terms
The annual number of births per 1,000 total population.
The number of years required for the population of an area to double its present size, given the current rate of population growth. Population doubling time is useful to demonstrate the long-term effect of a growth rate, but should not be used to project population size. Many more-developed countries have very low growth rates. But these countries are not expected to ever double again. Most, in fact, likely have population declines in their future. Many less-developed countries have high growth rates that are associated with short doubling times, but are expected to grow more slowly as birth rates are expected to continue to decline.
The number of persons added to (or subtracted from) a population in a year due to natural increase and net migration; expressed as a percentage of the population at the beginning of the time period.
Less developed countries include all countries in Africa, Asia (excluding Japan), and Latin America and the Caribbean, and the regions of Melanesia, Micronesia, and Polynesia.
More developed countries include all countries in Europe, North America, Australia, New Zealand, and Japan.
Urbanization
LARGEST URBAN AGGLOMERATIONS, 1975, 2000, 2025
Teachers Guide: Discussion Guide
- Where will most of the new 10 million-plus cities spring up in 2025—in more developed or less developed countries?
- How did growth in London differ from that of Lagos in the past 50 years?
Reading
- What is the definition of an urban area?
- In 2000, did most of the world’s people live in rural or urban areas?
- Describe the differences in the patterns of urbanization in the more developed and less developed countries.
Data
-
- Find the column on the World Population Data Sheet showing the percent of population residing in urban areas. Also examine the column showing the percent of population in urban agglomerations of 750,000 or more. For a few countries from different regions, calculate the proportion of the country’s population living in these large urban areas. Do most urban residents reside in agglomerations of more than 750,000 residents or fewer?
Discussion
-
-
- Why are megacities increasing so rapidly in less developed countries? What are some implications of rapid growth in these cities?
-
Question and Answer: What are the Social Implications of Rapid Population Growth in Less Developed Countries?
This is a complex issue. Rapid population growth in less developed countries is linked to many problems—including poverty, hunger, high infant mortality, and inadequacies in social services, health services, and infrastructure (transportation, communication, etc.). It would be a gross oversimplification to say that population growth causes these problems. Population growth could just as easily have been the effect of economic insecurity and poor health care. However, rapid population growth may defeat efforts to combat poverty and hunger and to improve services, as increasing numbers of people put serious pressures on the economy and society of poor nations.
Poverty, for example, existed long before the recent period of rapid population growth. An assessment of poverty must consider the amount and type of natural resources, including minerals and geographic features that a country possesses or lacks. It must also include an examination of the country’s political and social structure. In areas where power and wealth are concentrated in the hands of a few, it is difficult for the poor to break out of the cycle of poverty that is often passed from generation to generation. Rapid population growth makes this effort even more difficult.
Hunger has always been a companion to poverty. Most experts agree that the world could feed today’s population, and a considerably larger number, if income were redistributed, if modern farming methods were used everywhere, if land reform policies were put into effect, if meat consumption were reduced, if non-nutritious crops were replaced by nutritious crops, and if waste and corruption were controlled. However, rapid population growth may intensify the hunger problem; in the most rapidly growing countries, population growth can reduce or eliminate food production gains resulting from modernization of farming. Population pressures may also encourage practices such as overirrigation and overuse of croplands, which undermine the capacity to feed larger numbers.
In some cases, population growth is quite directly related to a social problem because it increases the absolute numbers whose needs must be met. For example, some less developed countries have made enormous progress in increasing the percentage of children enrolled in school. However, because of population growth during the same period, the number of children who are not enrolled in school also increased because there were insufficient resources to meet the growing need. Similar observations could be made about jobs, housing, sanitation, and other human needs. These problems are compounded when large numbers migrate from rural to urban areas and increase the burden placed on already inadequate supplies and services.
Terms
Less developed countries include all countries in Africa, Asia (excluding Japan), and Latin America and the Caribbean, and the regions of Melanesia, Micronesia, and Polynesia.
More developed countries include all countries in Europe, North America, Australia, New Zealand, and Japan.
Countries differ in the way they classify population as “urban” or “rural.” Typically, a community or settlement with a population of 2,000 or more is considered urban. A listing of country definitions is published annually in the United Nations Demographic Yearbook.
Through most of history, the human population has lived a rural lifestyle, dependent on agriculture and hunting for survival. In 1800, only 3 percent of the world’s population lived in urban areas. By 1900, almost 14 percent were urbanites, although only 12 cities had 1 million or more inhabitants. In 1950, 30 percent of the world’s population resided in urban centers. The number of cities with over 1 million people had grown to 83.
The world has experienced unprecedented urban growth in recent decades. In 2008, for the first time, the world’s population was evenly split between urban and rural areas. There were more than 400 cities over 1 million and 19 over 10 million. More developed nations were about 74 percent urban, while 44 percent of residents of less developed countries lived in urban areas. However, urbanization is occurring rapidly in many less developed countries. It is expected that 70 percent of the world population will be urban by 2050, and that most urban growth will occur in less developed countries.
What is an urban area? An urban area may be defined by the number of residents, the population density, the percent of people not dependent upon agriculture, or the provision of such public utilities and services as electricity and education. Some countries define any place with a population of 2,500 or more as urban; others set a minimum of 20,000. There are no universal standards, and generally each country develops its own set of criteria for distinguishing urban areas. The United States uses a population density measure to define urban with a minimum population requirement of 2,500. The classification of metropolitan includes both urban areas as well as rural areas that are socially and economically integrated with a particular city.
When comparing countries it is often helpful to look beyond the proportion of populations that are rural or urban and instead consider the size of cities. Countries differ markedly in the distribution of their urban population. For example, many urban dwellers in Africa live in cities of fewer than 10,000 residents. In Argentina, 92 percent of the 2007 population was urban, and 32 percent of these people lived in just one city, Buenos Aires. In 2007, 38 percent of the world’s urbanites lived in agglomerations of 1 million or more inhabitants, and 15 percent resided in agglomerations of 5 million or more. Only 8 percent of Americans live in cities of 1 million or more.
Migration or Natural Increase
A city grows through natural increase—the excess of births over deaths—and because the in-migration of people from other cities, rural areas, or countries is greater than out-migration. More developed and less developed countries of the world differ not only in the percent living in cities, but also in the way in which urbanization is occurring.
During the 19th and early 20th centuries, urbanization resulted from and contributed to industrialization. New job opportunities in the cities spurred the mass movement of surplus population away from the countryside. At the same time, migrants provided cheap, plentiful labor for the emerging factories. While the proportion increased through rural to urban migration, high death rates in the cities slowed urban growth. Cities were unhealthy places because of crowded living conditions, the prevalence of contagious diseases, and the lack of sanitation. Until the mid-1800s, the number of deaths exceeded births in many large European cities. Migration accounted for as much as 90 percent of city growth during this period.
Urbanization in most less developed countries in the past 50 years contrasts sharply with the experience of the more developed countries. Death rates have fallen faster in urban areas because of greater access to health services. Because birth rates are relatively high in most less developed countries, the rates of natural increase are also quite high in cities. Migration also fuels urban growth in less developed countries as people leave the countryside in search of better jobs.
The figure “Growth of Urban Agglomerations” shows population growth in selected cities. New York and London are typical of large cities in more developed countries that arose in the 1800s and early 1900s, reached their current size mid-century, and have since experienced slow growth or decline. Cities in some less developed countries, such as Mexico City, grew very rapidly between 1950 and 1980, and are growing more slowly now. Many Asian and African cities, such as Lagos and Bombay, are experiencing very rapid growth now and are projected to continue at this pace.
Megacities
As the population increases, more people will live in large cities. Many people will live in the growing number of cities with over 10 million inhabitants, known as megacities. As the map “Largest Urban Agglomerations” shows, just three cities had populations of 10 million or more in 1975, one of them in a less developed country. Megacities numbered 16 in 2000. By 2025, 27 megacities will exist, 21 in less developed countries.
TOP 10 LARGEST URBAN AGGLOMERATIONS IN 1975, 2000, AND 2025
| wdt_ID | 1975 | Millions | 2000 | Millions | 2025 | Millions |
|---|---|---|---|---|---|---|
| 1 | Tokyo | 26.6 | Tokyo | 34.5 | Tokyo | 36.4 |
| 2 | New York | 15.9 | Mexico City | 18.0 | Mumbai | 26.4 |
| 3 | Mexico City | 10.7 | New York | 17.9 | Delhi | 22.5 |
| 4 | Osaka | 9.8 | São Paulo | 17.1 | Dhaka | 22.0 |
| 5 | São Paulo | 9.6 | Mumbai | 16.1 | São Paulo | 21.4 |
| 6 | Los Angeles | 8.9 | Mumbai | 16.1 | São Paulo | 21.4 |
| 7 | Buenos Aires | 8.8 | Kolkata | 13.1 | New York | 20.6 |
| 8 | Paris | 8.6 | Delhi | 12.4 | Kolkata | 20.6 |
| 9 | Kolkata | 7.9 | Buenos Aires | 11.9 | Shanghai | 19.4 |
| 10 | Moscow | 7.6 | Los Angeles | 11.8 | Karachi | 19.1 |
Source: United Nations, World Urbanization Prospects, The 2007 Revision.
Terms
The number of deaths per 1,000 population in a given year.
Less developed countries include all countries in Africa, Asia (excluding Japan), and Latin America and the Caribbean, and the regions of Melanesia, Micronesia, and Polynesia.
A city with a population of 10 million or more residents.
A large concentration of population, usually an area with 100,000 or more people. The area typically includes an important city with 50,000 or more inhabitants and the administrative areas bordering the city that are socially and economically integrated with it.
More developed countries include all countries in Europe, North America, Australia, New Zealand, and Japan.
The rate at which a population is increasing (or decreasing) in a given year due to a surplus (or deficit) of births over deaths, expressed as a percentage of the base population.
Countries differ in the way they classify population as “urban” or “rural.” Typically, a community or settlement with a population of 2,000 or more is considered urban. A listing of country definitions is published annually in the United Nations Demographic Yearbook.
Refers to the population contained within the contours of a contiguous territory inhabited at urban density levels without regard to administrative boundaries. It usually incorporates the population in a city or town plus that in the sub-urban areas lying outside of but being adjacent to the city boundaries.
Growth in the proportion of a population living in urban areas.
Women
WOMEN’S EDUCATION AND FAMILY SIZE IN SELECTED COUNTRIES, 2000s
Source: Demographic and Health Surveys, 2003–2006.
Teachers Guide: Discussion Guide
After examining the information on the figure, what can be observed about the relationship between women’s education and family size?
Reading
- What are some of the ways that education can play a role in determining family size?
- What determines the number of children a woman will have?
- What are some of the factors that “indirectly” affect fertility?
Data
- Contraceptive prevalence is a determinant of fertility. Using information from the World Population Data Sheet, prepare a graph to show the relationship between contraceptive use and fertility?
- What other indicators on the World Population Data Sheet might provide information on the status of women?
Discussion
- Consider how the status of women in the United States has affected family size.
Question and Answer: Which Policies Are Most Effective in Reducing Population Growth?
Since 1970, birth rates have dropped, sometimes quite rapidly, in many less developed countries. This is an encouraging sign to those governments that have identified rapid population growth as an obstacle to their development goals. Declines have occurred in settings that vary widely. In an attempt to influence the population size and composition of their country, governments have established population policies.
Research studies have found that organized programs to make family planning information and services widely available have the most immediate results and cost less than other programs. Less developed countries that have implemented successful programs have made a strong political commitment to culturally sensitive, conveniently located outreach programs that offer users a wide variety of family planning methods. In particular, programs in which female family planning workers visit women in their homes bring about a tremendous increase in the use of contraception. In traditional societies, family planning programs are most successful when community leaders, those people who have a strong influence on a group’s decisionmaking and on individual attitudes, support them. The importance of this factor is reinforced by a reanalysis of the fertility decline in 19th century Europe. The study found that a change in cultural attitudes toward the acceptability of limiting family size was as essential as the social and economic improvements that were occurring.
However, to reduce fertility to the level required to bring about slow population growth, social and economic improvement is necessary as well. Couples living in extreme poverty have little reason to think that having fewer children would improve their lives. Children may indeed represent their future security since many people depend on their children for household and agricultural work and for support in old age. Studies have found that when poor families achieve a certain level of income there is a drop in fertility. The availability of family planning services can help translate ideas about smaller family size into reality.
The status of women also affects fertility levels. Many women, especially in less developed countries, have few choices in life outside of marriage and children and tend to have large families. Investing in women, by providing education, health, and other services, helps to expand their opportunities and reduce their dependence on children for status and support.
Immigration policies are also used to regulate population growth. Some countries openly encourage emigration to relieve crowding and unemployment. Other countries restrict the number of people who may enter and become citizens. Some countries absorb many illegal immigrants despite specific policy choices, and others may choose to accept a large number of refugees.
Terms
The annual number of births per 1,000 total population.
The conscious effort of couples to regulate the number and spacing of births through artificial and natural methods of contraception.
The process of entering one country from another to take up permanent or semipermanent residence.
Less developed countries include all countries in Africa, Asia (excluding Japan), and Latin America and the Caribbean, and the regions of Melanesia, Micronesia, and Polynesia.
More developed countries include all countries in Europe, North America, Australia, New Zealand, and Japan.
Explicit or implicit measures instituted by a government to influence population size, growth, distribution, or composition.
The population of the world surged from 2.8 billion in 1955 to 6.5 billion 50 years later because birth rates remained high at the same time that death rates began to fall. The number of children that a couple will have is determined by many factors, including health, religion, culture, economic status, and the ability to have the number they wish to have. Many of these factors relate to the status of women—the social, economic, and cultural circumstances of women in society and of individual women in different societies. Because these factors help determine the number, spacing, and timing of births, women’s choices (or lack thereof) regarding childbirth directly affect population growth.
Factors Affecting Family Size
Biological, cultural, and socioeconomic conditions together determine the number of children that a woman will have. These conditions influence her exposure to intercourse and her ability to conceive a child, as well as the number of children she may wish to have. Some factors include age at marriage, use of family planning methods, and breastfeeding. Many socioeconomic factors are also important influences on fertility. These factors are sometimes indirectly related. Education, urbanization, labor force participation, and infant mortality have a strong correlation with levels of fertility. But it is difficult to determine direct causation and one must be careful not to confuse causation with correlation. Some factors may be merely related to fertility rates, and other unknown factors may be the real cause of different levels of fertility among different women and different societies.
Generally, the age at which a woman first marries is directly related to the number of children she will bear because it affects the length of time she will be at risk of becoming pregnant. Of course, unmarried women may also have children, but the vast majority of childbearing takes place within marriage throughout most of the world, which makes the age at marriage a valuable indicator of a woman’s lifetime fertility. The total fertility rate—or average births per woman—for women in the United States, who marry around age 25, is 2.1. Conversely, women in Niger, who marry earlier, average 7.1 children (see chart, “Women’s Age at First Marriage and Family Size”). Within countries, rural women tend to marry earlier than urban women and tend to have larger families. Access to contraception is an important contributor to the differences in the fertility rates among countries, but culture and socioeconomics weigh heavily as well.
Women’s access to education, health care, family planning, and employment all affect family size. Studies show that women who have completed primary school have fewer children than those with no education. Education is key because educated women are more likely to know what social, community, and health services, including family planning, are available and to have the confidence to use them. In addition, women with more education have more opportunities outside the home and can see the benefits of education for their children. Women who achieve a relatively high level of education are also more likely to enter the labor force before they marry or begin childbearing, and ultimately to have smaller families than women who marry in their teens. This trend is evident in almost every country where data are available. As the figure “Women’s Education and Family Size” above shows, women with a secondary school education have substantially smaller families than women with less education.
Evidence shows that efforts to lower birth rates may depend on improving the status of women. Part of the Cairo Programme of Action, developed at the 1994 International Conference on Population and Development, calls for universal access to education, employment opportunities for women, and an end to discrimination against women. Experiences in some countries have shown that fertility patterns can change in as little as a decade, and that voluntary policies and programs can be highly effective in encouraging the change.