178 Search Results Found For : "%EF%BF%BD%EF%BF%BD%EF%BF%BD%EF%BF%BD%EF%BF%BD%EF%BF%BD%EF%BF%BD%EF%BF%BD%EF%BF%BD%EF%BF%BD%EF%BF%BD%EF%BF%BD%EF%BF%BD%EF%BF%BD%EF%BF%BD%EF%BF%BD%EF%BF%BD%EF%BF%BD%EF%BF%BD%EF%BF%BD%EF%BF%BD%EF%BF%BD%EF%BF%BD%EF%BF%BDKaKaoTalk%3Aza33%EF%BF%BD%EF%BF%BD%EF%BF%BD%EF%BF%BD%EF%BF%BD%EF%BF%BD%EF%BF%BD%EF%BF%BD%EF%BF%BD%EF%BF%BD%EF%BF%BD%EF%BF%BD%EF%BF%BD%EF%BF%BD%EF%BF%BD%EF%BF%BD%EF%BF%BD%EF%BF%BD%3Awww.za32.net"
Report. Understanding Who Was Missed in the 2010 Census
(2019) Researchers use two main measures to determine who was missed in the 2010 Decennial Census: omissions and net undercounts. Omissions reflect the number of people who should have been counted in the census but were not, while net undercounts reflect the percent of people who were missed minus the percent who were double counted.
View Details
Array
(
[ID] => 11884
[id] => 11884
[title] => understanding-who-was-missed-in-the-2010-census
[filename] => understanding-who-was-missed-in-the-2010-census.pdf
[filesize] => 330111
[url] => https://www.prb.org/wp-content/uploads/2021/01/understanding-who-was-missed-in-the-2010-census.pdf
[link] => https://www.prb.org/resources/report-understanding-who-was-missed-in-the-2010-census/understanding-who-was-missed-in-the-2010-census-3/
[alt] =>
[author] => 15
[description] =>
[caption] =>
[name] => understanding-who-was-missed-in-the-2010-census-3
[status] => inherit
[uploaded_to] => 11882
[date] => 2021-01-12 03:10:25
[modified] => 2021-01-12 03:10:25
[menu_order] => 0
[mime_type] => application/pdf
[type] => application
[subtype] => pdf
[icon] => https://www.prb.org/wp-includes/images/media/document.png
)
Download
(0.3 MB)

Understanding Who Was Missed in the 2010 Census
(2019) Researchers use two main measures to determine who was missed in the 2010 Decennial Census: omissions and net undercounts. Omissions reflect the number of people who should have been counted in the census but were not, while net undercounts reflect the percent of people who were missed minus the percent who were double counted.

Project: Center for Public Information on Population Research (CPIPR)
Disadvantage for Black Families Compounded by Economic Circumstances of Kin
Race may be a social construct but it’s one with consequences that may span generations. While both Black and white families can experience upward or downward wealth mobility from one generation to the next, studies show the dramatic socioeconomic disadvantages for Black families have persisted across generations.

Growth and Migration in the American Southwest: A Tale of Two States
5 takeaways from population data in Arizona and New Mexico
What’s Driving the Decline in U.S. Population Growth?
(2012) Between 2010 and 2011, the U.S. population increased by 0.7 percent, after averaging 0.9 percent growth each year from 2000 through 2010.1 The United States added just 2.3 million people from 2010 to 2011, compared with 2.9 million from 2005 to 2006, just five years earlier.
Project: Demography and Economics of Aging and Alzheimer’s Disease
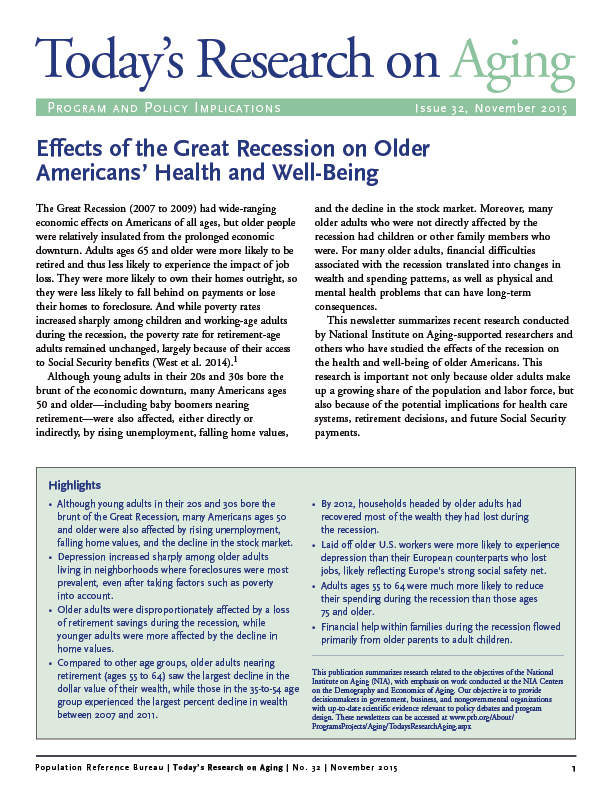
Effects of the Great Recession on Older Americans’ Health and Well-Being
This report summarizes recent research conducted by National Institute on Aging-supported researchers and others who have studied the effects of the recession on the health and well-being of older Americans.
View Details
Array
(
[ID] => 4328
[id] => 4328
[title] => TRA32-2015-great-recession-aging
[filename] => TRA32-2015-great-recession-aging.pdf
[filesize] => 121700
[url] => https://www.prb.org/wp-content/uploads/2020/11/TRA32-2015-great-recession-aging.pdf
[link] => https://www.prb.org/resources/todays-research-on-aging-issue-32-effects-of-the-great-recession-on-older-americans-health-and-well-being-pdf/tra32-2015-great-recession-aging/
[alt] =>
[author] => 15
[description] =>
[caption] => Today's Research on Aging, Issue 32. Effects of the Great Recession on Older Americans’ Health and Well-Being
[name] => tra32-2015-great-recession-aging
[status] => inherit
[uploaded_to] => 5829
[date] => 2020-11-17 15:35:59
[modified] => 2020-11-30 23:20:46
[menu_order] => 0
[mime_type] => application/pdf
[type] => application
[subtype] => pdf
[icon] => https://www.prb.org/wp-includes/images/media/document.png
)
Download
(0.1 MB)
2020 Census Self-Response Rates Are Lagging in Neighborhoods at Risk of Undercounting Young Children
Self-response rates are lowest in neighborhoods with high concentrations of racial and ethnic minorities in the young child population, which could mean fewer dollars for communities that need funds the most.
View Details
Array
(
[ID] => 1299
[id] => 1299
[title] => prb-response-rate-summary-jun25
[filename] => prb-response-rate-summary-jun25.pdf
[filesize] => 218851
[url] => https://www.prb.org/wp-content/uploads/2020/06/prb-response-rate-summary-jun25.pdf
[link] => https://www.prb.org/resources/2020-census-self-response-rates-are-lagging-in-neighborhoods-at-risk-of-undercounting-young-children/prb-response-rate-summary-jun25/
[alt] =>
[author] => 15
[description] =>
[caption] => 2020 Census Self-Response Rates by Risk of Undercounting Young Children June 18, 2020 to June 25, 2020 analysis by PRB.
[name] => prb-response-rate-summary-jun25
[status] => inherit
[uploaded_to] => 1295
[date] => 2020-10-05 12:59:41
[modified] => 2020-10-05 13:00:58
[menu_order] => 0
[mime_type] => application/pdf
[type] => application
[subtype] => pdf
[icon] => https://www.prb.org/wp-includes/images/media/document.png
)
Download
(0.2 MB)
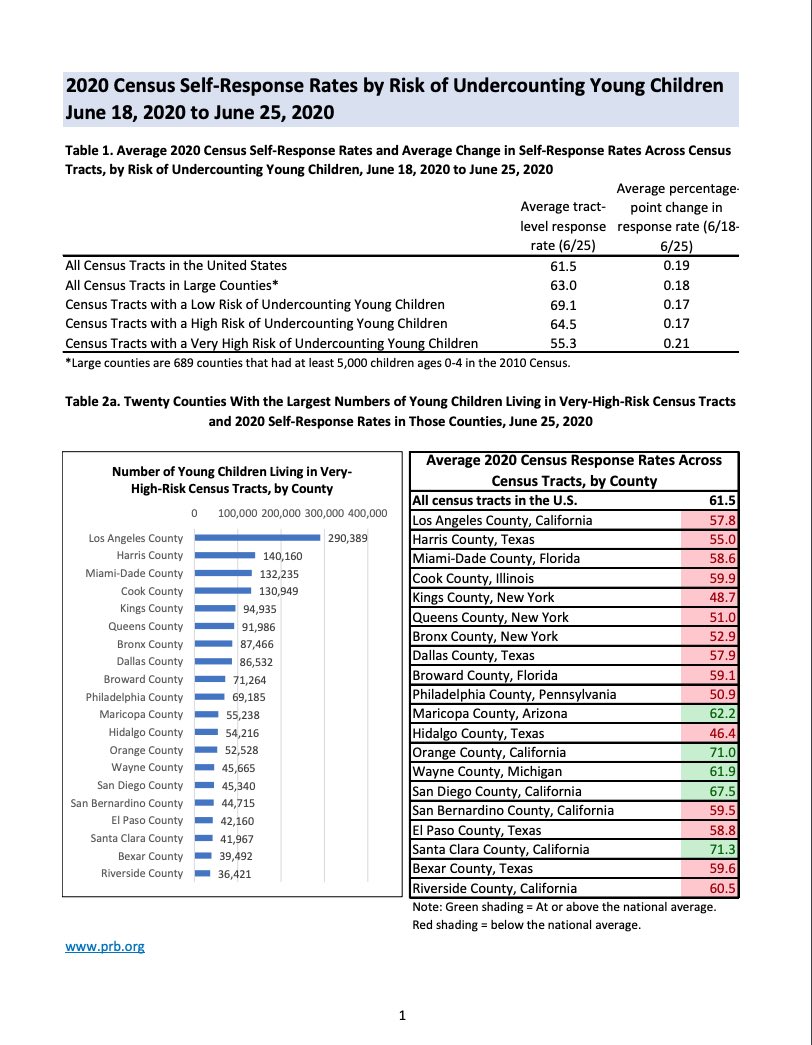
Tables. 2020 Census Self-Response Rates By Risk of Undercounting Young Children, June 18-25, 2020
Self-response rates are lowest in neighborhoods with high concentrations of racial and ethnic minorities in the young child population, which could mean fewer dollars for communities that need funds the most.
View Details
Array
(
[ID] => 1299
[id] => 1299
[title] => prb-response-rate-summary-jun25
[filename] => prb-response-rate-summary-jun25.pdf
[filesize] => 218851
[url] => https://www.prb.org/wp-content/uploads/2020/06/prb-response-rate-summary-jun25.pdf
[link] => https://www.prb.org/resources/2020-census-self-response-rates-are-lagging-in-neighborhoods-at-risk-of-undercounting-young-children/prb-response-rate-summary-jun25/
[alt] =>
[author] => 15
[description] =>
[caption] => 2020 Census Self-Response Rates by Risk of Undercounting Young Children June 18, 2020 to June 25, 2020 analysis by PRB.
[name] => prb-response-rate-summary-jun25
[status] => inherit
[uploaded_to] => 1295
[date] => 2020-10-05 12:59:41
[modified] => 2020-10-05 13:00:58
[menu_order] => 0
[mime_type] => application/pdf
[type] => application
[subtype] => pdf
[icon] => https://www.prb.org/wp-includes/images/media/document.png
)
Download
(0.2 MB)