Alicia VanOrman
Program Director

Household size and composition play an important role in the economic and social well-being of families and individuals. The number and characteristics of household members affect the types of relationships and the pool of economic resources available within households, and they may have a broader impact by increasing the demand for economic and social support services. For example, the growth in single-parent families has increased the need for economic welfare programs, while a rising number of older adults living alone has led to greater demand for home health care workers and other personal assistance services. The decennial census provides the most comprehensive and reliable data on changing household size and composition, especially for less numerous household types such as same-sex married couples.
Average household size has declined over the past century, from 4.6 persons in 1900 to 3.68 persons in 1940 to only 2.58 persons by 2010.1 This decline is due to decreases in the share of households with three or more persons and increases in the share with only one or two persons. In 1940, for example, more than one in four households (27 percent) had at least five persons and less than one in 10 (8 percent) had only one person.2 By 2010, these shares had nearly reversed, with more than one-fourth of all households (27 percent) having only one person and slightly more than one-tenth (11 percent) having five or more persons.3
However, there are signs of a reversal in the decline in average household size. Although the trend away from large households has continued since 2010, average household size actually increased between 2010 and 2017 from 2.58 to 2.65 persons.4 If average household size remains larger than 2.58 in 2020, it will be the first such intercensal increase since the 1900 Census. The increase in average household size since 2010 appears to be driven by growth in the share of households with two persons—from 33 percent to 34 percent—and a decline from 40 percent to 38 percent in the share with three or more persons. Changes in household composition help explain these trends in household size.
The shifts in U.S. household composition over the last five decades have been striking, as the share of family households has declined and the share of nonfamily households has increased. In 1960, 85 percent of all households contained families, but by 2017, this share had dropped to 65 percent (see Table). Conversely, the share of nonfamily households more than doubled from 15 percent to 35 percent during this period. The types of households within the family and nonfamily categories have also shifted, with a consistent decline in the share of married couples with children and a steep and consistent increase in the share of people living alone. Since 1960, the shares of single-parent families and other nonfamily households more than doubled.
| wdt_ID | Household Type | 1960 | 1980 | 2000 | 2010 | 2017 |
|---|---|---|---|---|---|---|
| 1 | Family Households | 85 | 74 | 68 | 66 | 65 |
| 2 | Married Couples w/ children | 44 | 31 | 24 | 20 | 19 |
| 3 | Married Couples w/out children | 31 | 30 | 28 | 28 | 30 |
| 4 | Single Parents w/ children | 4 | 7 | 9 | 10 | 9 |
| 5 | Other Family | 6 | 6 | 7 | 8 | 9 |
| 6 | Nonfamily Households | 15 | 26 | 32 | 34 | 35 |
| 7 | One Person | 13 | 23 | 26 | 27 | 28 |
| 8 | Other Nonfamily | 2 | 4 | 6 | 7 | 7 |
Note: Percentages may not sum to 100 due to rounding.
Sources: James A. Sweet and Larry L. Bumpass, American Families and Households, Table 9.2 (New York: Russell Sage Foundation, 1987); U.S. Census Bureau, 2000 and 2010 decennial censuses; 2017 American Community Survey.
In 1960, married-couple families made up 75 percent of all U.S. households, and 44 percent of these families had children. Single-parent families made up only 4 percent of all households, and other families accounted for 6 percent. By 1980, a significant shift in the composition of family households was underway. Married-couple families made up only 61 percent of all households, and the share with children dropped to 31 percent. The share of single-parent families nearly doubled from 4 percent to 7 percent of all households, while the share of married-couple families without children remained about the same at 30 percent.
Since 1980, the pace of change has slowed but the transformation of family households has continued. By 2017, married-couple families accounted for less than half of all households, and only about one-fifth (19 percent) of households were married couples with children. The share of married-couple families without children also declined slightly to 28 percent between 1980 and 2010, but increased to 30 percent between 2010 and 2017—almost back to the 1960 level of 31 percent. In contrast, the share of single-parent families continued to increase after 1980, rising to 10 percent by 2010, while the share of other families rose from 6 percent to 9 percent of all households by 2017.
In 1960, only 15 percent of all U.S. households were nonfamily households, and 13 percent were one-person households. Over the next 20 years, nonfamily households underwent dramatic shifts: The share of one-person households jumped to 23 percent, and the share of other nonfamily households doubled to 4 percent. The rapid growth in one-person households was largely due to increases in the share of older adults living alone, particularly women. The share of women ages 65 and older who lived alone rose from 23 percent in 1960 to 37 percent in 1980.5
The share of nonfamily households continued to rise after 1980, but at a slower pace. By 2017, more than one-third (35 percent) of all households were nonfamily households, and more than one-fourth (28 percent) were one-person households. The share of other nonfamily households also increased after 1980, reaching 7 percent by 2010. Beginning in the 1980s, the rise in cohabitation contributed to the growth in two-person nonfamily households; unmarried partners made up almost all of the households in this category in 2010. The share of other nonfamily households has not changed since 2010.
Household composition varies among householders in different age groups and reflects the sequence of life-cycle stages that individuals experience as they age—from moving out on their own to marriage and family formation to empty nest to retirement. Changes in the share of householders in different age groups have contributed to shifts in household composition in the United States.
Most young adult householders in the United States live alone or with roommates. Three-fifths (61 percent) of households headed by an adult under age 25 were nonfamily households in 2017, while only 39 percent were family households (see Figure 1). One-third (33 percent) of householders under age 25 lived with unrelated roommates—including cohabiting partners—while an additional 28 percent lived alone. Only a small share (15 percent) headed married-couple families with or without children, but 14 percent of householders under age 25 headed single-parent families in 2017.
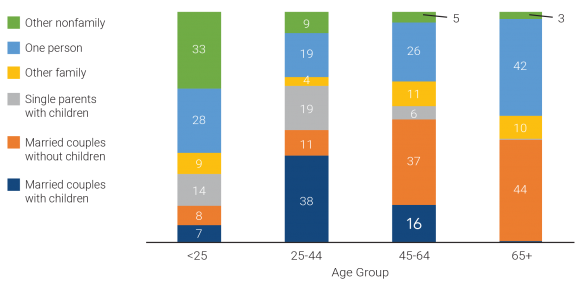
Notes: Percentages may not sum to 100 due to rounding. Among householders ages 65 and older, 0.4 percent headed married-couple households with children and 0.1 percent headed single-parent households with children.
Sources: U.S. Census Bureau, 2017 American Community Survey Public Use Microdata Sample (PUMS).
In contrast, the split between family and nonfamily households is reversed among householders ages 25 to 44—only 28 percent headed nonfamily households and 72 percent headed family households. While only one-fifth of households headed by an adult under age 25 included children, almost three-fifths (56 percent) of householders ages 25 to 44 headed families with children—both married-couple families (38 percent) and single-parent families (19 percent). Only 11 percent headed married-couple families without children. About one-fifth (19 percent) of householders in this age group lived alone in 2017, but less than one in 10 (9 percent) headed 2+-person nonfamily households—down from 33 percent among householders under age 25.
More than a third of householders ages 45 to 64 (37 percent) were empty nesters, heading married-couple households without children. Only about one-fifth (21 percent) of householders ages 45 to 64 headed families with children—16 percent were married-couple families and only 6 percent were single-parent families. However, a relatively high share of householders ages 45 to 64 were heading other family households (11 percent) and one-person households (26 percent).
Eight in 10 householders ages 65 and older were either heading married-couple families without children (44 percent) or living alone (42 percent). Only 10 percent of householders in this oldest age group headed other family households and only 3 percent headed other nonfamily households.
Beginning in the 1960s—and accelerating over the last two decades—changes in marriage, cohabitation, and childbearing have played a key role in transforming household composition in the United States. More recently, population aging and shifts in the age distribution of householders are also contributing to these changes in composition.
Delays in marriage and childbearing and increases in cohabitation among young adults have contributed to the decline in the share of family households—particularly married couples with children—and the steep rise in the share of nonfamily households. The median age at first marriage reached a new high in 2017—29.5 for men and 27.1 for women—and cohabitation rates have continued to increase.6 In 2011-2013, 65 percent of women ages 19 to 44 reported having had a cohabiting relationship, up from 33 percent in 1987.7
Birth rates among women under age 30 have continued to decline since 2010, although the rates for women ages 30 to 34 increased through 2016 before decreasing from 2016 to 2017.8 The share of births to women under age 40 that occurred outside of marriage increased from about 21 percent in 1980-1984 to 43 percent in 2009-2013; about 60 percent of the nonmarital births in 2009-2013 were to cohabiting couples—up from only 28 percent in 1980-1984.9
Between 2000 and 2010, the increase in cohabiting couples with children contributed to growth in the shares of both single-parent families and other nonfamily households due to the ways the Census Bureau classifies such couples by household type. However, between 2010 and 2017, the share of other nonfamily households stayed constant, and the share of single-parent families declined slightly from 10 percent to 9 percent. This decrease may be due to the drop from 18 percent to 14 percent in the share of householders under age 25 who were heading single-parent families. While declining birth rates among young women are partly responsible, this decline could also be related to more young couples with children living with their parents rather than in their own households. This explanation is supported by evidence of an increase in the number of multigenerational households, which rose from 4.4 million in 2010 to 4.6 million in 2017.
As fertility rates have fallen and baby boomers have aged, the distribution of the adult population ages 18 and older in the United States has shifted to older age groups. Between 2010 and 2017, the share of adults ages 45 to 64 declined from 35 percent to 33 percent, while the share ages 65 and older increased from 17 percent to 20 percent. About 22 percent of the adult population is projected to be age 65 or older by 2020.
These shifts in the age distribution of the adult population have been accompanied by changes in the age distribution of householders. Between 2010 and 2017, the shares of householders under age 25, ages 25 to 44, and ages 45 to 64 all declined by 1 or 2 percentage points, while the share of householders ages 65 and older increased by nearly 4 percentage points. This increase in the share of older householders is contributing to growth in the shares of both married-couple households without children and one-person households. These trends are likely to continue as more baby boomers enter older age groups in the coming decades.
Young adults forming new, independent households—alone, with a spouse or partner, or with unrelated roommates—has historically been an important factor in the overall household growth rate. Between 2010 and 2017, the young adult population (ages 18 to 34) increased by 4.2 million, accounting for nearly a quarter of the growth in the adult population (ages 18 and older).10 Yet, the household growth rate slowed to only 3 percent during this period—much lower than the 11 percent growth rate between 2000 and 2010. While the living arrangements of adults ages 35 to 64 have remained stable, recent changes in young adults’ living arrangements help explain the decline.
The share of young adults ages 18 to 34 who have formed an independent household has declined since 2010, while the share living with their parents has increased sharply. In 2010, less than one-third (32 percent) of young adults ages 18 to 34 were living with their parent(s), but this share jumped to 35 percent by 2017. The increase was sharpest among 25- to 29-year-olds, rising from 21 percent in 2010 to 26 percent in 2017 (see Figure 2). The share of 30- to 34-year-olds living with their parent(s) also increased by 4 percentage points across this period. In contrast, the share of young adults living in a married-couple family declined for all age groups between 2010 and 2017, with the largest drop among those ages 25 to 29.
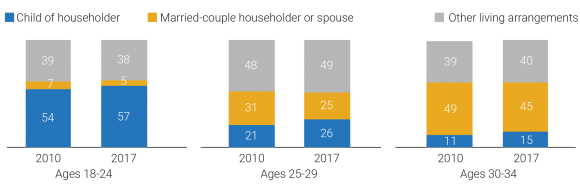
Notes: “Other living arrangements” include householders living alone, with an unmarried partner, with other relatives, or with nonrelatives. Percentages may not sum to 100 due to rounding.
Source: U.S. Census Bureau, 2010 and 2017 American Community Survey PUMS.
The Great Recession and the slow economic recovery, high student debt loads, and high relative housing costs have all likely contributed to the declining shares of young adults forming or maintaining independent households since 2010. Whether these patterns persist into 2020 and beyond is an open question. If the job market and earnings continue to improve, the ability of young adults to form new households may increase. If housing costs continue to rise, however, the resulting economic burden on young adults may counteract any improvements in employment and earnings and dampen household growth rates in the future.
This article is excerpted from Mark Mather et al., “What the 2020 Census Will Tell Us About a Changing America,” Population Bulletin 74, no. 1 (2019).
 ">
">