
World Population Highlights 2007: Overview of World Population
Date
August 16, 2007
Author
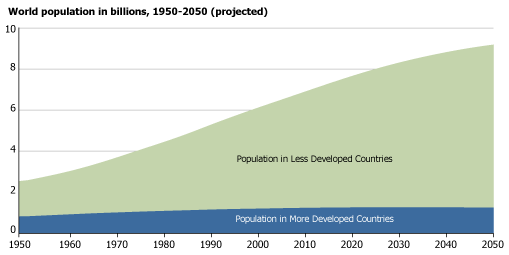
(September 2007) We entered the 20th century with a population of 1.6 billion people. We entered the 21st century with 6.1 billion people. And in 2007, world population is 6.6 billion.
The increase in the size of the human population in the last half-century is unprecedented.
And nearly all of the growth is occurring in the less developed countries. Currently, 80 million people are being added every year in less developed countries, compared with about 1.6 million in more developed countries. While the less developed countries will keep growing, the more developed countries may grow slowly or not at all.
Population change is linked to economic development, education, the environment, the status of women, epidemics and other health threats, and access to family planning information and services. All of these factors interact with every facet of our lives, regardless of where we live.
It is remarkable that, despite many new developments over the past 50 years, one fact looks very much the same: Populations are growing most rapidly where such growth can be afforded the least.
Global Population Growth Is Driven By Developing Countries.
Source: United Nations, World Population Prospects: The 2006 Revision (2007).
Mortality Rates
The phenomenal increase in population in the 20th century resulted from plummeting mortality rates, primarily in less developed countries. Advances in health and medicine that had taken many centuries to achieve in the developed countries spread quickly among developing countries. Even with the high death rates from HIV/AIDS, mortality has declined enough to fuel rapid population growth.
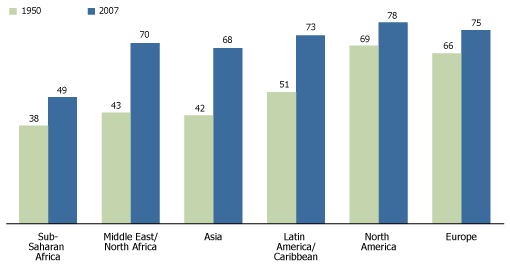
Life expectancy at birth rose rapidly and infant mortality declined sharply, narrowing the gap between rich and poor countries. In just 35 years, Costa Rica nearly closed its life expectancy gap with the world’s wealthiest country—the United States.
Life Expectancy Has Increased Most in Less Developed Regions Since 1950.
Source: United Nations, World Population Prospects: The 2006 Revision (2007); and Carl Haub, 2007 World Population Data Sheet.
The average life expectancy at birth in less developed countries rose from 41 years in 1950 to 66 years in 2007. The Middle East and North Africa region has experienced the largest increase in life expectancy since the late 1950s: from 43 years to 70 years.
Since 1950, the greatest gains in life expectancy at birth occurred among women. In more developed countries, average life expectancy for women rose from 69 years in 1950 to 80 years in 2007, while the average for men rose from 64 years to 73 years.
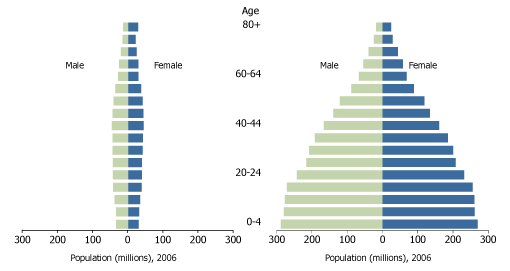
| Developed Countries Have Fewer Young People, but a Higher Shareof Elderly. | Developing Countries Have More Young People, and a Smaller Share of Elderly. |
Source: United Nations, World Population Prospects: The 2006 Revision (2007).
Fertility Rates
A dramatic decline in fertility rates during the 20th century coincided with decreased child mortality, access to family planning, economic development, increases in girls’ and women’s education, and urbanization. Other factors—including stiffer competition for jobs, housing shortages, and government efforts to lower birth rates—also encouraged fertility decline.
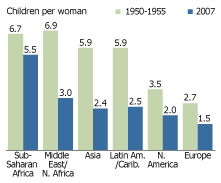
Fertility Rates Have Fallen in Every Major World Regions, But Are Still Highest in Sub-Saharan Africa.
Source: United Nations, World Population Prospects: The 2006 Revision (2007); and Carl Haub, 2007 World Population Data Sheet.
Fertility rates have fallen in every major world region, but in some regions, the rate remains quite high. Worldwide, the average number of children per woman fell from 5.0 around 1950 to 2.7 in 2007. Sub-Saharan Africa has the highest average at 5.5, falling from a level of 6.7 around 1950.
Couples were able to reduce family size by adopting methods of family planning. Worldwide, use of contraception rose from less than 10 percent of married women of childbearing age in the 1960s to 62 percent in 2007. Again, regional variations provide stark contrasts. In Africa, 28 percent of married women use contraception; in Latin America, the share is 71 percent; North America, 73 percent; Europe, 67 percent; and Asia, 66 percent.
Women’s Education and Lower Birth Rates
A large body of research over the years has linked education for women and girls with lower birth rates. Indeed, recent data from many less developed countries have shown that women with at least a secondary-level education eventually give birth to one-third to one-half as many children as women with no formal education. In some of these countries, the fertility of these better-educated women approaches replacement level (2.1 children per woman). A woman in Honduras with no education has, on average 4.9 children, but a Honduran woman with secondary or higher education has 2.2 children. An Ethiopian woman with no education has 6.1 children on average, but an Ethiopian woman with secondary or higher education has 2.0 children. Better-educated women generally are able to exercise more control over their reproductive lives, including delaying marriage and childbearing.
Among Women in Developing Countries, More Education Often Leads to Lower Fertility.
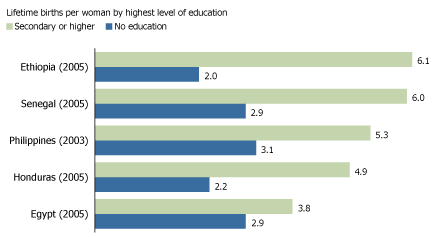
Source: ORC Macro, MEASURE DHS STATcompiler (www.measuredhs.com, accessed June 15, 2007).
Demographic Divide
Attention has focused recently on the “demographic divide,” the vast gulf in birth and death rates among countries. On one side are mostly poor countries with relatively high birth rates and low life expectancies. On the other side are mostly wealthy countries with birth rates so low that population decline and rapid aging are likely.
This is not a simple divide that perpetuates the status quo among the “have” and “have-not” countries. Rather, it involves a set of demographic forces that will affect the economic, social, and political circumstances in these countries, and consequently, their place on the world stage. Demographic trends are just one of the factors determining their future, but they are a crucial factor.
The demographic, health, and economic contrasts among the United States, Germany, and Ethiopia illustrate this diversity and the different challenges faced by rich and poor countries.
| U.S. | Germany | Ethiopia | |
|---|---|---|---|
| Population mid-2007 | 302.2 million | 82.3 million | 77.1 million |
| Population 2025 (projected) | 349.4 million | 79.6 million | 108.7 million |
| Total fertility rate (lifetime births per woman) | 2.1 | 1.3 | 5.4 |
| Population below age 15 (%) | 20% | 14% | 43% |
| Population ages 65+ (%) | 12% | 19% | 3% |
| Life expectancy at birth | 78 years | 79 years | 49 years |
| Infant deaths per 1,000 births | 6.5 | 3.8 | 77.0 |
| Adults with HIV/AIDS (2005) (%) | 0.6% | 0.1% | 1.4% |
| Children under 5 underweight (%) | 1% | — | 35% |
Source: C. Haub, 2007 World Population Data Sheet .
Case In Point.
The United States is the only developed country experiencing significant population growth, for two main reasons: The United States has a higher fertility rate than other developed countries, and the United States has more net migration than other developed countries.
If current fertility rates continue, American women will have 2.0 children, on average, during their childbearing years, compared with 1.5 in Europe, 1.3 in Japan, and 1.5 in Canada.
When looking at U.S. population growth by race and ethnicity, quite different stories emerge: For the non-Hispanic white population, the ratio of births to deaths is nearly equal: almost 1:1. Demographers would say that this represents no natural increase in population size. Hispanics, on the other hand, have 8 births for every death, leading to a significantly larger growth rate than that for non-Hispanic whites.
Several factors account for higher fertility in the United States, compared with other developed countries. It is easier for U.S. women to combine education, jobs, housework, and childrearing. American women earn higher salaries relative to men, and American men tend to accept more childrearing and homemaking responsibilities than European men.
The United States receives about 20 percent of the world’s international migrants, but the United States accounts for just 5 percent of the world’s population. Foreign-born couples tend to have more children than U.S.-born couples. Foreign-born residents are in their prime childbearing years, and immigrants often come from countries where larger families are more common.
Sources
Carl Haub, 2007 World Population Data Sheet (Washington, DC: Population Reference Bureau, 2007).
Mary M. Kent and Carl Haub, “Global Demographic Divide,” Population Bulletin 60, no. 4 (2005).
Mary M. Kent and Sandra Yin, “Controlling Infectious Diseases,” Population Bulletin 61, no. 2 (2006).
Joseph A. McFalls Jr., “Population: A Lively Introduction,” Population Bulletin 62, no. 1 (2007).
United Nations, World Population Prospects: The 2006 Revision (New York: United Nations, 2007).
