Puerto Rico Lost Nearly 12% of Its Population in a Decade
Where Did Everyone Go?
Initial results from the U.S. Census Bureau’s 2020 Census show Puerto Rico’s population fell 11.8% between 2010 and 2020.1Out-migration from the commonwealth was a driving factor behind this drop. Where did people go?
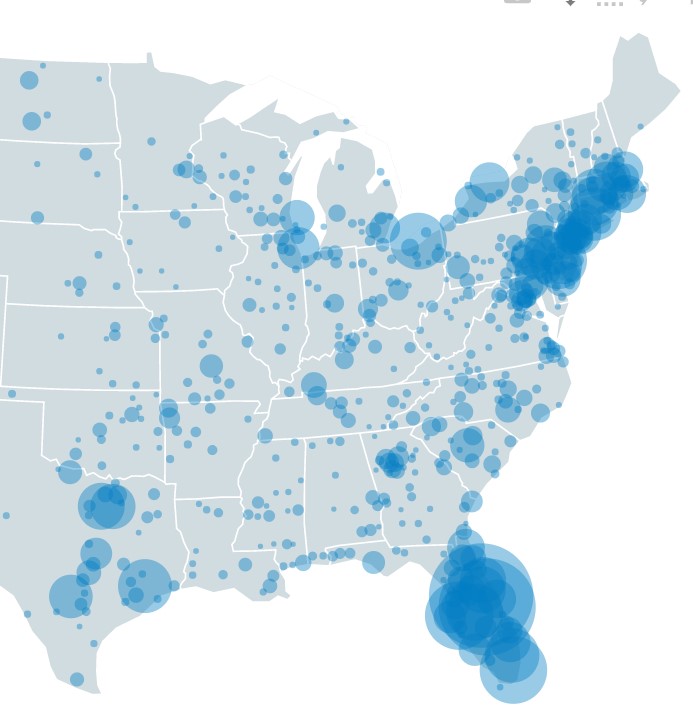
Data from the Census Bureau’s American Community Survey (ACS) can be used to track the average number of people who migrated from Puerto Rico to other U.S. destinations each year from 2014-2018.2 The map below shows where they moved:
Out-Migrants From Puerto Rico by County
(Annual Averages, 2014-2018)
Map Note: Migration flow is measured by asking survey respondents if they lived somewhere else one year ago. Estimates are subject to both sampling and non-sampling error.
Map Source: PRB analysis of the U.S. Census Bureau’s 2014-2018 American Community Survey 5-year estimates (Accessed June 2021).3
On average, nearly 100,000 people left the island for other U.S. destinations each year from 2014 to 2018, according to the ACS data. Five counties account for 19% of this out-migration:
- Orange County, Florida (6,274 people per year)
- Osceola County, Florida (5,429 people per year)
- Hillsborough County, Florida (2,701 people per year)
- Miami-Dade County, Florida (2,619 people per year)
- Philadelphia County, Pennsylvania (1,878 people per year)
References
- Beth Jarosz, “How Did State Populations Change 2010-2020?” Population Reference Bureau, https://www.prb.org/resources/how-did-state-populations-change-2010-2020/.
- U.S. Census Bureau, “County-to-County Migration Flows: 2014-2018 ACS,” Revised September 3, 2020, https://www.census.gov/data/tables/2018/demo/geographic-mobility/county-to-county-migration-2014-2018.html.
- U.S. Census Bureau, “County-to-County Migration Flows.”
Related Posts
Understanding and Comparing Population Projections in Sub-Saharan Africa
The release of a new set of population projections by the Institute for Health Metrics and Evaluation (IHME) in July 2020 was greeted with extensive coverage in the media and stimulated fresh debate among demographers about calculation and communication of projections.