
Norway and South Korea Owned the Demographic Podium at the 2010 Winter Olympics
(April 2010) At the recent Vancouver Winter Olympics, much was written about Canada’s “Own the Podium” initiative to lead the medal standings. That didn’t quite happen, as the host country’s neighbor, the United States, won the largest number of medals with 37, including nine gold, setting a Winter Games record. Yet with 14 gold medals (out of 26 overall), Canada set a record of its own—the most golds ever won by a country in a single Winter Olympics. Other countries that did well in the medal count were perennial winter-sports powers: Germany (30 medals, 10 gold) and Norway (23 medals, nine gold). All told, a record-tying 26 of the 82 participating nations earned at least one medal in Vancouver.
But a demographic examination of the medal standings shows that neither the Americans nor the Canadians owned the podium. PRB’s Crude Medal Rate (CMR), like the crude birth and death rate, considers a country’s population size. Calculating this measure involves dividing the total number of Olympic medals a country won in Vancouver by its total population, then multiplying the result by 1 million. As was the case in the previous three Winter Olympics, Norway was the big winner under this measure. The 23 medals the Scandinavian nation of 4.8 million residents won in 2010 translate into a rate of 4.8 medals per million (see Table 1). This was more than twice the CMR of 1.9 for second-place Austria, which likewise benefited both from its high overall medal total (16, including four gold) and its relatively small population of 8.4 million.
Table 1
Crude Medal Rate, 2010 Winter Olympics
(Medals per 1 million population, countries with at least one medal in the 2010 Vancouver Olympics)
| Country |
Crude Medal Rate |
Number of Medals | 2009 Population (millions) |
|---|---|---|---|
| Norway | 4.8 | 23 | 4.8 |
| Austria | 1.9 | 16 | 8.4 |
| Slovenia | 1.5 | 3 | 2.0 |
| Sweden | 1.2 | 11 | 9.3 |
| Switzerland | 1.2 | 9 | 7.8 |
Sources: Vancouver Olympic Committee, official website of Vancouver 2010 Winter Olympics, accessed at www.vancouver2010.com, on March 3, 2010; and PRB, 2009 World Population Data Sheet.
Indeed, countries with small populations benefit under the CMR. Slovenia, for example, won only three medals in Vancouver (two silvers in alpine skiing and a bronze in cross-country skiing), but its population of 2 million helped produce a CMR of 1.5 medals per million, good enough for third place on this measure. By contrast, the larger populations of both Canada (33.7 million) and especially the United States (306.8 million) yield CMRs of 0.8 and 0.1, respectively, putting both countries well behind Norway.
The two North American nations fare better under a second demographic measure, the General Olympic Medal Rate (GOMR). Conceptually similar to the general fertility rate (which measures the number of births per 1,000 women of childbearing age), this measure accounts for the actual number of athletes a nation sent to Vancouver—that is, the actual “population” eligible to win a medal. The 214 athletes the United States sent to the Olympics produced a GOMR of 17.3 medals for every 100 athletes—good enough to rank it sixth on this measure. The host Canadians, who had 205 participants in Vancouver, placed eighth with a GOMR of 12.7. CMR leader Norway ranked near the top on this measure as well; its GOMR of 23 medals per 100 participants put it in third place (see Table 2). But the podium “owner” on this measure was South Korea. The 46 South Korean athletes who competed in Vancouver won 14 medals (including six gold), producing a GOMR of 30.4 per 100 athletes. The Netherlands, who won eight medals despite sending just 34 athletes to Vancouver, ranked second at 23.5.
Table 2
General Olympic Medal Rate, 2010 Winter Olympics
(Medals per 100 athletes, countries with at least one medal in the 2010 Vancouver Olympics)
| General Olympic Medal Rate | Number of Medals | Number of Participating Athletes | |
|---|---|---|---|
| South Korea | 30.4 | 14 | 46 |
| Netherlands | 23.5 | 8 | 34 |
| Norway | 23.0 | 16 | 79 |
| Austria | 20.3 | 16 | 79 |
| Germany | 19.7 | 30 | 152 |
Source: Vancouver Olympic Committee, official website of Vancouver 2010 Winter Olympics, accessed at www.vancouver2010.com, on March 3, 2010.
Of course, neither the CMR nor the GOMR accounts for all the complexities of the games. For example, the Olympics contain a mixture of individual and team events, and not all nations competed in every sport. And some athletes such as skiers and speed skaters competed—and won medals—in multiple events. Finally, regardless of the measure used, any talk about which nation really “owned the podium” obscures the fact that the athletes, not the countries they represent, are the ultimate Olympic champions.
Kelvin Pollard is a senior demographer at the Population Reference Bureau.

Why Do Canadians Outlive Americans?
This article is adapted with permission from Barbara Boyle Torrey and Carl Haub’s article “A Comparison of U.S. and Canadian Mortality in 1998,” Population and Development Review 30, no. 3 (2004).
(November 2004) Over 250,000 Americans who died in 1998—roughly one of every ten U.S. deaths that year—would have survived had they been Canadian, according to a comparison of patterns of death between the two countries.
And such “excess deaths” in the United States have been growing in number for over 40 years. In 1955, Americans and Canadians had almost the same life expectancy at birth. In 1998, however, life expectancy at birth was 76.7 years in the United States and 78.8 years in its northern neighbor—a notable divergence at a time when life expectancy among high-income countries was tending to converge.1
Why do Americans die an average of 2.1 years earlier than Canadians? Using basic mortality data for the two countries for 1998, we find that obesity appears to be a major suspect in the disparities.
Canada and the United States: A Natural Comparison
Canada and the United States resemble each other more than they do any other country. They share a language, a continent, and a border. They are also both younger than their European allies, have resource-based economies, and are two of the wealthiest countries in the world. These similarities create a natural opportunity to study why the two countries differ so much in both life expectancy and death rates.
We calculate the numbers of deaths by age and sex that would have occurred in the United States on the assumption that Canadian mortality rates prevailed in the 1998 U.S. population.2 We use seven broad categories of cause of death (neoplasm, suicide, diabetes, homicide, injury, respiratory diseases, and circulatory diseases) developed by the International Classification of Diseases (ICD). In 1998, these causes accounted for 84 percent of all U.S. deaths.
Figure 1
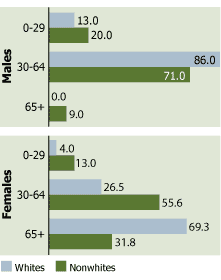
Percent Distribution of Excess U.S. Deaths Relative to Canada by Sex and Race for Three Age Groups, 1998
Source: U.S. Census Bureau, unpublished file NESTV 98; National Center for Health Statistics, “Death Rates for 282 Selected Causes by 5-Year Age Groups, Race and Sex: United States 1979–1998”; and Statistics Canada, Mortality—1998 Shelf Tables.
Figure 2
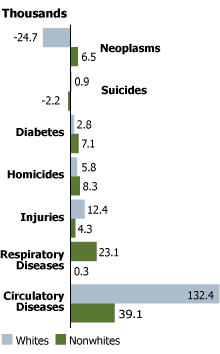
Excess U.S. Deaths Relative to Canada by Cause of Death: Both Sexes, Whites, and Nonwhites, 1998
Source: U.S. Census Bureau, unpublished file NESTV 98; National Center for Health Statistics, “Death Rates for 282 Selected Causes by 5-Year Age Groups, Race and Sex: United States 1979–1998”; and Statistics Canada, Mortality—1998 Shelf Tables.
By our calculations, the United States in 1998 had 253,237 excess deaths as compared with Canada—11 percent of all deaths in the U.S. that year.3 In absolute terms, excess American deaths relative to Canadian deaths were most prominent among middle-aged men and among older women (see Figure 1).
Since Canadian mortality rates are not disaggregated by ethnic or racial groups, we also compared death rates for the total Canadian population with American white and nonwhite death rates. In proportionate terms, 35 percent of all excess U.S. deaths occurred to nonwhites, a percentage twice as high as the share of nonwhites in the U.S. population in 1998. But even among the more homogenous white American population alone, there were 164,756 excess deaths in 1998 as compared with Canadians.
Three Major Suspects: Smoking, Hypertension, and Obesity
We found excess American deaths relative to Canadian deaths in five of the seven ICD categories (see Figure 2). One of these categories—circulatory diseases—constitutes the most important cause of death in both Canada and the United States and accounts for 68 percent of all American excess deaths.
Circulatory diseases—which include 34 separate conditions, including hypertensive diseases and congestive heart failure—were the cause of 95 percent of the excess deaths of all U.S. women over age 65 and also were the largest single category of deaths among men and women under age 65.
Since circulatory diseases are such a large proportion of excess deaths in the United States, we focused on the major behavioral risk factors for many of these diseases: smoking, hypertension, and obesity.4
A number of surveys over the years have measured the prevalence of smoking in Canada and the United States.5 But while the differences in smoking rates between the two countries are today not very great, Canada has historically had higher levels of smoking—suggesting that this behavior is not an important factor in the excess U.S. deaths from circulatory and other diseases.
As for hypertension, a recent study found similar prevalence in both countries—21.1 percent of all Canadians age 18 and older have the disease, versus 20.1 percent in the United States.6 But the study also found that a higher percentage of Canadians with hypertension go untreated for the condition, and that more Canadians (43 percent) are unaware of their hypertension than their U.S. counterparts (at 30 percent). Therefore, hypertension also cannot account for the excess American deaths.
And the percentage of “overweight” individuals—defined as having a Body Mass Index (BMI) over 25—has increased in both countries since 1970s. The most recent comparative data suggest that the prevalence of Canadian males with BMIs between 25 and 29.9 (at 44 percent) was actually higher than that of U.S. males (at 40 percent), and that the percentage of Canadian women in this BMI range was slightly lower than that of American women.
The Dead Weight of Obesity?
But comparisons of obesity rates between the two countries (with obesity defined as a BMI over 30) tell a sharply different story. In 1998, American men were twice as obese as Canadian men (28 percent of the total U.S. male population versus 13 percent for Canada). American women were three times as obese as Canadian women (34 percent versus 11 percent). Recent estimates of remaining life expectancy for people who are overweight and obese suggest that the consequences of these conditions are substantial.
And a 40-year follow-up of the famous community health study of Framingham, Mass. reported that life expectancy at age 40 there was reduced because of excess weight.7 The findings suggest that obesity can account for much of the 1.5-year difference in life expectancy between Canadian and American women at age 40 and more than half of the 1.3-year difference between Canadian and American men.
While a number of other factors—such as disparities in health care coverage—may be important in explaining the differences in death rates between Canadians and Americans, this analysis provides an important perspective on our own mortality. The comparisons of data on mortality and risk factors in Canada and the United States reinforce the validity of widely expressed concerns over obesity.
Barbara Boyle Torrey is a visiting scholar at PRB. Carl Haub is senior demographer and holds the Conrad Taeuber Chair of Public Information at PRB.
References
- Kevin M. White, “Longevity Advances in High-Income Countries, 1955-96,” Population and Development Review 28: 59-76.
- Deaths in Canada and the United States are recorded, respectively, by Statistics Canada and by the US National Center for Health Statistics (NCHS) from provincial and state vital statistics registers.
- Using an age-sex distribution other than that of the 1998 U.S. population (but broadly similar to it—for example, the age-sex distribution of the Canadian population) as the standard would change these precise numerical results, but not their general magnitude.
- J.M. McGinnis and W. H. Foege, “Actual Causes of Death in the United States,” JAMA 270, no. 18 (1993): 2207-2212.
- See Jason Gilmore, “Body Mass Index and Health,” Health Reports, Statistics Canada 11 (1999): 31-43; and “U.S. National Health Interview Survey” as reported in Health United States 2002 (Atlanta: Center for Disease Control and Prevention): 195-197.
- M.R. Joffres et al., “Distribution of Blood Pressure and Hypertension in Canada and the United States,” American Journal of Hypertension 14 (2001): 1099-1105.
- Anna Peeters et al., “Obesity in Adulthood and Its Consequences for Life Expectancy: A Life-Table Analysis,” Annals of Internal Medicine 138 (2003): 24-32.

Diverging Mortality and Fertility Trends: Canada and the United States
Product: Population Bulletin, vol. 57, no. 4
Author: PRB
Date: January 13, 2003
(January 2003) Canada and the United States share a long land border and similar popular cultures. They are major trading partners and have fought in many of the same military conflicts overseas. Both countries are leading immigration countries, with the foreign-born population making up increasing percentages of their total populations.
With so much in common, it is somewhat surprising that fertility and mortality trends have recently followed different paths in the two countries. Canada’s demographic trends are becoming more like those in Europe than the United States. This divergence between the United States and its closest industrialized neighbor highlights how different the United States is from other more developed countries.
The Mortality Gap
Fifty years ago, Americans could expect to live longer than Canadians. The United States has made major improvements in health and average life expectancy since then, but Canada has made even greater strides. The U.S. advantage began to disappear in the 1950s and 1960s, and by 2001, a newborn Canadian infant could expect to outlive a newborn American by two years, and an American white infant by 1.5 years.
The reasons for this mortality gap are not easily explained. The major causes of death are the same in both countries: cancer and circulatory diseases, such as heart diseases and strokes. Both countries have similar cancer mortality rates, but heart disease and stroke are more deadly in the United States: Two-thirds of the excess deaths in Americans, both men and women, are caused by heart and other circulatory diseases after age 30.1
Canada’s Fertility Rate Resembles Europe
The differences between Canadian and U.S. fertility rates are even larger than the differences in life expectancy. In 2000, Canada’s total fertility rate was just 1.5 children per woman, compared with the United States’ rate of 2.1. Canada’s fertility is more in line with that of Europe, Japan, and Australia than that of the United States.
This gap in fertility rates between Canada and the United States is surprising because Canada has historically had higher rates. In 1945, Canadian women had a higher TFR than American women (3.0 and 2.5, respectively). Each country had a major baby boom after World War II, and Canada’s boom was bigger. In both countries, fertility rates peaked around 1959: Canada at 3.9 and the United States at 3.7. The TFRs in both countries declined to about 1.8 in 1977, but the Canadian rate never recovered from the baby bust, while the U.S. rate edged back up to 2.1.
Why is Canadian fertility lower than U.S. fertility? Minority populations in the United States — especially Hispanic immigrants — have higher fertility rates than many of the minority groups in Canada. However, the higher fertility rates of blacks and Hispanics by itself would explain only about 40 percent of the differences in total fertility rates.2
Both countries experienced similar social changes in the second half of the 20th century. Levels of education increased, as did women’s labor force participation. Marriage rates declined and the age of first marriage increased. Common-law unions became widespread in both countries, although they were almost twice as prevalent in Canada as the United States.3 Yet there appear to be subtle cultural differences between the two countries that make Canada look demographically much more like its European peers in both life expectancy and fertility. These comparisons suggest that the United States will have a unique demographic future, unlike its northern neighbor, who resembles the rest of the more developed world.
References
- Authors’ calculations based on published vital statistics for the United States and Canada.
- Alain Belanger and Genevieve Ouellet, “A Comparative Study of Recent Trends in Canadian and American Fertility, 1980-1999,” in Report on the Demographic Situation in Canada 2001, ed. Statistics Canada (Ottawa: Statistics Canada, 2002): 112.
- In 2001, 14 percent of Canadian couples were in common-law unions. In comparison, 8 percent of U.S. couples were in common-law unions in 2000. Statistics Canada, 2001 Canadian Census (www12.statcan.
ca/english/census01/release/index.cfm, accessed Nov. 12, 2002); and U.S. Census Bureau, personal communication, November 2002.
Barbara Boyle Torrey is an independent writer based in Washington, D.C. She is former director of the Commission on Behavioral and Social Sciences, National Research Council, National Academy of Sciences. Carl Haub holds the Conrad Taeuber Chair of Public Information at PRB. Excerpted from PRB’s Population Bulletin “What Drives U.S. Population Growth?” (PDF: 559KB).
Resources
View All
Poverty in the United States and Other Western Countries
(May 2002) It is difficult to compare poverty levels in different countries. Countries not only have different currencies, they have different family income levels, consumption patterns, prices for goods and services (which affect purchasing power), spending patterns, and family and demographic characteristics. Different countries also adopt very different criteria for setting absolute income thresholds that define poverty. As a result, most cross-national studies use relative measures of poverty as a basis for comparison.
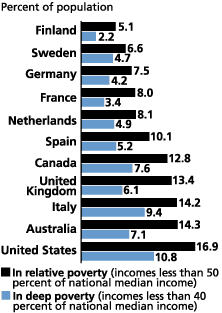
A recent study by Timothy Smeeding, Lee Rainwater, and Gary Burtless showed striking differences in western countries’ rates of relative poverty, which they defined as 50 percent of the median adjusted disposable personal income (ADIN) for persons (adjusted for family size). They also measured deep poverty, defined as 40 percent of the median ADIN. Using data from the Luxembourg Income Study, the researchers showed that the United States has the highest relative poverty (and deep poverty) rates among those countries observed (see figure).
Relative Poverty in Selected Industrialized Countries, 1990s
Source: Luxemborg Income Study, “Key Figures: Relative Poverty Rates”
(www.lisproject.org/keyfigures/povertytable.htm, accessed April 2, 2002).
Reference
Timothy Smeeding et al., “United States Poverty in a Cross-National Context,” Focus 21, no. 3 (2001): 50-54.

Quebec's Alternative to Pronatalism
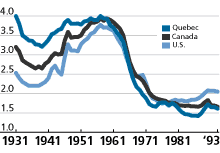
(December 2001) For centuries, fertility was seen as central to the survival of Quebec’s distinct French-Canadian culture. The province’s political elite and its clergy successfully promoted relatively high fertility rates to overcome subordination to English-Canada. As the figure below shows, however, between 1961 and 1971, Quebec’s fertility rate plummeted. Since then, two kinds of government intervention to make parenthood more attractive have been tried, but experience has shown that pronatalism is no longer the means to ensure a (distinctive) francophone Quebec.
Total Fertility Rates for Quebec, Canada, and the United States, 1931-1993
Sources: Statistics Canada and the U.S. National Center for Health Statistics.
In a population engineering effort unprecedented in North America, the Quebec government in 1988 implemented three programs to boost fertility: allowances for newborns that, after amendments, paid women C$500 for a first birth, C$1,000 for a second, and C$8,000 for a third and each subsequent birth (one Canadian dollar equals 63 U.S. cents); a family allowance for all children under 18 years; and an additional allowance for children under age 6.
Moreover, with the birth of a third or subsequent child, parents received 27 weeks of paid leave, plus 15 weeks of federal maternity benefits. Families with two or more children under age 18 qualified for a C$7,000 interest-free loan to help purchase a first home. Overall, Quebec families received almost C$4 billion annually in direct and income tax assistance from the provincial and federal governments.
Reactions to these forms of direct financial assistance varied. Noninterventionists argued that fertility decisions were individual, not governmental, responsibilities. Some even charged that the pronatalists had invented a fertility crisis to advance the nationalist agenda. One scathing critique by feminist professor Heather Maroney of the University of Carleton charged that Quebec’s pronatal policies marginalized women, reducing them to objects of demographic policy.
Social interventionists supported government action, not through pronatalist intervention, but through social policies to improve female equity and assist families. Of particular importance were policies to decrease tensions between employment and family responsibilities.
These critiques coincided with a growing awareness that Quebec’s incentive policies were not producing the expected birth increases. Although there was an initial increase in the late 1980s in the total fertility rate from 1.49 children per woman in 1988 to 1.72 in 1990, after 1990 total births decreased, and families with three or more children remained uncommon. Overall, policies favoring third and subsequent children were viewed increasingly as contrary to the needs of most families.
In 1997 Quebec switched its approach to strengthening families. It created the Ministry of Family and Children’s Services and gave it a budget of C$500 million. The Ministry was to:
- Establish a standard child allowance program for low-income families, wherein the amount of allowances would depend on the number of dependent children under age 18, on family type (single-parent, two-parent), and on income (a threshold of C$15,332 for single-parent families; C$21,825 for two-parent families).
- Offer a maternity/parental leave plan that would pay more during and after pregnancy.
- Provide a network of government-regulated, highly subsidized (C$5 per day) day-care facilities offering a quality educational program to children from birth to kindergarten age. (Presently, Quebec is the only province to have universal subsidized day care. Ten innovative pilot projects have also recently been launched that offer evening and 24-hour day-care service, seven days a week.)
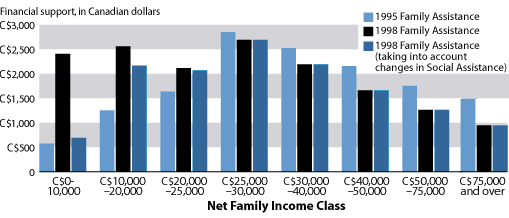
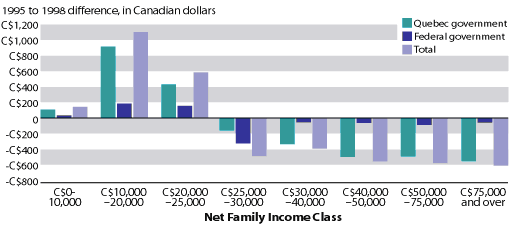
But even the new family assistance policies have shortcomings. A recent study indicates that 72 percent of Quebec families are worse off under the new family assistance program than under the earlier pronatal one, despite government promises that 95 percent of families would benefit from the new policies.
While the previous pronatal program provided universal assistance, the new initiatives provide targeted assistance aimed almost exclusively at low-income working families (those with a net income between C$10,000 and C$25,000). Families with a net income of less than C$10,000 benefit only marginally, since their increase in family assistance is offset by a reduction of a similar amount in social assistance. (Canada offers both family assistance, supporting the needs of children and adults within families, and social assistance, which spans health, employment, and general social welfare.) Families with a net income of C$25,000 or higher now receive less family assistance; the money once spent on them is now allocated to low-income working families. And due to budget constraints, the parental leave plan has yet to be realized.
In terms of the universal C$5-a-day day-care program, there are not enough regulated day-care spaces to keep up with demand. Consequently, Quebec day-care centers now have long waiting lists and one of the highest ratios of children to day-care workers in Canada.
Although the new policies promote work, they inadvertently limit women’s choices by offering more assistance to families with employed mothers than to families with stay-at-home mothers (through universal C$5-a-day day care and through cutbacks in social assistance).
Clearly, promoting higher fertility has not been effective for the past half-century. Like many other modern societies, Quebec faces a low birth rate and an aging population. The Quebec government cannot convince women to bear more children than they desire. The Quebec government has found and will continue to find other means to protect the distinctiveness of its society, including reassessing family assistance programs.
Catherine Krull is a professor of sociology at Queens University in Kingston, Ontario.
WebExtra
Author’s References
Baker, Maureen. 1994. “Family and Population Policy in Québec: Implications for Women.” Canadian Journal of Women and the Law/ Revue Femmes et Droit 7:116-132.
Baker, Maureen. 1990. “Family Policy in Quebec.” Background Paper. Ottawa: Library of Parliament, Research Branch.
Baril, Robert, Pierre Lefebvre, and Philip Merrigan. 2000. “Quebec Family Policy: Impact and Options.” IRPP 6(1): 4-52.
Caldwell, Gary and Daniel Fournier. 1987. “The Quebec Question: A Matter of Population.” The Canadian Journal of Sociology 12:16-41.
Clark, Campbell. “Family Ministry Draws Fire.” The Montreal Gazette, May 14, 1997: A9.
Council on French Life in America. 1971. “The Fertility Crises in Quebec.” Translated by Katya von Knorring. In Carl F. Grindstaff, Craig L. Boydell and Paul C. Whitehead (eds.) Population Issues in Canada.
Hamilton, Roberta. 1995. “Pro-natalism, Feminism, and Nationalism.” In Francois-Pierre Gingras (ed.) Gender and Politics in Contemporary Canada, Toronto: Oxford University Press, 135-152.
Henripin, Jacques and Evelyne Lapierre-Adamcyk. 1974. La fin de la revanche des berceaux. Montreal: PUM.
Henripin, Jacques. 1971. “De la fécondité naturelle à le prévention des naissances: l’évolution démographique au Canada francais depuis le XVIII siècle,” in M. Rioux and Y. Martin (eds.) La Société Canadienne francaise. Montreal: Hurtubise, pp. 215-226.
King, Leslie. 1998. “France Needs Children: Pronatalism, Nationalism and Women’s Equity.” The Sociological Quarterly 39(1): 33-52.
Lavigne, Marie. 1986. “Feminist Reflections on the Fertility of Women in Québec.” In Roberta Hamilton and Michèle Barrett (Eds.) The Politics of Diversity: Feminism, Marxism and Nationalism. London: Verso: 303-321.
Maroney, Heather J. 1992. “Who Has the Baby? Nationalism, Pronatalism and the Construction of a ‘Demographic Crisis’ in Quebec, 1960-1988.” Studies in Political Economy 39:7-36.
Mathews, G. 1984. Le choc démographique: le déclin du Québec est-il inévitable. Montréal: Boréal Express.
Regie des rentes du Québec, 1994. Les allocations d’aide aux familles: Statistiques 1994 [Allocations of assistance to families: 1994 statistics]. Quebec Pension Board.
Saint-Pierre, Marie Hélène et Renée B.-Dandurand. 2000. Axes et Enjeux de la Politique Familiale Québécoise: Présentation d’Une Recension Informatisée des Écrits. Montréal, Québec: INRS – Culture et Société.
Statistics Canada. 1993. Selected Birth and Fertility Statistics, Canada, 1921-1990. Ottawa: Minister of Industry, Trade and Technology (Cat. No. 82-553).
Wennemo, Irene. 1992. “The Development of Family Policy: A Comparison of Family Benefits and Tax Reductions for Families in 18 OECD Countries.” Acta Sociologica 35: 201-217.
Figure 1
Financial Impact of Provincial Family Assistance Reforms in Quebec, by Net Family Income Class
Source: R. Baril, P. Lefebvre, and P. Merrigan, “Quebec Family Policy: Impact and Options” (2000) IRPP 6(1): 16.
Figure 2
1998 to 1995 Monetary Difference in Provincial, Federal, and Total Financial Assistance Progams in Quebec, by Net Family Income Class
Source: R. Baril, P. Lefebvre, and P. Merrigan, “Quebec Family Policy: Impact and Options” (2000) IRPP.

Human Papillomavirus in Canada
(May 2001) As in the United States, HPV is not a sexually transmitted infection (STI) that the Canadian government routinely monitors. Available statistics come from smaller studies of different sub-groups in the population. For Canadian women, the estimated prevalence rate for HPV ranges from 20 percent to 33 percent for both the non-cancer causing and cancer-causing types of the virus, and between 11 percent and 25 percent for the cancer causing types alone, according to Health Canada, a federal government agency charged with maintaining and improving the health of Canadians. Some high-risk groups have a higher HPV prevalence rate. For instance, one recent study in Ontario found that women between the ages of 20 and 24 had the highest HPV prevalence rate for cancer-causing types, at 24 percent, and this decreased with age. Another study found that a group of HIV-infected women had a 49 percent cancer-causing HPV prevalence rate.
There is a special need in Canada to pay more attention to HPV and the cervical cancer status of Aboriginal women. For instance, among Indian women in the province of Saskatchewan, cervical cancer represents the most common type of cancer; levels are 10 times higher than those found among women in the province as a whole. In addition, one 1994 study found that among Canadian Inuit women, cervical cancer is the second most common form of cancer. Another recently published study concluded that Aboriginal women in Manitoba, Canada had an age-standardized incidence of invasive cervical cancer that was 3.6 times higher than that of non-Aboriginal women for the years 1984-1997, reinforcing the need for a more inclusive screening campaign.
In order to address this problem, Canada has adopted a nationwide initiative to increase Pap screening among all populations throughout the country.
References
Health Canada, “What Everyone Should Know About Human Papillomavirus (HPV): Questions and Answers,” STD EPI Update (September 2000).
Alice Lytwyn and John Sellors, “Sexually Transmitted Human Papillomaviruses: Current Concepts and Control Issues,” Canadian Journal of Human Sexuality 6, no. 2 (1997).
T. Kue Young et al., “Monitoring Disease Burden and Preventive Behavior with Data Linkage: Cervical Cancer Among Aboriginal People in Manitoba, Canada,” American Journal of Public Health 90, no. 9 (September 2000): 1466–68.
John W. Sellors et al., “Prevalence and Predictors of Human Papillomavirus Infection in Women in Ontario, Canada,” Canadian Medical Association Journal 163, no. 5 (Sept. 5, 2000).
Jennifer Jones is a domestic programs fellow at PRB.

Census-Taking More Frequent, Less Controversial in Canada
(April 2001) As Americans wait for the detailed results of the 2000 U.S. census, Canadians are preparing for their twice-a-decade head count.
Statistics Canada, the country’s major statistical agency, has designated May 15 as Census Day. The agency expects to count 31 million people in nearly 12 million households.
Quinquennial, not Decennial
Unlike the United States, which conducts a census once every 10 years, Canada takes its census of population every five years, in years ending in “1” and “6.” According to demographer Roderic Beaujot of the University of Western Ontario, the mid-decade census started in 1906 with the census of the prairie provinces, which were growing quickly and required more frequent head counts. It then became a national tradition in 1956. Dale Sewell of Statistics Canada noted that, because the census is viewed as an economical means of collecting a great variety of data, the mid-decade census was incorporated in the Statistics Act when it was updated in 1971.
Canadian statisticians and demographers appear happy with their system. “Before 1986,” said Beaujot, “the mid-decade census was basically a head count. Now it allows us to sometimes have different questions on the two censuses. A big advantage is that the whole apparatus does not go extinct over a shorter interval.”
The Long and Short of It
Like its U.S. counterpart, the Canadian census has a short form and a long form. The short form, which four-fifths of Canadian households receive, contains seven questions related to population — for example, sex, age, and household and family relationship. (By contrast, U.S. census short form contains a housing question on whether or not householders own or rent their dwellings.) Also included on the Canadian short form are questions about marital status, including common-law status, and mother tongue. (Canada’s 2001 census questionnaire redefines a common-law couple to include two people of the same sex.)
Canada’s long form, sent to the remaining one-fifth of the population, includes the short form questions and 52 additional questions. As in the United States, the long form items are mostly on detailed demographic, social, and economic characteristics of the population-including items on activity status (disability), language spoken at home, citizenship status, migration, level of education, labor force and employment status, and income received in the previous year. Questions about race and ethnicity, which the U.S. census places on its short form, are on Canada’s long form, as are questions that the U.S. census doesn’t include: religion, parents’ place of birth, and language spoken at work.
Like the United States, Canada uses census information to redraw election districts, to establish a basis for transfer payments from the federal government to the provincial governments, to administer national programs, and to facilitate planning by local governments and businesses.
Those Who Refuse to Answer Are Taken to Court
The return rates for the short and long forms have historically been about the same. There is roughly an 85 percent mail-back rate, said Sewell. He noted that eventually Statistics Canada gets about 99.9 percent of the forms back. “We make every effort to convert refusals, and give them many chances to change their minds. As a final step, however, we take hard-line refusals to court.” After the 1996 census, he said, 37 people received summons from the Department of Justice. He stressed that: “This is a criminal charge and results in criminal convictions.”
Net Undercount in 1996 of 2 Percent
One of the major — and most contentious — issues surrounding the U.S. census was the “undercount” and how to handle it. Coverage is also a concern to Statistics Canada officials. The net undercount in the 1996 census was 2.45 percent, which translates into about 723,000 persons. (The net undercount in the 1990 U.S. census, by comparison, was 1.8 percent.) Just as in the United States, the extent of Canada’s net undercount is not evenly spread out across the country. In Canada, the net undercount in 1996 was higher in western Canada and the territories (3.8 percent in British Columbia, 5.2 percent in the Northwest Territories), in large metropolitan areas (3.9 percent in greater Vancouver, 3.2 percent in the Toronto area), and among young adults (5.6 percent for persons ages 20 to 24) and those whose mother tongue was neither French nor English (5.2 percent).
Yet compared with public reaction in the United States, the political and fiscal repercussions of the undercount are less important in Canada, according to Barry Edmonston, director of the Population Research Center at Portland State University. Edmonston said that the strict one person-one vote rules are less pressing and that, although the census is used to develop boundaries for parliamentary seats, there is less legal or political wrangling over them than in the United States. Therefore, he believes, “adjustment and sampling for completing the count have not been an important issue for Canada.”
Availability of Data
Data from Canada’s 2001 census will be released according to the following schedule:
| Data | Release Date |
|---|---|
| Population and dwelling counts | Spring 2002 |
| Age and sex | July 2002 |
| Marital status | October 2002 |
| Language, mobility, and migration | December 2002 |
| Citizenship, immigration, origin | January 2003 |
| Employment questions | February 2003 |
| Education questions | March 2003 |
| Aboriginal | April 2003 |
| Socioeconomic questions | May 2003 |
Kelvin Pollard is a research demographer with the Population Reference Bureau.
For More Information
More information about the 2001 Canadian census is available through Statistics Canada’s website: www.statcan.ca/english. French speakers may access this information at: www.statcan.ca/francais.


 ">
">


