prb-hero

Most European Women Use Contraceptives

(April 2001) Europe has the lowest fertility rates in the world. In 2000, the average for the region was 1.4 children per couple, and it ranged from 1.1 children in Bulgaria and the Czech Republic to 2.2 children in Albania.

Social scientists posit a number of explanations for Europeans’ apparent reluctance to have children. Many point to the rising costs of raising children — not just higher costs of living, but also the personal costs to parents of deferred professional advancement and individual fulfillment. Another explanation focuses on related changes in social expectations about marriage and family formation: Young Europeans may not feel the same social pressure to get married and have children as did their parents and grandparents.

Europe’s low fertility has also been linked to the so-called “contraceptive revolution.” There is a common assumption that access to effective contraception is universal in Europe and that European women can successfully control if and when they get pregnant. Until recently, however, there was little empirical evidence about contraceptive use among European women. In the 1990s, a series of national surveys revealed new information about the level of contraceptive use and the most popular methods in various countries. The surveys also show that European women still have surprise pregnancies, despite the easy availability and high contraceptive use rate. (See Box below.)

The vast majority of European women of childbearing age use contraception — and Europeans are more likely than Americans to be practicing birth control. In most European countries, more than four out of five women of childbearing age who were married or in a marriage-like relationship were using a contraceptive method at the time of the survey. The use rates ranged from 92 percent in Hungary in 1993, to 66 percent in Lithuania in 1995 (see Table 1). A 1995 survey in the United States showed that three-quarters (75 percent) of currently married American women ages 15 to 44 were using a contraceptive method; 69 percent of formerly married American women were using a method.


Table 1
Contraceptive Use in Selected European Countries, 1990

Country/ Year of survey Percent of women in union using contraception
Austria, 1996 67.9
Belgium, 1992 84.2
Finland, 1990 84.0
France, 1994 89.9
Germany, 1992 84.8
Hungary, 1993 91.8
Latvia, 1995 84.9
Lithuania, 1995 65.9
Norway, 1989 80.3
Poland, 1991 75.7
Slovenia, 1995 84.4
Spain, 1995 87.2
Canada, 1995 80.2
United States*, 1995 76.4

* Currently married women ages 15 to 44. Note: The percentage is based on a sample of women of reproductive age who were in union and therefore exposed to the risk of pregnancy. The ages of respondents varied by country. Most surveys included women 20 to 45; some surveys also included slightly younger and older women.
Sources: Author’s calculations of data from the Fertility and Family Surveys; and J. Abma, A. Chandra, W. Mosher, L. Peterson, and L. Piccinino, “Fertility, Family Planning, and Women’s Health: New Data from the 1995 National Survey of Family Growth,” Vital and Health Statistics Series 23, no. 19 (Hyattsville, MD: National Center for Health Statistics, 1997): Table 42.


The nearly universal use of contraception in Europe today is a phenomenon that appeared in the past three decades. Only one-third of European women born in the 1940s and 1950s used contraception the first time they had sex, for example, while more than two-thirds of women born in the 1970s used contraception the “first time.”

Most European women rely on highly effective contraceptive methods. Oral contraceptives are the most popular form of birth control; the pill is particularly dominant in Germany where it accounts for 84 percent of contraceptive use (see Table 2). Female sterilization, which rivals the pill as the top method in the United States, is not as popular in Europe. Sterilization was important only in Belgium, Spain, and Finland, where it accounted for 10 percent to 18 percent of use.


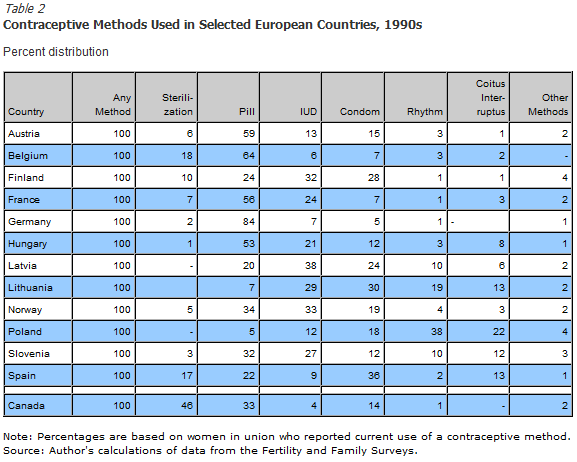
Surprisingly, traditional methods that have a relatively high failure rate are still widely used, especially in Spain and Eastern Europe. In Poland, more than one-third of women in a marital union reported using the rhythm method, while more than one-fifth said they used withdrawal. Rhythm (or periodic abstinence) and withdrawal (“coitus interruptus”) are the only forms of birth control condoned for married couples by the Catholic Church. This religious sanction might explain the higher use rates for these methods in countries like Poland and Lithuania that have large Catholic populations. Another barrier to the use of the pill or other “supply” methods in former Soviet countries, including Latvia, Lithuania, and Poland, was that the importation of contraceptives was often limited and many women did not have a reliable source of supply.

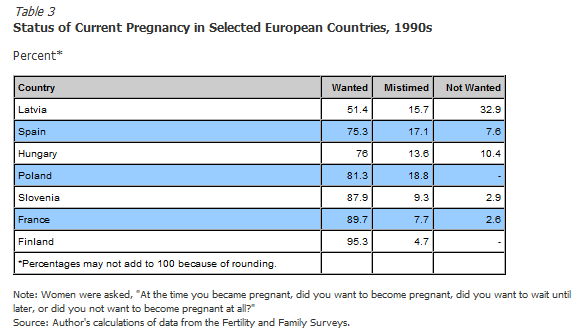
The efficiency of contraceptive methods used vary from country to country, in part reflecting the reliability of supply and consistency of use. Contraceptive failure is starkly reflected in measures of unwanted pregnancy. Nearly one-half of Latvian women and more than one-fifth of Hungarian and Spanish women pregnant at the time of the survey said they had not wanted their current pregnancy, or had wanted it at a later time (see Table 3). In France this share was 10 percent; in Finland, it was only 5 percent. In a 1995 survey in the United States, by comparison, about 9 percent of pregnancies were unwanted at the time of conception. A much larger share of pregnancies (21 percent) were “mistimed,” according to U.S. women interviewed.


How can European women avoid unwanted pregnancies? Better information and education on reproductive health could help. Despite high levels of formal education, some women still have gaps in their knowledge about when they are fertile or how to use contraceptives effectively.

Reducing unwanted pregnancies would prevent many abortions, which many people consider a laudable goal — abortion is quite prevalent in some Eastern European countries. Eliminating unwanted pregnancies would also reduce fertility, however, which is not a popular outcome. Most Europeans would not welcome lower fertility rates.


Ralf Ulrich is president of Eridion, GmbH, based in Germany.


Box
Collecting Information on Contraceptive Use in Europe

Until recently, there has been more information on contraceptive use and family planning in less developed countries in Asia, Latin America, and Africa than there has been in Europe. There have been several series of national surveys administered in less developed countries since the 1970s, fueled by the apparently urgent need for information about childbearing and family planning in countries where women had five to six children, on average, and where population growth was outstripping economic growth. The most recent and extensive effort is the Demographic and Health Survey (DHS) project, which involves more than 140 surveys in nearly 70 countries. But there has been less urgency about family planning behavior in Europe, where women appeared to have control over their reproductive lives and fertility was low. Only a few countries in the region conducted national surveys before the 1990s.

In the 1990s, a series of fertility surveys known as the Fertility and Family Surveys (FFS) were conducted in 24 more developed countries, primarily in Europe. The national surveys of 1,700 to 6,000 women (depending on the country) are an important source of information about contemporary patterns in the use of contraception in Europe. The questionnaires covered a broad range of problems related to fertility and family formation; many of the surveys also included a questionnaire for men. The minimum ages of respondents were not uniform, however. In most surveys, the ages of respondents ranged from 15 to 24 at the lower end, and from 40 to 49 at the upper end.

The design of the FFS benefited from the experiences with the DHS in less developed countries. Implementing the FFS questionnaires showed, however, that it was much more difficult to use standardized questionnaire modules in Europe than in the DHS countries. Consequently, FFS survey data on contraceptive use and other variables are less comparable than DHS data sets. Published individual country reports differ substantially in the way contraceptive prevalence is computed, but they provide a benchmark for further research into childbearing and family planning in Europe.


prb-hero

The Baltics: Demographic Challenges and Independence

(November 2000) Latvia, Estonia, and Lithuania are in the midst of a transition to independence after nearly 50 years of domination by the Soviet Union. Some of the first laws passed by the newly independent governments placed strict limits on who could become a citizen and actively promoted use of the native languages. Latvia’s laws were probably most severe — only Latvians whose families were citizens before 1940 automatically gained citizenship to independent Latvia — all others had to meet stringent qualifications — including fluency in the Latvian language and 16 years of residency. The laws left many former Soviet citizens, many of whom were long-term residents, without citizenship in any country. International critics, most vocally from Russia, claimed these laws infringed on the civil rights of the large ethnic minorities within these countries.

Reforms in 1998 extended citizenship options for non-Latvians, but a new language law taking effect in September 2000 has renewed tensions over ethnic relations. The new law requires that government officials demonstrate a fluency in Latvian a problem in many large cities where Russian is still the predominate language. Schools are required to phase in Latvian language instruction and some long-time teachers are being challenged to learn Latvian.

Some citizenship requirements have been modified in Estonia as well, but Baltic nationalists remain firm in their desire to assert their ethnic identities. Their actions can be better understood within the context of their political histories and current demographic realities. After World War II, tens of thousands of Soviet troops and Russian colonists were brought to the region to solidify Soviet domination. Russian was the official language in the Baltics and was taught in the schools. Relatively few of the foreigners learned the Baltic languages.

The end of Soviet rule in 1991 left thousands of Russians, along with smaller numbers of Ukrainians, Poles, Belorussians, and other foreigners, living in newly independent countries. Many Russians colonists and military personnel left the region in the early 1990s, but most remained. In the late 1990s, ethnic Russians still made up at least one-third of both Estonia and Latvia, and about 9 percent of Lithuania. Ukrainians, Poles, and other foreigners made up another 5 percent to 10 percent of these countries’ populations.

Independence also ushered in extremely low fertility rates and rising mortality rates, which-combined with the initial exodus of tens of thousands of immigrants-caused the population to decline during the 1990s. With the low birth rates and slower outflow of foreigners, these populations will continue to include large ethnic minorities, and language and citizenship are likely to remain hot political issues.

Taken together, the three Baltic states have 7.5 million inhabitants within an area of 67,600 square miles. The region consists of relatively flat and low-lying moist land that has few natural resources, but its strategic location on the Baltic Sea provides a valuable outlet to the sea. Access to seaports prompted imperial Russia and later the Soviet Union to invade and rule the area.

The Baltic countries achieved statehood only in the 1920s, after the Russian revolution and World War I. But their new independence was shattered by World War II when the Baltic region became part of the Soviet Union as part of a secret pact between Nazi Germany and the USSR. Their incorporation into the USSR was never recognized by the United States, and each country maintained diplomatic legations in Washington that served as ready-made embassies after independence. Lithuania was the first of the former Soviet republics to declare independence, on March 11, 1990. Estonia and Latvia followed suit the following year.

Estonia: Forging Closer Ties to the European Community

Estonia is the smallest of the Baltic countries both in land area and population. But it is the wealthiest of the three and is likely to become the first to be admitted to the European Union. It still imports most of its energy fuels from Russia and other former Soviet republics, but trade with Finland and other European countries has replaced lost trade with Russia. As the country forges closer economic ties to the rest of Europe, pressure to improve the civil rights of non-Estonians has increased.

Estonia has about 1.4 million inhabitants. The country is basically flat, dotted with lakes and peat bogs. The northern shore, called the Glint, is cut by limestone escarpments that allow for good harbors, including the harbor at Tallinn, the capital.

The Estonian language, which belongs to the Balto-Finnic group of the Finnic-Ugric languages and uses Latin characters, was made the official language in 1989. The teaching and use of Estonian are promoted throughout society, yet ethnic Estonians make up less than two-thirds of the population. About 30 percent of the population is Russian; Ukrainians and Belorussians make up another 5 percent.

Estonia’s population was just over 1 million in 1950 and reached 1.6 million in 1990. The birth rate had been constant at about 16 births per 1,000 population for many years; the total fertility rate (TFR) — or average number of children born per woman — was about 2.2 children per woman, just above the level needed to maintain a stable population size. By 1998, the birth rate had fallen just below 9 while the death rate was 13 per 1,000 population, which meant that more people died than were born each year. The TFR was among the world’s lowest, at 1.2 children per woman. Emigration, primarily of Russians, caused a net population loss of about 90,000 between 1989 and 1994, but the outflow slowed in the later 1990s. By 2000, the population had fallen to an estimated 1.4 million persons and was declining by about 8,000 per year.

Post-independence Estonians are waiting longer to marry but not necessarily waiting longer to have children. The average age at first marriage for Estonian women rose from 22.5 in 1990 to 24.3 in 1998. The average age when women have their first child rose more slowly: from 22.9 to 23.6. The proportion of babies born to unmarried women shot up from 27 percent in 1990 to 52 percent in 1998. Access to contraception was limited, especially in the economic and social disruptions of the 1990s. Abortion is prevalent. There were an estimated 152 abortions for every 100 births in 1997.

Life expectancy suffered after independence, but began to recover in the later 1990s. Life expectancy at birth for Estonian males dropped from 66.6 years in 1988 to 61.1 years in 1994, while it slipped from 75.0 to 73.1 for females. Health conditions have improved as the country transitions to a free-market economy, but life expectancy at birth still has not returned to the pre-independence levels for men, and is only slightly higher for females. In 1998, life expectancy was 64.4 years for males and 75.5 years for females-well below the averages for other northern European countries.

With its low birth rate and large foreign community, the ethnic Estonian population is not likely to increase its share of the country’s population, and the country’s residents are slowly accepting their new reality as a multicultural society. In a recent survey reported by the Baltic News Service, a large majority of ethnic Estonians said they believed that different nationalities could get along and work together, and about three-fourths said that different languages and cultures enrich the society. The same survey found that a large majority of non-Estonian residents said they considered Estonia their home and felt loyal to the government. These attitudes are a marked change from a 1993 survey in which only 29 percent of Russian-speakers said they were treated fairly in the country.

Latvia: A Struggle for Identity

Latvia is the middle Baltic country, with Estonia to the north and Lithuania to the south. Latvia’s strong brand of nationalism may reflect the fact that ethnic Latvians are a slim majority of the population and a minority in many of the country’s largest cities. The Latvian language, using Latin letters, belongs to the Baltic group of Indo-European tongues. It has only one other modern counterpart, Lithuanian.

Latvia has been ruled by outsiders throughout most of its history. Prior to the USSR’s breakup, Latvia was independent only during the interwar period, 1918 to 1940. In June 1993, Latvia finally held its own elections, replacing the legislature from the Soviet era and electing a president. In 1995, the Council of Europe granted Latvia membership, over Russian objections. Latvia is now applying for acceptance to the European Union, which would bring a number of economic benefits.

Latvia’s stringent citizenship law has been a stumbling block to its acceptance by European countries. Even after some requirements were relaxed, relatively few non-Latvians sought or gained citizenship, and many resented their treatment by Latvians. By June 1997, less than three-fourths of the country’s population were citizens, but less than 5 percent of the eligible population of non-Latvians had applied for citizenship.

Latvians have been divided about the treatment of non-Latvians-many fear international isolation and condemnation if they do not improve ethnic relations within the country. Others insist on reinforcing a strong national identity.

Latvia’s population was 2.67 million in January 1991, when it gained independence. It slipped to 2.44 million in January 1999, as the number of Slavic emigrants increased and the birth rate went into a freefall. From 1990 to 1992, about 90,000 emigrants left the country. It is the falling birth rate and rising death rate, however, that reversed Latvia’s demographic trends.

In 1990, there were 14 births per 1,000 population and women had 2.0 children, on average. Between 1990 and 1998, however, the annual number of births were cut in half, and the fertility rate fell to 1.1 children per woman. The annual number of deaths rose sharply until 1994, then fell back to the 1990 level. In 1999, there were about five deaths for every three births in Latvia.

The fertility decline reflected delays in marriage-the average age at first marriage for women rose from 22.2 in 1990 to 24.0 in 1998. But couples waited even longer to have children or chose not to have them at all. The share of births to unmarried women rose, but not as rapidly or as high as in Estonia. In 1990, about 17 percent of births were out of wedlock; by 1998, about 37 percent were out of wedlock. Abortion is also prevalent. In 1998, there were 108 abortions for every 100 births in Latvia.

Life expectancy for males fell sharply from 64.2 in 1990 to 60.7 in 1994; female life expectancy fell more slowly during the period, from 74.6 to 72.9 years. As conditions improved in the second half of the decade, life expectancy rose back to pre-independence levels. In 1998, life expectancy was 64.1 years for males and 75.5 years for females.

Lithuania: Ethnically Homogeneous

Lithuania is the largest Baltic state in population and territory. It includes 3.7 million people in a little more than 25,000 square miles. The country physically separates mainland Russia from the Russian oblast Kaliningrad, on the Baltic coast. Lithuania was once one of the strongest military powers in Europe. In the 14th century, the domain of the Grand Duchy of Lithuania stretched across Europe as far as Ukraine. But the end of the 16th century, Lithuania was reduced to the comparatively small size it is today.

Lithuania is by far the most ethnically homogeneous of the Baltic countries. In 1998, the population was 82 percent Lithuanian, 8 percent Russian, and 6 percent Polish.

Lithuania’s birth rate dropped from 15 births per 1,000 to 10 per 1,000 between 1990 and 1999, while its death rate remained just under 11. The TFR fell from 2.0 births per woman in 1989 to 1.3 in 1999. Women marry at a relatively young age, compared with the other Baltic states, and the age is declining-in contrast to elsewhere in Europe. In 1998, the average age at marriage for women was 22.9 years, and the average age at first birth was 26.3. Abortion is less prevalent here than in Estonia or Latvia, but is still relatively common. In 1997, there were 60 abortions for every 100 births.

Life expectancy at birth for males reached a high of 67.9 years in 1986–1987, but fell to 64.8 by 1994. It increased to 65.9 years in 1997, still below the highs of the mid-1980s. For females, the slide was far less over this period. Life expectancy at birth for females fell from 76.6 to 74.9, and then rose back to 76.8 in 1997.

Unlike the other Baltic countries, relations with the small Russian minority are quite good. All residents are permitted to attain citizenship, regardless of their ethnic origin, a policy that facilitated Lithuania’s entry into the Council of Europe. Lithuania is working toward membership in the European Union, which may further weaken its ties to the former Soviet republics.


Mary Kent is the editor of Population Bulletin at the Population Reference Bureau.


For More Information

The Baltic Nations: Demographic Challenges in the Transition to Independence

Baltic News Service, “Most Non-Ethnic Estonians See Themselves as Loyal to Estonia – Survey,” Oct. 10, 2000. Accessed online on Oct. 26, 2000.

Council of Europe, Recent Demographic Developments in Europe 1999 (Belgium: Council of Europe, 1999).

Eastern Europe and the Commonwealth of Independent States 1999 (London: Europa Publications, 1998).

Europe Information Service, European Report, “Minorities Issues Trouble EU-Latvia Joint Parliamentary Committee,” Oct. 11, 2000. Accessed online on Oct. 26, 2000.

Carl Haub, “Population Change in the Former Soviet Republics,” Population Bulletin 49, no. 4 (Washington, DC: Population Reference Bureau, 1994).

Alain Monnier, “La conjoncture démographique: l’Europe et les pays développés d’outre-mer,” Population 54, no. 4-5 (juillet-octobre 1999).