Carl Haub
Demographer Emeritus

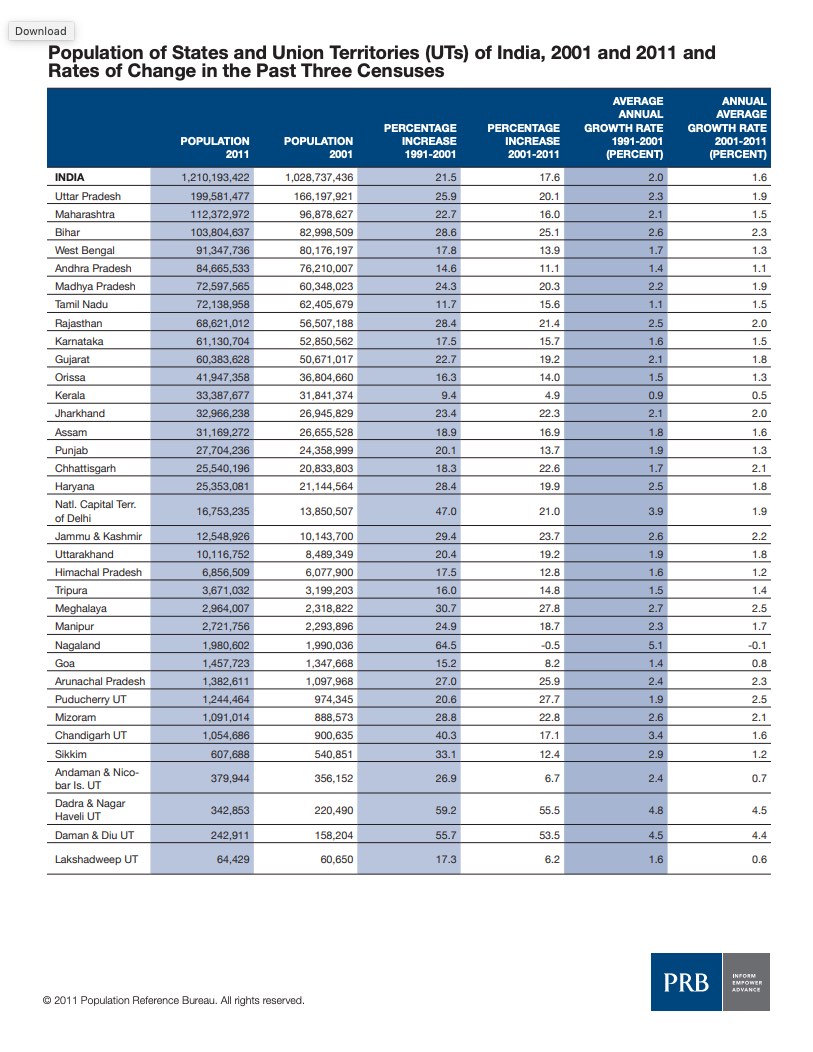
Together, China and India account for 37 percent of the world’s population. Both countries have conducted censuses over the past year, and when they report their census results, figures such as the widely accepted world population total are at risk of changing. India has released the results of its 2011 Census, conducted from Feb. 9-28, 2011, with a revisional round on March 1-5. The provisional population totals were released on March 31, less than a month after the census was conducted.
The preliminary census count with a “census date” of March 1, 2011, was 1,210,193,422—about 130 million less than the current population of China.1 The census total was close to what was expected based on estimates by the Registrar General & Census Commissioner of India and other organizations. In 1950, shortly after India gained independence, India’s population was 68 percent that of China. Now it is 90 percent. China’s population currently increases by a little less than 7 million per year while India’s grows by about 18 million. India’s population will likely pass China’s shortly after 2020, according to the recent preliminary projections from the United Nations Population Division.
India’s 2011 Census is remarkable in one important way: The number of people added between the 2001 and 2011 censuses was slightly less than that between the 1991 and 2001 censuses. The last time this happened was between the 1911 and 1921 censuses, when the population actually declined. The year 1921 is often referred to as the “Year of the Great Divide,” the last period in which India’s population declined, due to the effects of famine. Nonetheless, the 181 million people added to India’s population over the past 10 years is roughly equal to the population of Pakistan or all of western Europe.2 But this trend is not necessarily a one-way street. Should the birth rate in India’s heavily populated and higher-fertility northern states not decline smoothly, the number added could rise yet again.
One much-anticipated census figure has seen a lot of attention in the Indian press. The sex ratio of the child population ages 0 to 6 rose from 108 males per 100 females in 2001 to 109 in 2011.3 While not a large increase, the change is in the wrong direction, showing a growing preference for sons. In China, there are about 119 to 120 male births per 100 females. Normally, the ratio would be about 105 because biologically there are about 5 percent more male births worldwide than female. In India as well as in China and some western Asian countries, the preference for sons has resulted in the abortion of female fetuses and poorer nutrition and health care for girls.
Censuses of India, 1901-2011
| Census Years | Population | Change in Population Between Censuses | Percent Change Between Censuses | Annual Growth Rate (percent) |
|---|---|---|---|---|
| 1901 | 238,396,327 | — | — | — |
| 1911 | 252,093,390 | 13,697,063 | 5.8 | 0.6 |
| 1921 | 251,321,213 | -772,177 | -0.03 | 0 |
| 1931 | 278,977,238 | 27,656,025 | 11.0 | 1.0 |
| 1941 | 318,660,580 | 39,683,342 | 14.2 | 1.3 |
| 1951 | 361,088,090 | 42,427,510 | 13.3 | 1.3 |
| 1961 | 439,234,771 | 78,146,681 | 21.6 | 2.0 |
| 1971 | 548,159,652 | 108,924,881 | 24.8 | 2.2 |
| 1981 | 683,329,097 | 135,169,445 | 24.7 | 2.2 |
| 1991 | 846,421,039 | 163,091,942 | 23.9 | 2.2 |
| 2001 | 1,028,737,436 | 182,316,397 | 21.5 | 2.0 |
| 2011 | 1,210,193,422 | 181,455,986 | 17.6 | 1.6 |
Source: Registrar General of India, Census 2011, Provisional Population Totals.
In India, sons are preferred for the economic support they provide for the household, particularly in their parents’ old age. Daughters are not seen as a source of financial support, especially since they leave the parental home to live with their husband’s family after marriage. In addition, parents of daughters must still pay a dowry, despite the practice being illegal since 1961. A telling saying in India is: Having a daughter is like “watering your neighbor’s garden.” Another reason for the abortion of females is the desire of many Hindus to have a son who will light their funeral pyre. Sex-selective abortion was criminalized in 1994 but serious enforcement of the law was rare until recently.4 The National Commission for Women, established in 1992, oversees all women’s rights issues, particularly female infanticide and sex-selective abortion.
The national figure masks a more skewed sex radio in several states. In Punjab and neighboring Haryana, the 0 to 6 sex ratio is a very high 125 and 122 males per 100 females, respectively. However, another official source, the Sample Registration System (SRS), indicates that government campaigns against the abortion of females may be having some effect. In Punjab, the sex ratio at birth recorded in 2006-2008 had declined to 120 male births for every 100 female births from 129 in 1999-2001, the first period for which the statistic was reported. Improvements were also found in most other states. Things may be turning around.
Subnational population counts, such as those for states, are important in any census, but in India they take on special significance. The country’s total fertility rate (TFR) has declined from about 6 children per woman in the early 1950s to about 2.6 today, an impressive change.5 But much of that decline has been in certain states, most notably in the south. The TFR remains high in some of the most populous states of northern India, with the lowest levels of education and women’s status, less effective governance, and more entrenched traditional values and customs. These states are called the Empowered Action Group (EAG) states and are singled out as targets for a variety of government health and family planning programs. The EAG includes Bihar, Chhattisgarh Jharkhand, Madhya Pradesh, Orissa , Rajasthan, Uttarakhand, and Uttar Pradesh.
The EAG states accounted for 46 percent of India’s 2011 population and 53 percent of its population growth. Both figures are certain to rise despite decreasing birth rates in each state. The sharpest TFR declines over the past few decades have been in states that have been well administered and happen to be in the south. Kerala, with a progressive history including significant rights for women, has a very low TFR of 1.7, as does Tamil Nadu, another southern state.6 Andhra Pradesh, whose government aggressively promoted family planning to the point where 39 percent of married women ages 20 to 24, 69 percent of those ages 25 to 29, and 79 percent of those ages 30 to 34 have been sterilized, has a TFR of 1.8.7 That is in stark contrast to the EAG states where the TFR is 3.9 in Bihar, 3.8 in Uttar Pradesh, and 3.3 in Madhya Pradesh and Rajasthan. Birth rates are slowly declining in those states but they nonetheless increased by more than 20 percent from 2001 to 2011. And those increases mask somewhat higher growth because a considerable numbers of workers and their families leave to find work in cities or other states. The big question for India’s total population is: Will fertility in those states continue to decline and to what level? A TFR of about 2.1 is generally required for a population to stop growing, but the future course of fertility in those states cannot be predicted.
The census found a continuing increase in literacy. Overall, 74 percent of the population 7 years and older was listed as literate—82 percent for males and 65 percent for females. Literacy for females rose faster so the gap between the sexes narrowed from 2001; female literacy is now 17 percent lower than males, compared with a 22 percent gap in 2001. While the EAG states lag behind the non-EAG states, they also have shown notable improvement, from 57 percent of the population literate in 2001 to 69 percent in 2011. For females, literacy passed 50 percent for the first time in the 2011 Census at 58 percent, a 15 percent increase since 2001. However, literacy figures as reported in the census should be taken with caution. Often, the person responding for the household may report a household member as literate if he or she has any schooling at all. In this case, literacy may be marginal at best; people can lose literacy through lack of use in daily life.8
The 2011 Census of India reaffirms familiar patterns of global demographic change. As in much of the developing world, population growth in India has become heavily concentrated in the poorest areas with large populations. India’s future is largely dependent upon fertility decline in the EAG states.
 ">
">