Sandra Yin
Former Associate Editor

At 300 million, a milestone reached in October, Americans are consuming natural resources at an unprecedented pace. Between 1950 and 2005, America’s population nearly doubled. But in many cases, our consumption of resources more than doubled:
Figure 1
Energy consumption per year rose from 35 quadrillion Btu to 100 quadrillion Btu between 1950 and 2005.
Source: Energy Information Administration, Annual Energy Review 2005.
The United States’ reaching 300 million people might not seem relevant at a global level. After all, the United States represents just 5 percent of the world population. But it consumes disproportionately larger amounts than any other nation in the world—at least one-quarter of practically every natural resource. And because it is the only industrialized country in the world still experiencing significant population growth, this high rate of resource consumption is expected to continue.5 “Each person in the U.S. contributes more to the global phenomenon [of natural resource consumption] than other people,” says Victoria Markham, director of the Center for Environment and Population, and author of the U.S. National Report on Population and Environment.
What’s behind Americans’ voracious appetite for resources?
Sometimes it’s a lifestyle choice.
In 2001, Michael Frisby moved his family of four from a 3,700 sq. ft. house in Mitchellville, Md., to an 11,000-square-foot house in Fulton, Md. Amenities in the five-bedroom/five-bath house which sits on a 3.5-acre lot include a music room, steam room, and media room.
“I always wanted a house big enough that my kids could be in their room screaming, and my wife could be in a room screaming, and I could be somewhere else and not hear any of them,” he says. “And I think I have accomplished this with this house, because this house is so big that everyone has their own space.”6
Frisby is on the leading edge of a national trend toward larger houses. In 1950, the average new single-family home was 983 square feet. By 2004, it was more than twice that: 2,349 square feet. Although new houses may be more energy efficient than the houses of the past, they require more resources to build and use.7
With more Americans reaching their highest-earnings years, it’s not surprising that they’re spending more freely, says Peter Francese, founder of American Demographics magazine. But he also notes that high consumption tends to occur in households in the highest income quintiles. For example, households in the top-income bracket average 2.8 vehicles, but the number of vehicles progressively drops in lower household-income groups, according to the Consumer Expenditure Survey.
How we live spatially affects other consumption patterns. In recent decades, “sprawl” has become the most common land-use pattern. Sprawl refers to developments with low-density residential subdivisions, commercial strips, large retail complexes surrounded by acres of parking and office parks far from home and shops, and a growing network of roads to link them.8
“Sprawl culture,” says John Talberth, director of the sustainability indicators program at Redefining Progress, a nonprofit organization that promotes sustainability, “is probably the most consumptive housing pattern you could come up with.” Compared with more compact, more urban built spaces, sprawl maximizes consumption of virtually everything. In suburban sprawl patterns, the throughput—or daily flow of energy and water used, packaging, and waste generated to support the lifestyle of people in the house—is much greater than in more compact urban areas, Talberth says.
Figure 2
Although the average number of people per U.S. household fell between 1969 and 2001, the number of vehicles per household rose.
Source: U.S. Dept. of Transportation, “Distribution of Vehicles and Persons per Household,” (www.fhwa.dot.gov, accessed Oct. 5, 2006).
Sprawl translates into longer drives to connect home with work, school, and recreation. Not surprisingly, Americans’ annual number of vehicle-miles traveled in 2004 was nearly 6.5 times the number in 1950.9 We drive more miles, using more fossil fuel, which adds to greenhouse gases blamed for global climate change. As our dependency on cars grows, fuel consumption rises exponentially, due in part to growing congestion on the roads. More stop-and-go driving results in less fuel efficiency and more pollution.10
Americans have more cars and other vehicles than before. While the number of people per household declined, the number of vehicles per household grew between 1969 and 2001 (see Figure 2).
And Americans are more likely than ever to drive alone to work than carpool, take public transit, or walk to work. The share of workers who drove to work alone rose from 64 percent to 76 percent between 1980 and 2000. During that same period, the share that carpooled fell from 20 percent to 12 percent.11
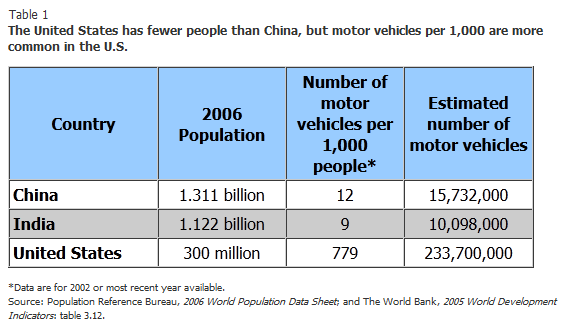
But population size alone does not determine a country’s environmental impact. For instance, China and India are home to far larger populations than the United States. Yet America’s love affair with the car translates into a larger estimated number of motor vehicles on the roads (see table).
Countries with much larger populations contribute less to air pollution such as greenhouse gas emissions due to motor vehicles including buses and trucks. The latest data available shows that China had 12 motor vehicles per 1,000 people compared with the United States with 779 motor vehicles per 1,000 people.
Even as America passes the 300-million mark, Americans use 75 percent more water per capita than the average person in the world’s developed nations (see Figure 3).
Figure 3
U.S. residents used more than three times the amount of water per capita used by people in developing countries in 2000.
Source: World Resources Institute, UN FAO, Water Resources and Fisheries (http://earthtrends.wri.org, accessed Oct. 10, 2006).
Sometimes demand for water has grown in the fastest-growing, most populous areas least able to meet it. The shift in the share of population in the South and West from 48 percent to 58 percent of the national total between 1970 and 2000 pushed demand for water in areas that already had the highest per capita water consumption, despite arid regions in the West.
In high-growth areas, soaring population and high-maintenance lifestyles are sapping limited water supplies like never before. Among the top five metro areas for single-family housing construction permits issued in 2005, four in five have experienced water shortages over the past two years. These include Atlanta-Sandy Springs-Marietta, Ga.; Phoenix-Mesa-Scottsdale, Ariz.; Dallas-Fort Worth-Arlington, Texas; and Riverside-San Bernardino-Ontario, Calif.12
The cultural preference for lush landscapes or lawns in naturally arid habitats are among factors that drive our increased water demand. Between 1970 and 2006, the number of golf courses across the nation grew from 10,000 to 16,000. An average 18-hole golf course is at least 150 acres, according to the National Golf Foundation. Between 100,000 and 200,000 gallons of water a day may be needed to keep the fairways plush and green.13
In response to concerns about the water supply, communities are attempting to scale back on water consumption. In Southern California, some local governments give residents free ultra-low flush toilets and are building water-recycling plants on the grounds of new developments. In Arizona, golf courses are being redesigned with less natural turf. In Las Vegas, water inspectors scour the neighborhoods for “water conservation violators,” or anyone wasting water. In San Marcos, Texas, restaurants are prohibited from serving water except upon customer request. In Clark County, Nev., turf regulations in areas under drought alert prohibit new turf in front yards. Groups in Georgia, Texas, Colorado, and New Mexico are promoting “xeriscape,” or landscaping especially for dry or desert-like conditions to conserve water and protect the environment.14
Americans’ trash grew faster than its population over the past few decades. Although the population grew by 65 percent between 1960 and 2005, the amount of trash thrown out doubled from 83 million tons to 167 million tons (see Figure 4).
Figure 4
The amount of trash still exceeds the amount recycled and composted.
Source: U.S. EPA, Municipal Solid Waste: 2005 Facts and Figures (2006).
These amounts are for municipal solid waste or household trash including packaging, food scraps, old sofas, and refrigerators after material was pulled out for composting or recycling. Americans generate about 4.5 pounds of household trash per capita per day. We recycle a little over 1 pound per person each day.15
While Americans’ high-consumption way of life produces a disproportionately large amount of waste and uses inordinate amounts of natural resources, there is no one easy way to reduce America’s impact on the environment.
“A multifaceted response is needed,” says Roger-Mark De Souza, technical director for the Population Reference Bureau’s Population, Health, and Environment Program. “We can’t address the impact of population growth on the environment in isolation. We need to consider policies, technology, and choices that individuals make regarding the amount of materials they use.”
The effects of population growth on the natural environment depend on which policies, technology, and cultural trends are in place. Policies could encourage recycling or denser housing development and increase access to public transit. Technology might squeeze more power out of energy sources or reduce the amount of packaging we throw out each day. To persuade Americans to consume less, cultural perceptions about consumption must be adjusted through behavioral change, says De Souza.
Even when behaviors have changed, progress has been slow. Efforts to recycle or make more environmentally sensitive consumption decisions have made only a small dent in some consumption patterns. In 2005, less than one-third of municipal trash was recovered for recycling and composting. And while energy consumption is up 185 percent, renewable energy consumption rose by only 104 percent between 1950 and 2005. Renewable energy sources, including solar, wind power, and hydroelectric power, accounted for about 6 percent of total energy consumption in 2005.16
While it’s hard to predict where the United States is headed if it continues on this path, Markham notes that the country has already bumped up against some ecological thresholds. About 40 percent of the nation’s rivers are too polluted for fishing and swimming. One-third of all lakes were under a fish consumption advisory from pollutants in 2004, many from possible mercury contamination. More than 6,500 plant and animal species are at risk of extinction in the United States.17
Although the United States has reached 300 million, its impact on the environment need not be so big. “Choice is critical,” says Markham. “It’s not all about population numbers—because the same number of people in one place can have a very different environmental impact than that same number in another place. It’s more about how much and what type of natural resources each American consumes.”