- Patricia Stephanson et al., “The Public Health Consequences of Restricted Induced Abortion: Lessons from Romania,” American Journal of Public Health 82, no. 10 (1992): 1328-31; the Alan Guttmacher Institute, “Induced Abortion Worldwide,” accessed online at www.agi-usa.org, on Nov. 7, 2005; Population Reference Bureau, Unsafe Abortion: Facts & Figures (Washington, DC: Population Reference Bureau, 2005): 23; and Rachel Jewkes et al., “Prevalence of Morbidity Associated with Abortion Before and After Legalisation in South Africa,” British Medical Journal 324, no. 7348 (2002): 1252-53.
- The Alan Guttmacher Institute, Sharing Responsibility: Women, Society & Abortion Worldwide (New York: The Alan Guttmacher Institute, 1999): 28-29; and the Alan Guttmacher Institute, “Abortion in Context: United States and Worldwide,” accessed online at www.guttmacher.org, on Nov. 4, 2005.
- The Alan Guttmacher Institute, Sharing Responsibility: 28.
- Center for Reproductive Rights, “Abortion and the Law: Ten Years of Reform,” accessed online at www.crlp.org, on Nov. 3, 2005.
- The Alan Guttmacher Institute, “Facts in Brief: Induced Abortion in the United States,” accessed online at www.guttmacher.org, on Oct. 11, 2005.
- Lawrence B. Finer and Stanley K. Henshaw, “Abortion Incidence and Services in the United States in 2000,” Perspectives on Sexual and Reproductive Health 35, no. 1 (2003): table 1.
- Stephanie J. Ventura et al., “Revised Pregnancy Rates, 1990-97, and New Rates for 1998-99: United States,” National Vital Statistics Reports 52, no. 7 (2003): 1.
- Ventura et al., “Revised Pregnancy Rates”: 5; and Haishan Fu et al., “Contraceptive Failure Rates: New Estimates From the 1995 National Survey of Family Growth,” Family Planning Perspectives 31, no. 2 (March/April 1999): 58 and table 1.
- The Alan Guttmacher Institute, “Emergency Contraception Played Key Role in Abortion Rate Declines,” accessed online at www.guttmacher.org, on Nov. 7, 2005.
- Finer and Henshaw, “Abortion Incidence and Services in the United States in 2000”: table 3.
- Unintended pregnancies include those that were mistimed or unwanted. See the Alan Guttmacher Institute, “Facts in Brief.”
- Physicians for Reproductive Choice and Health and the Alan Guttmacher Institute, “An Overview of Abortion in the United States,” accessed online at www.guttmacher.org, on Oct. 31, 2005.
- The Alan Guttmacher Institute, “Facts in Brief.”
- Rachel K. Jones, Jacqueline E. Darroch, and Stanley Henshaw, “Patterns in the Socioeconomic Characteristics of Women Obtaining Abortions in 2000-2001,” Perspectives on Sexual and Reproductive Health, 34, no. 5 (2002): 226-35.
- Physicians for Reproductive Choice and Health, “An Overview of Abortion in the United States.”
- Jones, “Patterns.”
- Jones, “Patterns.”
- Fu, “Contraceptive Failure Rates,” table 4.
- Lawrence B. Finer et al., “Reasons U.S. Women Have Abortions: Quantitative and Qualitative Perspectives,” Perspectives on Sexual and Reproductive Health 37, no. 3 (2005): table 3.

Abortion in the United States and the World
Date
December 1, 2005
Roe v. Wade—the landmark 1973 U.S. Supreme Court case establishing that most U.S. laws against abortion violate a constitutional right to privacy—will come under more scrutiny in coming months as a newly reconfigured Supreme Court hears arguments in an abortion rights case (Ayotte v. Planned Parenthood of Northern New England). Here is a look at some facts and trends regarding abortion in the United States and worldwide.
Almost One-Half of All Abortions Performed Worldwide Are Illegal
Many analysts argue that if Roe v. Wade were weakened or overturned and access to safe, affordable abortion services should shrink, the number of illegal abortions in the United States could increase dramatically. As a result, the number of maternal complications or deaths caused by unsafe abortions—those abortions performed by unskilled providers or in unsanitary settings—also could rise.1
Women have abortions regardless of whether the procedure is legal in the country in which they reside. Evidence shows that laws that restrict abortion don’t guarantee low induced abortion rates: Nearly one-half of all abortions worldwide are performed in countries that allow abortions only in very limited circumstances.2 While abortion rates are high in Eastern European countries such as Russia and Romania where abortion is legal, they are also relatively high in some Latin American countries, where the procedure is highly restricted (see Table 1).3
Table 1
Numbers and Rates of Induced Abortion for Selected Countries
|
Country & year
|
Best
Estimate |
Rate*
|
Ratio**
|
Status of abortion
|
|---|---|---|---|---|
| Chile, 1990 |
160,000
|
50.0
|
35.3
|
Highly legally restricted |
| Brazil, 1991 |
1,444,000
|
40.8
|
29.8
|
Highly legally restricted |
| Colombia, 1989 |
288,000
|
36.3
|
26.0
|
Highly legally restricted |
| Nigeria, 1996 |
610,000
|
25.4
|
12.0
|
Highly legally restricted |
| Philippines, 2000 |
473,000
|
27.0
|
18.0
|
Highly legally restricted |
| Sweden, 1996 |
32,100
|
18.7
|
25.2
|
Legal |
| Finland, 1996 |
10,400
|
10.0
|
14.7
|
Legal |
| Germany,1996 |
130,900
|
7.6
|
14.1
|
Legal |
*The rate is the number of abortions per 1,000 women ages 15 to 44.
**The ratio is the number of abortions per 100 known pregnancies.
Sources: Stanley K. Henshaw, Susheela Singh, and Taylor Haas, “The Incidence of Abortion Worldwide,” International Family Planning Perspectives 25, no. 1 (1999); and Fatima Juarez et al., “The Incidence of Induced Abortion in the Philippines: Current Level and Recent Trends,” International Family Planning Perspectives 31, no. 3 (2005).
Most legal reforms in the past 10 years related to abortion made the procedure legal in more circumstances. While five countries (including the United States) took steps to make abortion illegal or harder to obtain, 13 countries legalized abortion under more circumstances.4
A Long-Term Decline in U.S. Abortion Rates
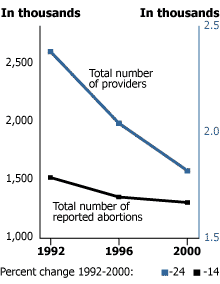
In the United States, the number of annual abortions has steadily declined in recent years. According to the most recent data available, 1.29 million abortions took place in 2002—down from an estimated 1.36 million in 1996 (see figure).5 The abortion rate was 21.3 per 1,000 women ages 15 to 44 in 2000, down from a high of 29.3 for that age group in 1981.6
Number of Abortion Providers and Reported Abortions, 1992, 1996, and 2000; and Percentage Change, 1992-2000

Source: Lawrence B. Finer and Stanley K. Henshaw, “The Accessibility of Abortion Services in the United States, 2001,” Perspectives on Sexual and Reproductive Health 35, no. 1 (2003).
According to the Alan Guttmacher Institute, factors that contributed to this decline include:
- A drop in the teenage pregnancy rate, which fell steadily through the 1990s and led to a decrease in the overall number of pregnancies from 6.8 million in 1990 to 6.3 million in 1999;7
- The advent of more reliable forms of contraception, such as the implantable or injectable hormones;8 and
- An increase in the use of emergency contraception since 1994.9
Less access to abortion services nationwide may have also played a role. Between 1992 and 2000, the number of abortion providers fell 24 percent from 2,380 to 1,819 (see figure).10 By 2000, 87 percent of U.S. counties had no provider of abortions.
Who Has Abortions in the United States?
One-half of all pregnancies in America are unintended.11 And one-half of those unplanned pregnancies end in induced abortion.12 Ultimately, nearly one in every four pregnancies in the United States ends in induced abortion.13
Younger women have the bulk of abortions in the United States: 75 percent of women who had abortions in 2000 were in their teens or 20s, while women age 40 or older had only 3 percent of all abortions.14 Married women account for a lower share of all U.S. abortions (17 percent) because they are statistically less likely to have unintended pregnancies—and those who do are more likely than unmarried women to continue the pregnancy.15 In fact, two of every three abortions (67 percent) were obtained by women who had never married.16
U.S. women who have abortions also tend to be in the low end of the economic spectrum. While women who lived on less than twice the poverty threshold ($28,300 for a family of three in 2000) made up 30 percent of women in the general population, they made up 57 percent of the U.S. women who had abortions in 2000.17
Finally, while white women undergo the majority (55 percent) of abortions, black women are three times more likely to end a pregnancy (see Table 2). Rachel Jones, a senior research associate at the Alan Guttmacher Institute, notes that black women have more unintended pregnancies because they are more likely to be poor and less likely to be married than white women. And Jones adds that black women also suffer from a disproportionate lack of access to contraceptive services and prescription methods as well as high contraceptive failure rates. For example, 20 percent of black women experienced contraceptive failure during the first 12 months of use, compared with 11 percent of white women.18
Table 2
Reported Legal U.S. Abortions, by Race of Women Who Obtained an Abortion, Selected States, 2000*
|
Race
|
Number of abortions
|
Percent of total abortions
|
Abortion ratio**
|
|---|---|---|---|
| White |
334,180
|
54.8
|
167
|
| Black |
214,212
|
35.1
|
503
|
| Other |
41,669
|
6.8
|
329
|
| Unknown |
19,426
|
3.2
|
NA
|
|
Total
|
609,487
|
100.0
|
230
|
*Data from 39 states, the District of Columbia, and New York City ; excludes four areas where race was reported as unknown for more than 15 percent of women.
**The abortion ratio is the number of legal abortions obtained by women of a given race per 1,000 live births to women of the same race.
NA=not available.
Source: U.S. Centers for Disease Control and Prevention, “Abortion Surveillance—United States, 2000” (Nov. 28, 2003).
Why U.S. Women Decide to Abort a Pregnancy
Surveys of U.S. women show that their decisions to have abortions are often fueled by a sense of responsibility to others. One survey found that the most frequently named “most important reasons” for abortions relate to whether a woman thinks she has the ability and/or the financial resources to care for a new child or dependent.19 Concerns about the health of the mother (4 percent), the health of the fetus (3 percent), or rape (less than 0.5 percent) were far less common reasons women ended their pregnancies (see Table 3).
Table 3
Share of U.S. Women Who Had An Abortion, By Their Most Important Reason for Having the Abortion, 2004
|
Reason
|
Percent of women who had an abortion
|
|---|---|
| Not ready for a(nother) child/timing is wrong |
25
|
| Can’t afford a baby now |
23
|
| Have completed my childbearing/have other people depending on me/children are grown |
19
|
| Don’t want to be a single mother/am having relationship problems |
8
|
| Don’t feel mature enough to raise a(nother) child/feel too young |
7
|
| Would interfere with education or career plans |
4
|
| Physical problem with my health |
4
|
| Possible problems affecting the health of the fetus |
3
|
| Was a victim of rape |
<0.5>
|
| Husband or partner wants me to have an abortion |
<0.5>
|
| Parents want me to have an abortion |
<0.5>
|
| Don’t want people to know I had sex or got pregnant |
<0.5>
|
| Other |
6
|
Source: Lawrence B. Finer et al., “Reasons U.S. Women Have Abortion: Quantitative and Qualitative Perspectives,” Perspectives on Sexual and Reproductive Health 37, no. 3 (2005).
Sandra Yin is associate editor at the Population Reference Bureau.


