An Improved State of Aging in America
Disability rates are down among older Americans, and more are managing daily life on their own with devices. But racial and ethnic gaps persist.

Older adults in the United States are functioning better on their own and a shrinking share are living in nursing homes and assisted living settings than a decade ago, new data show.1
Disability is down, as a smaller percentage of older adults receive help with daily activities and a larger share manage independently with home modifications and devices, according to 10 years of data from the National Health and Aging Trends Study (NHATS). The physical, sensory, and cognitive capacities of older adults, particularly women, are improving. And older adults are online more than ever before: They are more than twice as likely to use text or email than in 2011.
Despite these encouraging trends, NHATS data also reveal persistent racial and ethnic disparities among older adults, particularly in their ability to carry out daily tasks without help and modify their homes to meet their needs. The data also show that older adults were far less likely to participate in activities they value during the COVID pandemic than in previous years.
Conducted annually, NHATS collects information on the functional ability of older Medicare recipients, aiming to guide efforts to improve quality of life. Many NHATs findings are now available in new interactive dashboards and a companion chartbook, allowing users to dig into the data by demographic subgroup and create a custom picture of how the lives of older Americans—a rapidly growing segment of the population—are changing.
Older Adults Are More Independent, Aided by Assistive Devices
NHATS tracks seven activities crucial to older adults’ independence: going outside, getting around inside, getting in and out of bed, eating, bathing, using a toilet, and dressing. Older adults who have trouble with any of these activities are classified as having self-care or mobility limitations.
NHATS data show that older adults were increasingly able to meet their self-care and mobility needs with assistive devices, such as walkers and bath seats, between 2011 and 2020 (see Figure 1).
FIGURE 1
Nearly 40% of Older Adults Meet Their Self-Care and Mobility Needs With Devices
U.S. Adults Ages 70 and Older, Including Nursing Home Residents, 2011 to 2020

Source: Vicki A. Freedman, Jennifer C. Cornman, and Judith D. Kasper, “National Health and Aging Trends Study: Trends Dashboards,” 2021.
Older Americans are using the Internet to carry out a diverse array of tasks that can contribute to their independence. Along with emailing and texting at greater rates, older adults were nearly twice as likely in 2020 than in 2011 to go online to socialize, shop, pay bills, seek medical advice, or order medical supplies, according to the data.
Late-life disability is also declining, with falling rates of low physical capacity, poor vision, and poor hearing (see Figure 2).2
In addition, the share of adults ages 70 and older with dementia fell between 2011 and 2019. But not all groups experienced declines; for instance, dementia rates decreased for women but not men.
FIGURE 2
Smaller Percentage of Older Adults Experience Low Physical Capacity, Poor Vision, Poor Hearing, Dementia
U.S. Adults Ages 70 and Older, Excluding Nursing Home Residents, 2011 to 2019/2020

Source: Vicki A. Freedman, Jennifer C. Cornman, and Judith D. Kasper, “National Health and Aging Trends Study: Trends Dashboards,” 2021.
COVID Pandemic Sparks Abrupt Changes in Group Activities and Gatherings
The COVID-19 pandemic’s profound impact on the lives of many older Americans is reflected in 2020 NHATS data, which show a steep drop in activities such as visiting with friends, volunteering, participating in clubs, and attending religious services (see Figure 3).
However, older adults in 2020 were also less likely to report that a health or physical issue kept them from participating in an activity. This may be due in part to more activities moving online during the pandemic or to a shift in how older adults attribute their lack of participation, say Vicki A. Freedman of the University of Michigan, independent consultant Jennifer C. Cornman, and Judith D. Kasper of Johns Hopkins Bloomberg School of Public Health, the creators of the NHATS dashboards.
Over the last decade, non-Hispanic Black and Hispanic older adults were less likely to participate in valued activities than their non-Hispanic white counterparts, and they also saw sharper participation declines during the pandemic. From 2019 to 2020, while COVID swept the globe, activity participation rates dropped more than 20 percentage points for non-Hispanic Black and Hispanic older adults; for non-Hispanic white older adults, rates decreased by about 10 percentage points.
FIGURE 3
Older Adults Reduced Activity Participation in 2020, But Faced Fewer Health-Related Limitations
U.S. Adults Ages 70 and Older, Excluding Nursing Home Residents, 2011 to 2020

Source: Vicki A. Freedman, Jennifer C. Cornman, and Judith D. Kasper, “National Health and Aging Trends Study: Trends Dashboards,” 2021.
Home Modifications More Common, Smaller Share of Older Adults Live in Facilities
Modifications for bathing and using the toilet have become more common in older adults’ homes. Such modifications include seats or grab bars for the shower or tub and raised seats or grab bars for the toilet (see Figure 4). More than 70% of older adults have bathing modifications, while more than 50% have toilet-related modifications. But the share of older adults with mobility-related modifications in their homes—such as stair lifts and glide chairs—increased only slightly over the decade.
FIGURE 4
More Older Adults Have Home Modifications to Meet Needs
U.S. Adults Ages 70 and Older, Excluding Nursing Home Residents, 2011 to 2020

Source: Vicki A. Freedman, Jennifer C. Cornman, and Judith D. Kasper, “National Health and Aging Trends Study: Trends Dashboards,” 2021.
The percentage of adults ages 70 and older living in nursing homes and assisted living settings fell to about 7% in 2020, from about 11% in 2011 (see Figure 5). The share of older adults living in retirement communities and senior housing held steady, while the percentage living in traditional community settings increased from nearly 82% to more than 86%. NHATS data show the use of hospice care at the end of life has increased (through 2019).
FIGURE 5
Shrinking Percentage of Older Adults Live in Facilities
U.S. Adults Ages 70 and Older, Including Nursing Home Residents, 2011 to 2020

Source: Vicki A. Freedman, Jennifer C. Cornman, and Judith D. Kasper, “National Health and Aging Trends Study: Trends Dashboards,” 2021. [/end figure]
Older Black and Hispanic Adults Face Greater Challenges, Rely on Help More Often
NHATS dashboard users can explore a variety of measures for several racial and ethnic groups (see Figure 6). Dashboard creators Freedman, Cornman, and Kasper identified “concerning gaps” by race and Hispanic ethnicity. For instance, in 2020, compared with non-Hispanic white older adults, their non-Hispanic Black and Hispanic peers were:
- Less likely to successfully manage their self-care and mobility limitations with assistive devices (see Figure 6).
- Less likely to have bathing-related modifications in their homes.
- Less likely to communicate by email or text or to go online for social networking, household activities, and health-related activities.
- More likely to receive assistance with self-care, mobility, and household activities (such as doing laundry, grocery shopping, making hot meals, and paying bills) because of limitations related to health and functioning.
- More likely to experience unmet need related to self-care, mobility, and household activities.
- More likely to have low physical capacity, poor vision, and (in 2019) dementia.
FIGURE 6
Dashboard Shows Black and Hispanic Older Adults Less Likely to Meet Needs With Devices
U.S. Adults Ages 70 and Older, Excluding Nursing Home Residents, 2011-2020
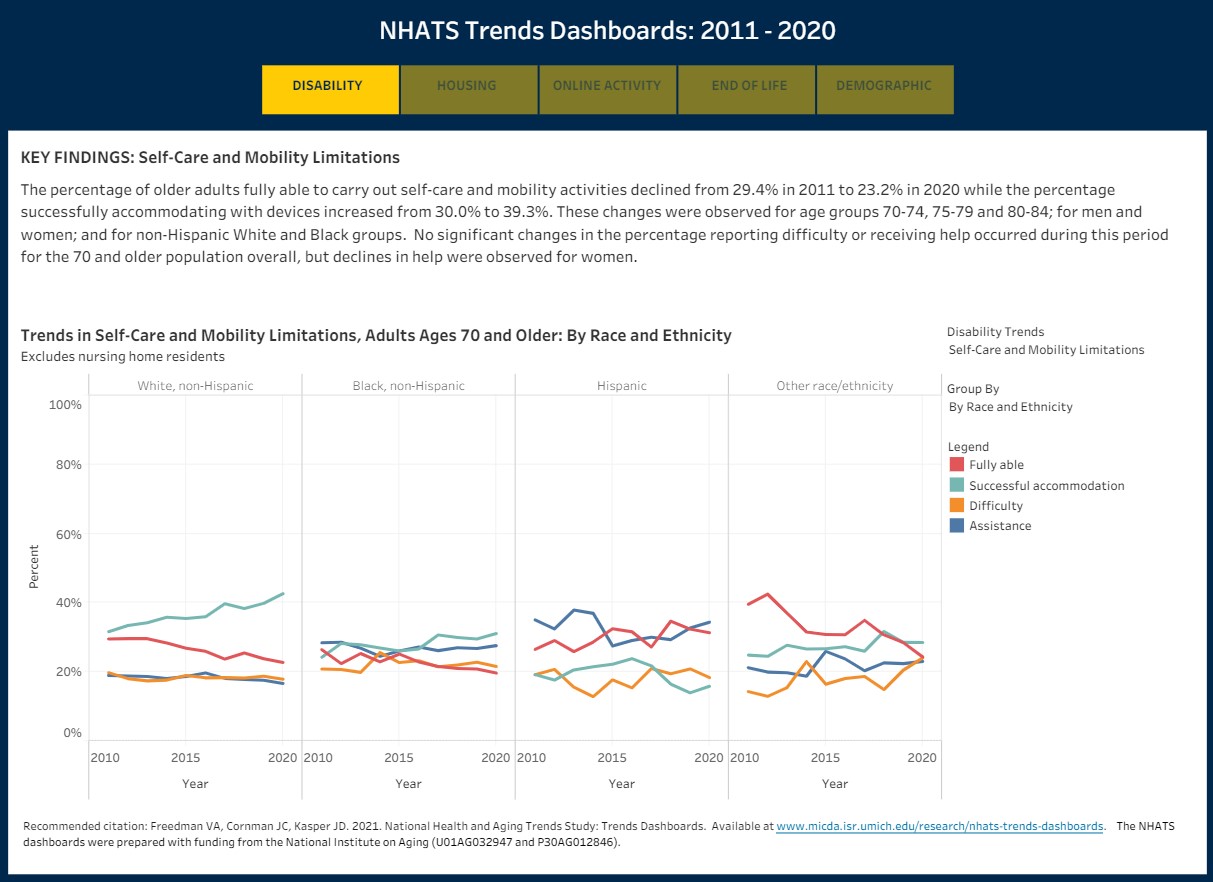
Source: Vicki A. Freedman, Jennifer C. Cornman, and Judith D. Kasper, “National Health and Aging Trends Study: Trends Dashboards,” 2021.
Since 2011, NHATS has tracked trends in late-life disability in a nationally representative sample of Medicare recipients to inform initiatives to improve function and well-being. The new interactive dashboards—to be updated annually—are designed to help policymakers, program planners, and business leaders understand how daily life is changing for the U.S. older population. The companion chart book includes key findings about recent trends, with an emphasis on differences by age group, gender, and race and Hispanic ethnicity groups. It also includes descriptions of measures and detailed data tables.
The NHATS dashboards and companion chart book were produced with support from the National Institute on Aging, grants U01AG032947 and P30AG012846.
1. Vicki A. Freedman, Jennifer C. Cornman, and Judith D. Kasper, “National Health and Aging Trends Study: Trends Dashboards,” 2021, https://micda.isr.umich.edu/research/nhats-trends-dashboards/.
2. Low physical capacity includes those who have significant difficulty with many upper and lower body functions, including the ability to walk 6 or 3 blocks; climb 20 or 10 stairs; carry 20 or 10 pounds; kneel or bend over; lift a heavy object or reach overhead; and open a sealed jar or grasp small objects. Poor vision includes those who report being blind and those who are unable, with glasses or contacts if used, to see well enough to recognize someone across the street, watch television across a room, or read newspaper print. Poor hearing includes those who report being deaf and those who are unable, with a hearing aid if used, to hear well enough to use a telephone or carry on a conversation in a quiet room.
Related Posts
Today’s Research on Aging 44: More Than a Feeling: How Social Connection Protects Health in Later Life
Older adults’ social ties are more important for physical and mental health than previously thought, new research shows.

PRB x TED: How Do We Respond to an Aging World?
As headlines announce fewer babies and more older people the data are clear: The world is undergoing a massive demographic shift. But is demography our destiny?