Appalachia’s Aging Population—More Residents Ages 65+, Fewer Ages 25 to 64—Signals Challenges Ahead

The Appalachian Region’s aging population may pose challenges “down the road” for local governments and community service providers, say the authors of a new Population Reference Bureau (PRB) report for the Appalachian Regional Commission. The Region’s share of residents ages 65 and older exceeds the national average, and Appalachia’s population in the prime working years (ages 25 to 64) declined between 2010 and 2016, while it grew nationally.
The Appalachian Region: A Data Overview From the 2012-2016 American Community Survey—coauthored by Kelvin Pollard, PRB senior demographer, and Linda A. Jacobsen, PRB vice president for U.S. Programs—examines trends and population characteristics at the regional, subregional, state, and county levels using recently released American Community Survey data and the Census Bureau’s latest population estimates.
The Region encompasses 205,000 square miles along the Appalachian Mountains from southern New York to northern Mississippi, including portions of 12 states and all of West Virginia.
An Aging Population Creates New Demands on the Region
The report shows that the share of residents ages 65 and older (17.6 percent) in the Appalachian Region exceeded the national average (15.2 percent) by two percentage points in 2016. Older persons made up at least 20 percent of the population in 157 of 420 Appalachian counties, almost three-fourths of which were rural counties outside metropolitan areas. In contrast, most of the 40 Appalachian counties with older population shares below the national average contain either metropolitan areas or colleges and universities.
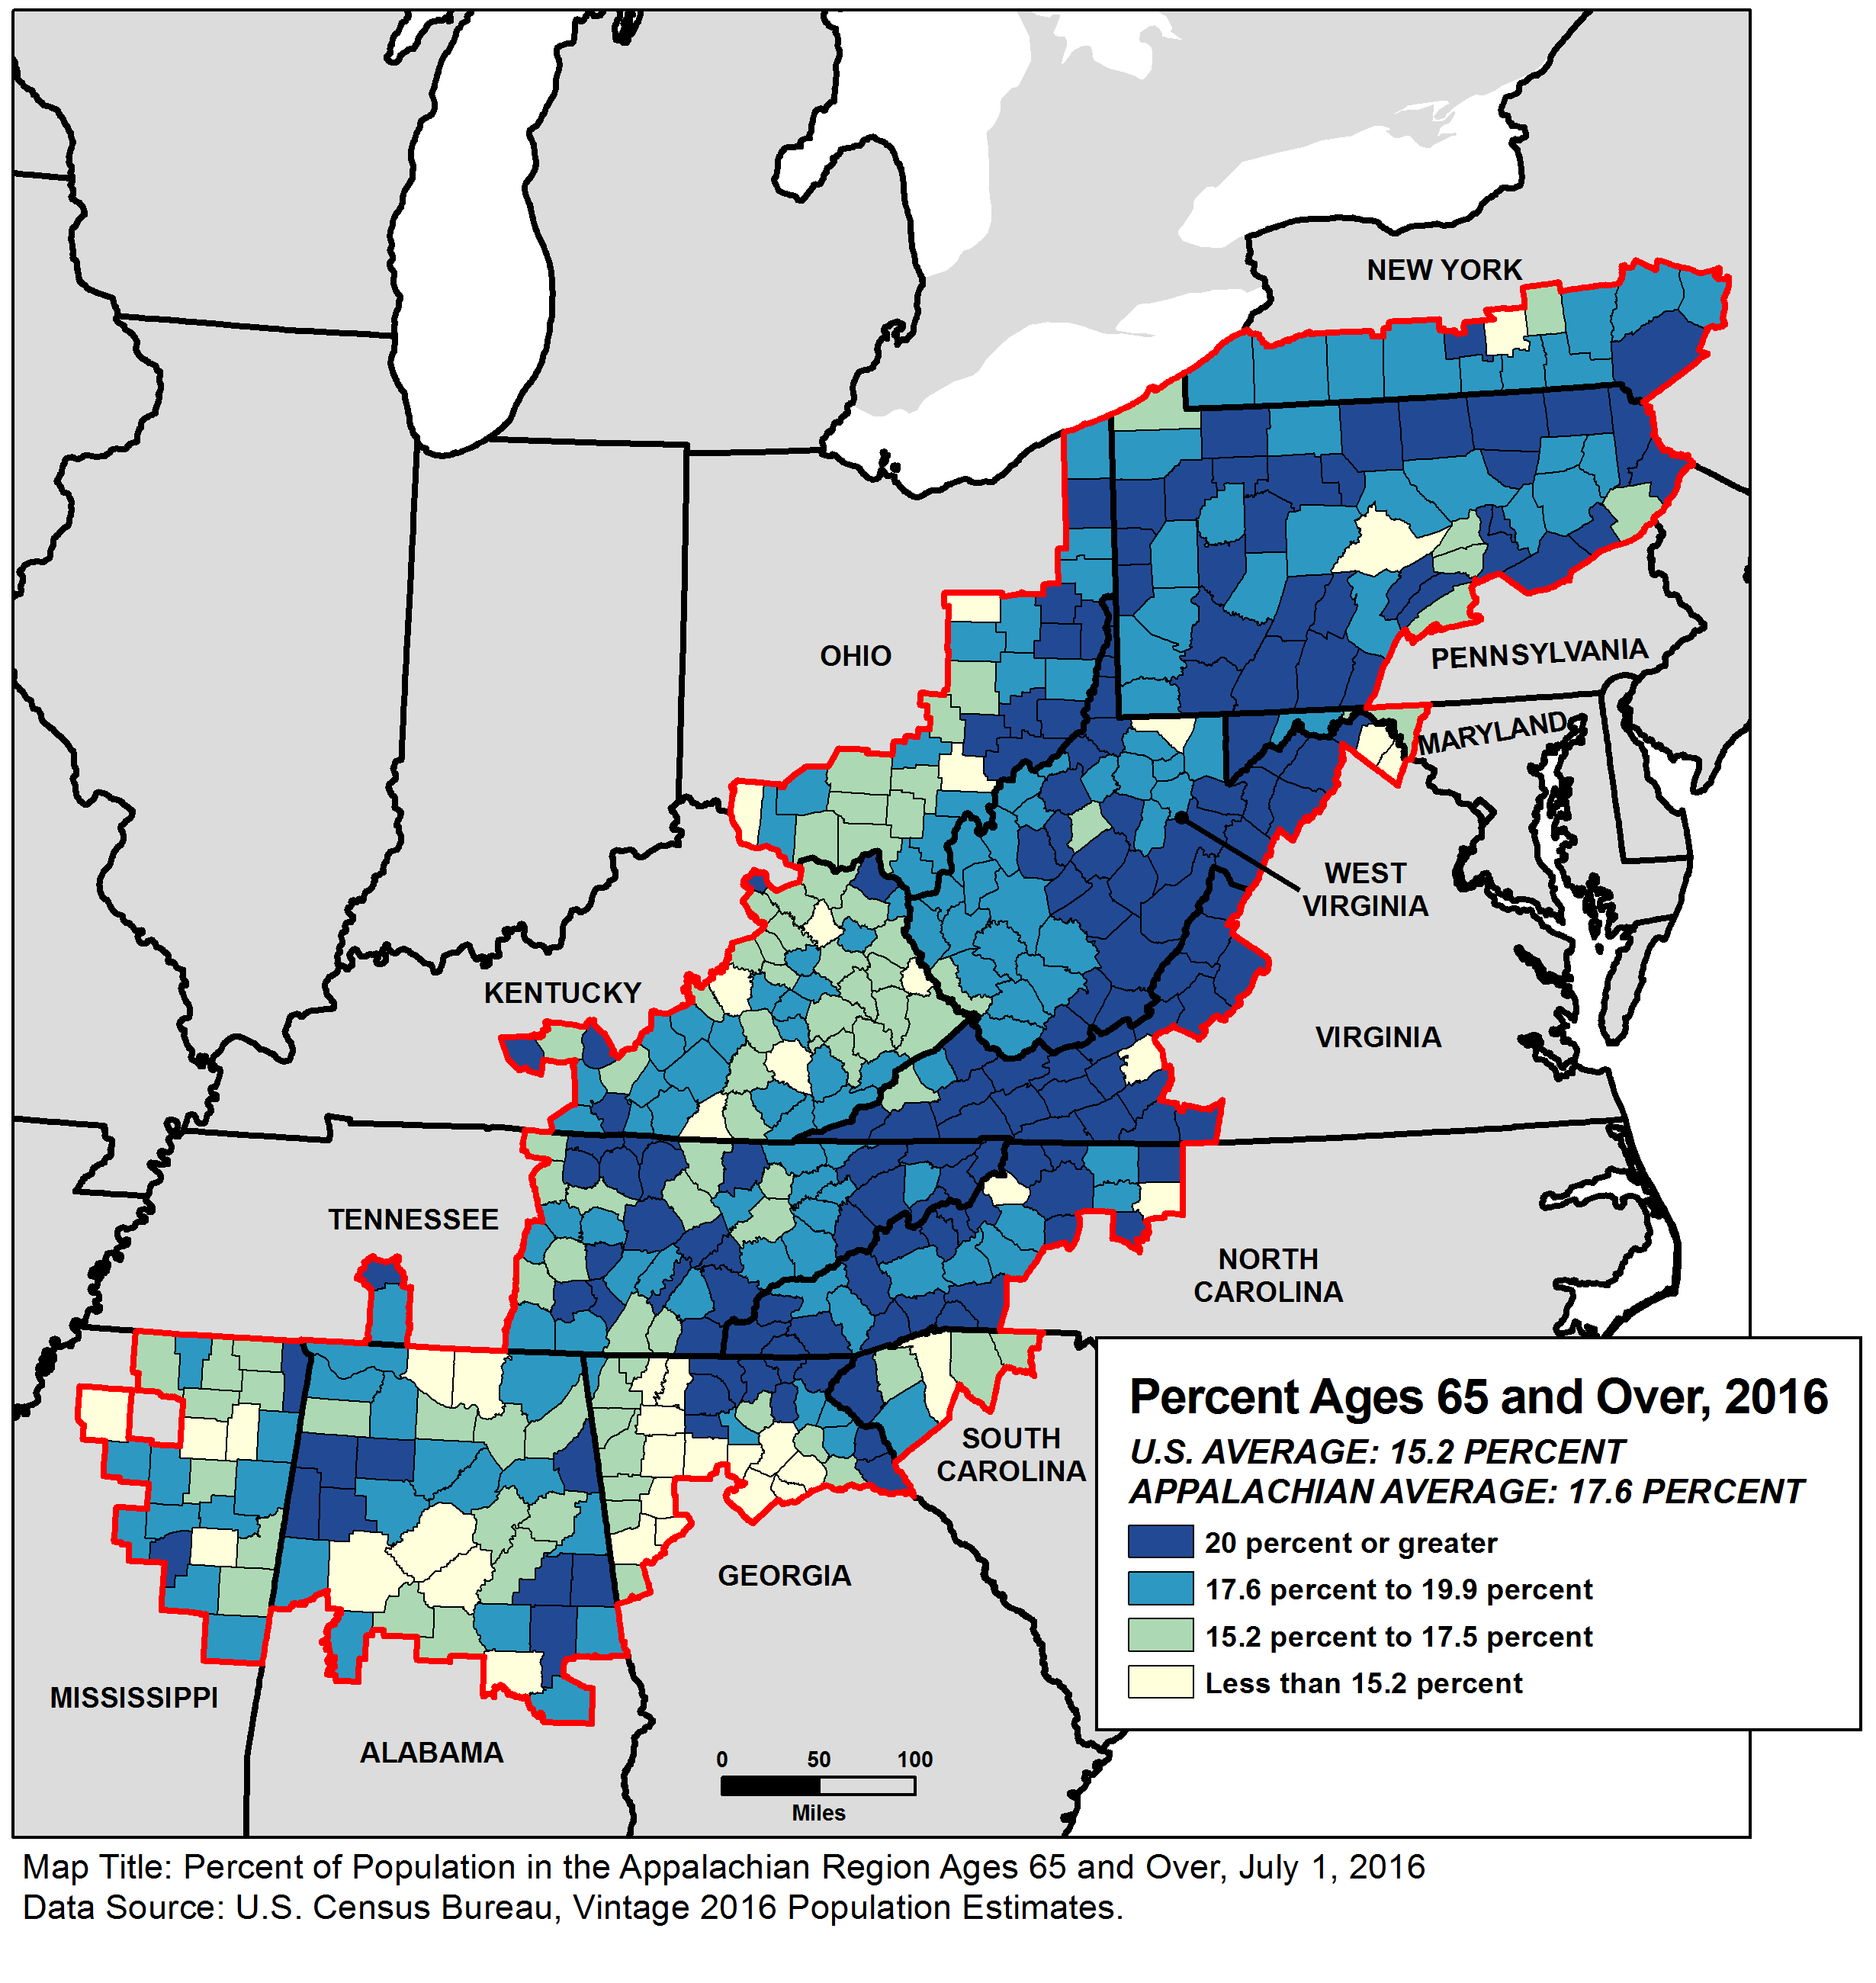
The authors point out that as the large baby boom generation ages, the share of residents ages 65 and older will continue to increase in both Appalachia and the nation. Yet while both the young adult (ages 18 to 24) and working-age populations have increased nationally since 2010, Appalachia has lost people in these age groups. For example, the Region had 13.2 million residents ages 25 to 64 in 2016, down 1 percent from six years earlier.
“The shifting age distribution of the Region’s population means that fewer workers are supporting a growing older population, which can have implications for the local tax base and the demand for community services for the elderly,” says Jacobsen. “In addition, adults in their prime working years are the economic engine of a community.”
Appalachia’s Education and Disability Levels Differ by Geographic Area
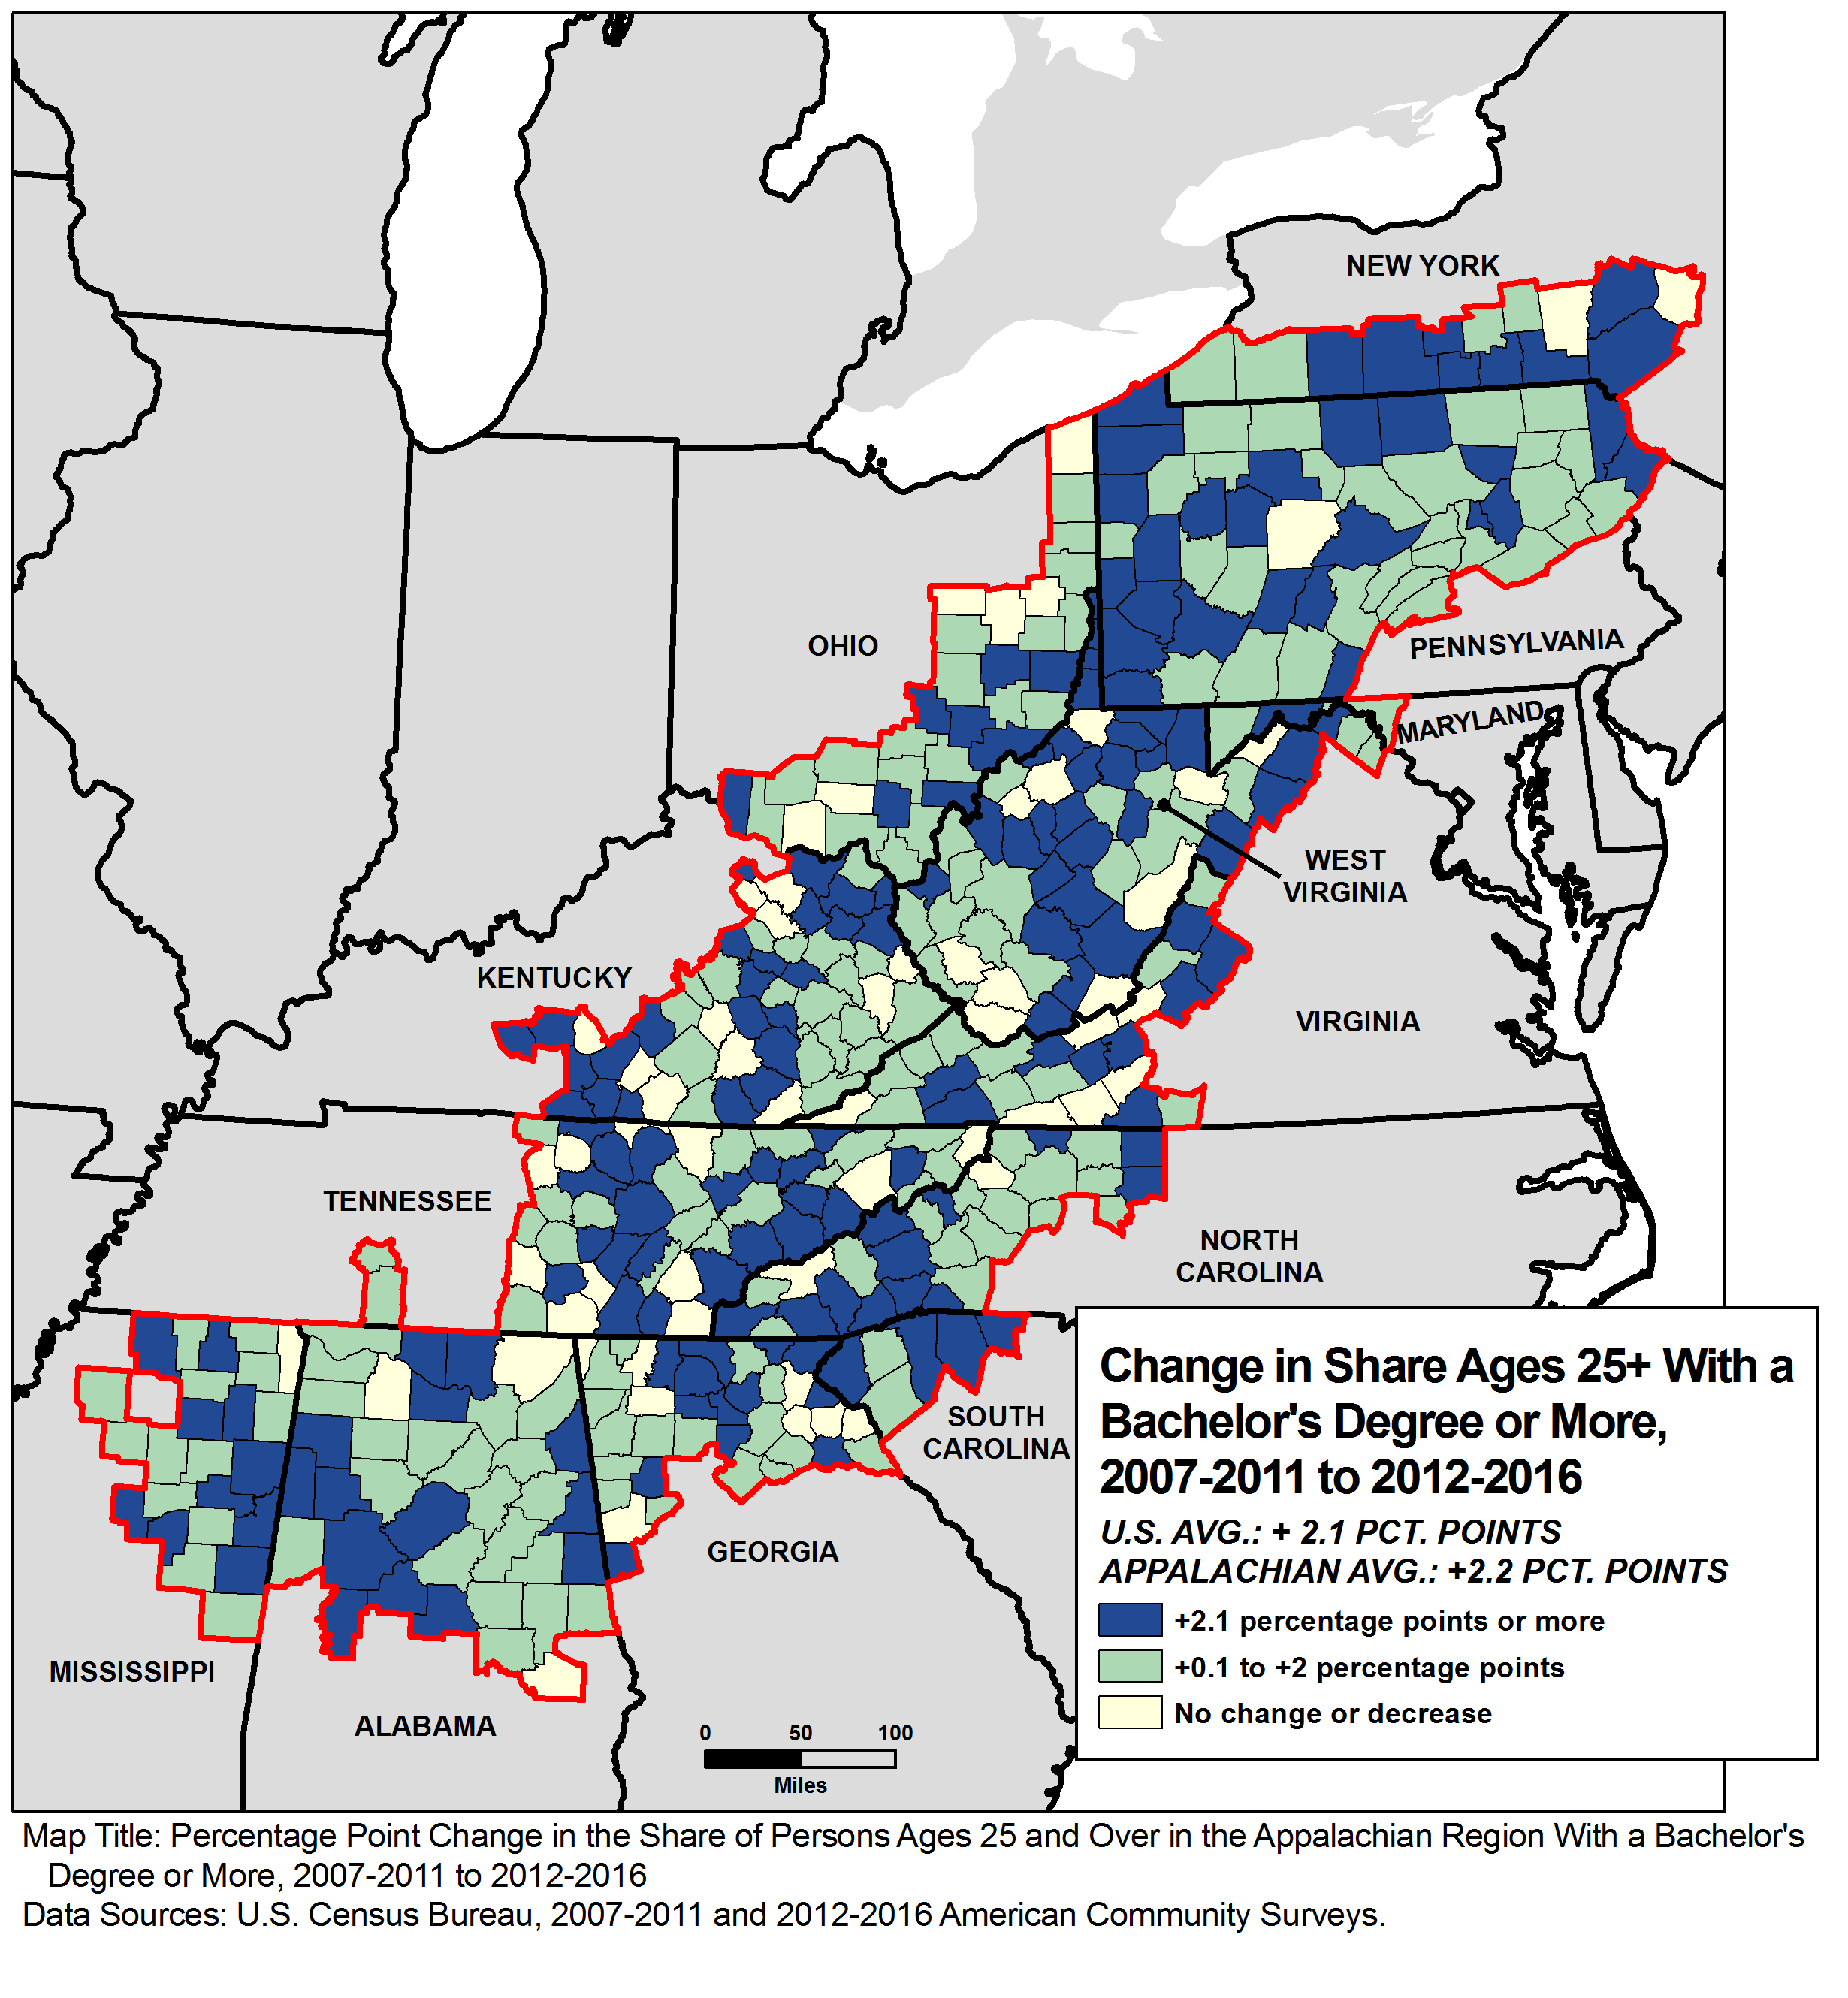
The report provides data on education and disability in the Region, key features of human capacity. It shows that while working-age adults in Appalachia are nearly as likely to have completed high school as Americans in general, they are significantly less likely to have completed at least four years of college.
Since 2007-2011, the share of Appalachia’s working-age population with a bachelor’s degree or more has risen nearly two percentage points to just under 25 percent in 2012-2016. Room for further improvement remains, however, as the Region’s current prevalence is seven percentage points lower than the U.S. average of 32 percent. The authors call this “a striking indicator of the lower educational level of the Appalachian workforce,” and also point to variation within the Region. For example, they note that while less than 18 percent of working-age adults in Appalachian counties lying outside of metropolitan areas had bachelor’s degrees, the share in counties that are part of large metropolitan areas of at least 1 million was 33 percent—above the national average.
Disability rates in the Appalachian Region are higher than the national average. In the 2012-2016 period, approximately one in seven adults ages 18 to 64 in Appalachia reported a disability, compared with about one in 10 nationally, the report shows. (The ACS only includes disability data for civilians living outside of nursing homes and other institutions; it defines persons with a disability as having difficulty in at least one of the following six areas: hearing, vision, cognition, walking or climbing, self-care, or attending to the functions of independent living.)
Some parts of the Region have particularly high disability rates. In Central Appalachia, for example, more than one-fifth of working-age adults had a disability. Central Appalachia had 56 of the 101 Appalachian counties where the disability rate among 18- to 64-year-olds was 20 percent or higher.
“Central Appalachia’s historic reliance on mining and related resource-based industries, as well as Appalachia’s relatively high rates of cancer, heart disease, and diabetes, may be associated with the subregion’s high disability prevalence,” Pollard suggests. He also notes that among the 61 Appalachian counties where at least half of persons ages 65 and older had a disability, two-thirds were in Central Appalachia.
Other Key Findings
- The Region’s overall population growth was just over 1 percent between 2010 and 2016, less than one-fourth the national average of 4.5 percent. Two out of three Appalachian counties lost population during this period.
- Although the share of the total population made up of minorities increased by almost two percentage points between 2010 and 2016, the Appalachian Region continues to be significantly less racially and ethnically diverse than the United States as a whole. In 2016, minorities comprised 18.2 percent of the Appalachian population—less than half the national average of 38.7 percent. Although African Americans make up the largest minority group in Appalachia, Hispanics have fueled much (if not most) of the minority increase.
- Homeownership rates in Appalachia fell nearly two percentage points between 2007-2011 and 2012-2016, but the decline was smaller than the national average. This drop likely reflects the continued effects of the 2007-2009 recession and the slow economic recovery that has followed, the authors suggest.
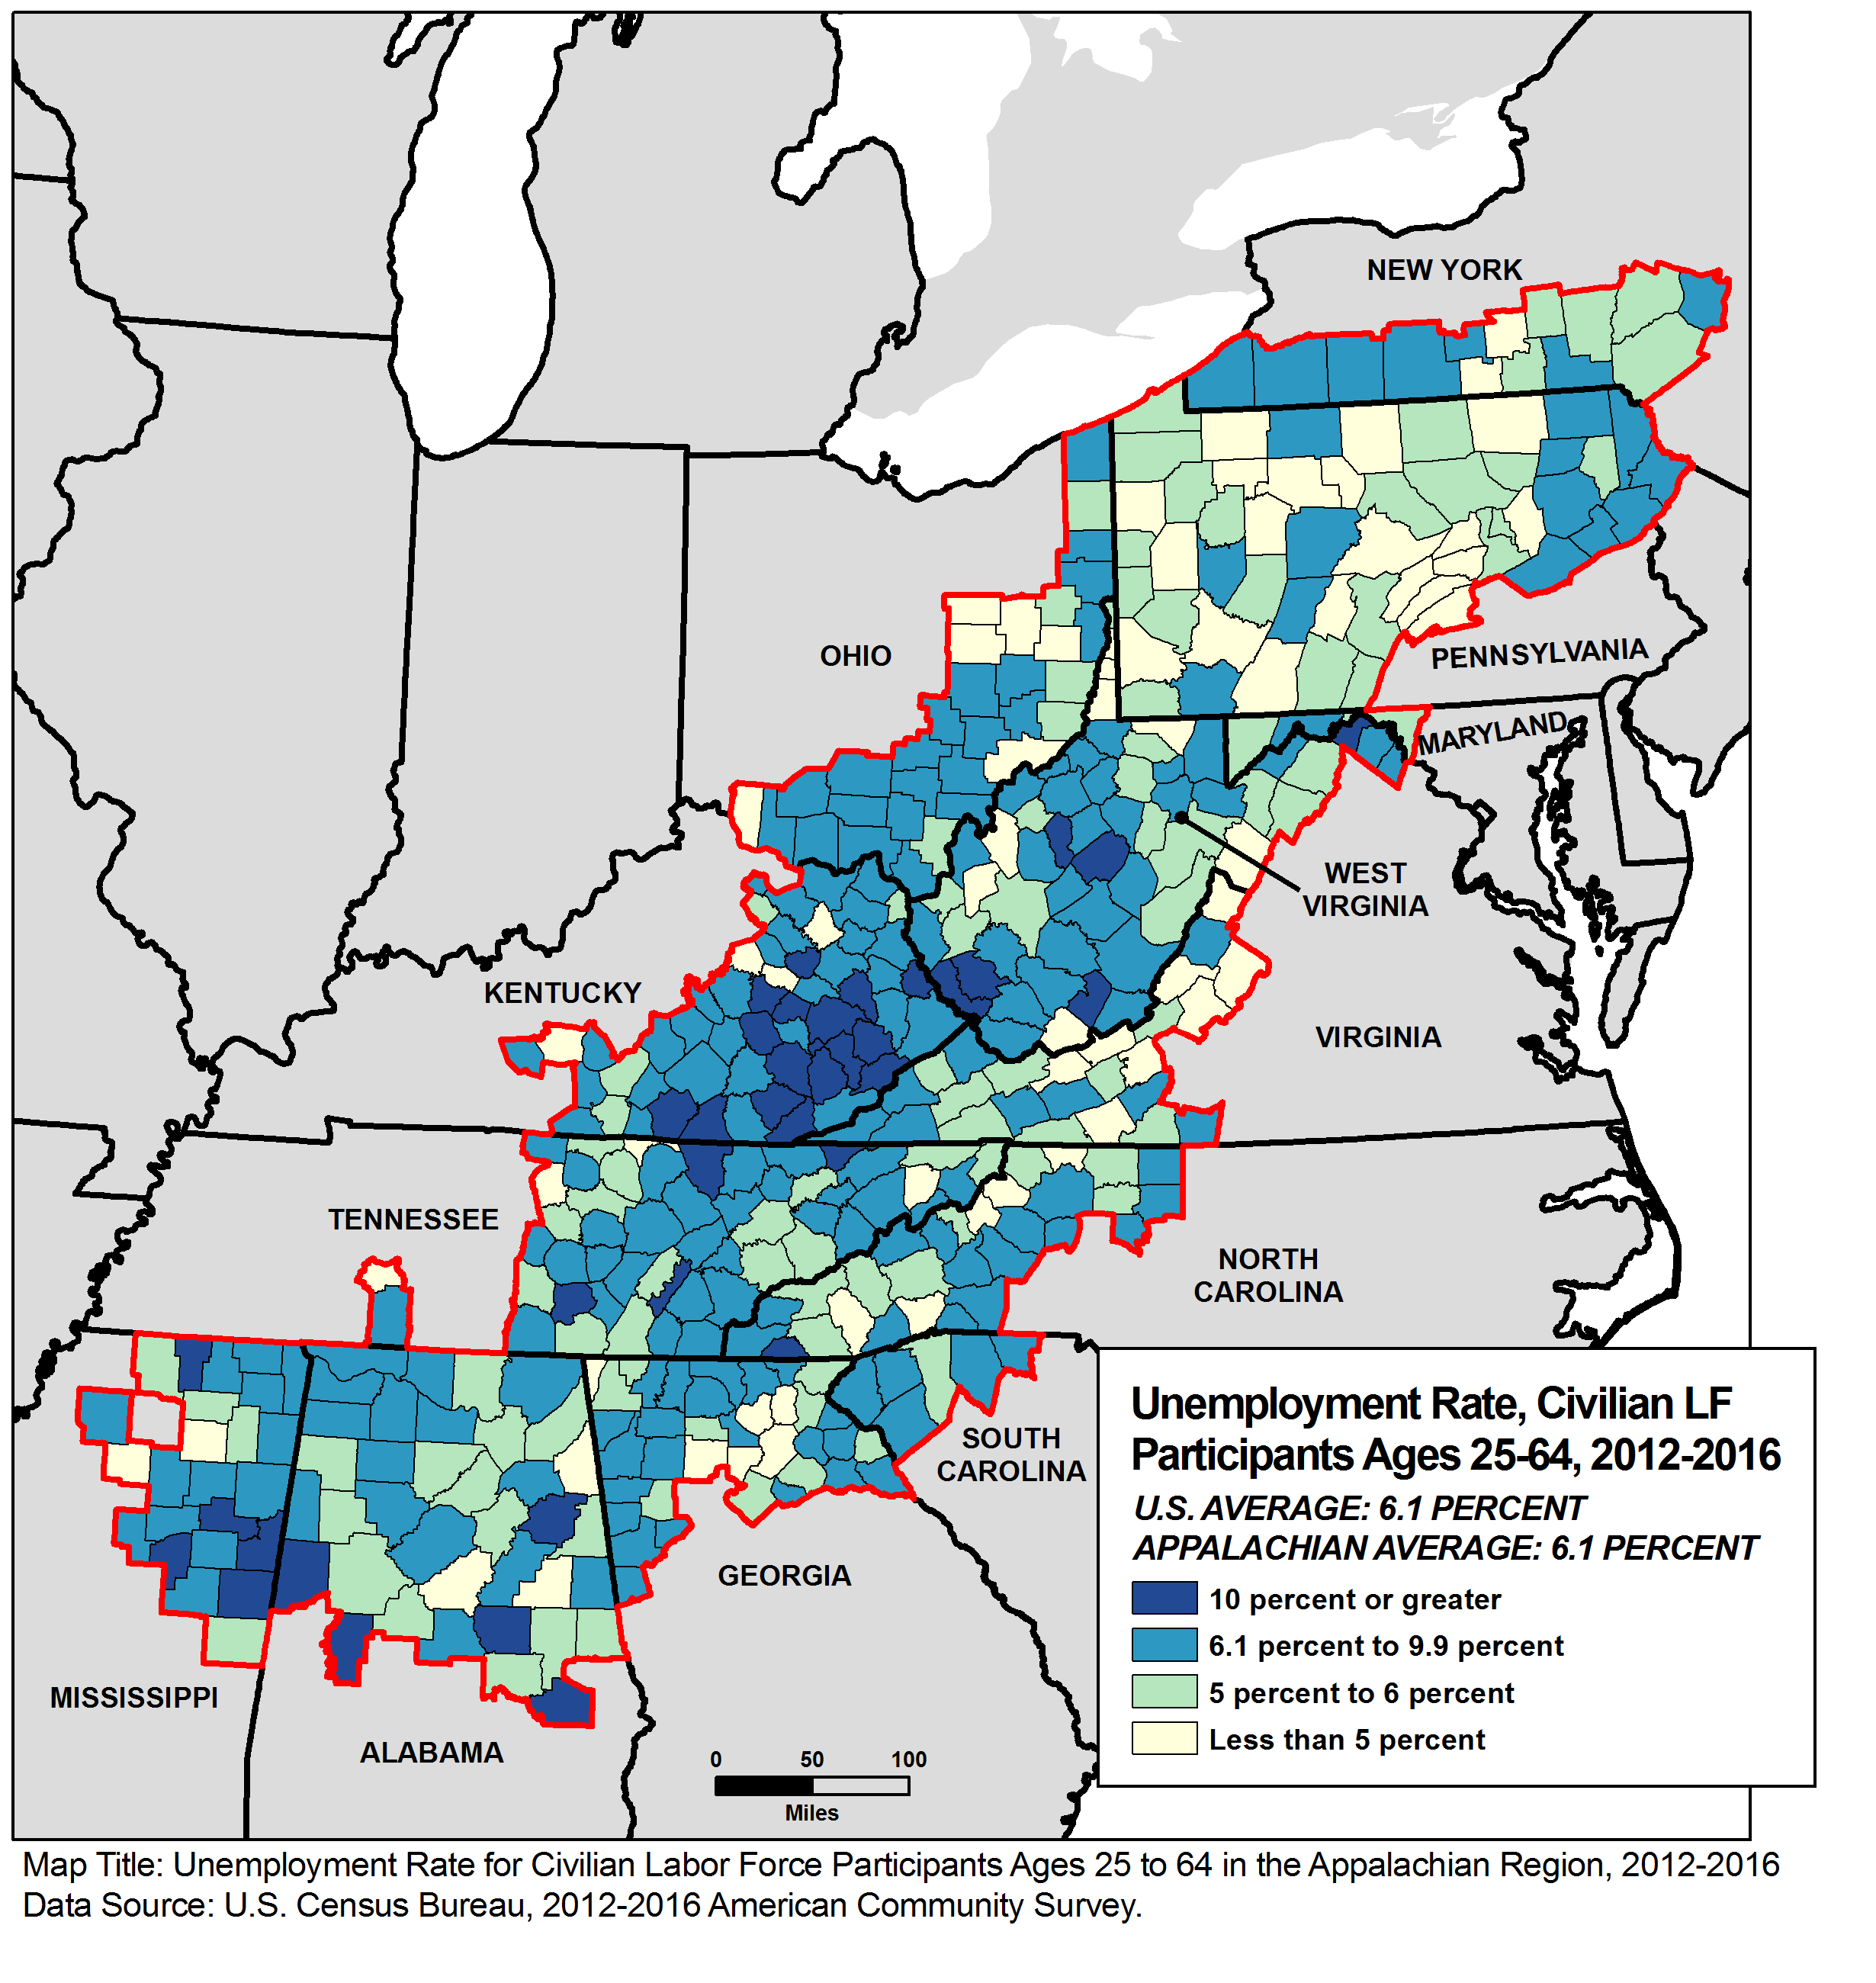
- At 6 percent, the unemployment rate in Appalachia matched the national average in 2012-2016—a full percentage point lower than it was in 2007-2011. Yet great variation existed within the Region: The jobless rate was less than 5 percent in 68 counties, but it reached 10 percent or higher in 37 others.
- About 32 percent of Appalachian workers ages 16 and older commuted to jobs outside their county of residence during 2012-2016, four percentage points above the share nationwide.
- In 2012-2016, median household income in Appalachia was more than $9,000 lower than the national median. In 75 counties, the median household income was less than $35,000. After adjusting for inflation, median household income declined less in Appalachia than in the nation as a whole between 2007-2011 and 2012-2016, and it increased in 192 counties scattered throughout the Region.
- The share of Appalachian residents who are low-income (between 100 percent and 199 percent of the poverty level) is two percentage points above the national average. For every age group under age 65, the share of Appalachian residents living below the poverty level exceeded the national average, with the highest rates in Central Appalachian and rural counties. In Central Appalachia one in four residents lived below the poverty line, including one in three children.
- Residents of all ages are less likely to be without health insurance in Appalachia than in the nation, but exceptions exist in several subregions and in rural counties. One in six young adults lacked health insurance in 2012-2016, but this share was 25 percent or more in 137 counties, concentrated in the Appalachian central, south central, and southern subregions. Lack of health insurance in young adulthood could contribute to the development of chronic conditions that might limit the ability to work and lead to disability later, Jacobsen notes.
The full report includes detailed tables and county-level maps, covering state- and county-level data on population, age, race and ethnicity, housing occupancy and tenure, housing type, education, labor force and commuting, employment and unemployment, income and poverty, health insurance coverage, disability status, migration patterns, and veteran status.
Related Posts
Webinar: Bridging Research and Policies: Enhancing Budgeting Processes for Africa's Demographic Dividend
PRB hosted a high-level webinar with budget experts, parliamentarians, and national directors to discuss the importance of the Demographic Dividend Sensitive Budgeting approach in enhancing budgeting processes across Africa.

Webinar: Where Is the Workforce? Understanding the U.S. Labor Shortage and Working Toward Solutions
PRB, the Critical Labor Coalition, and special guest former U.S.

American Community Survey Resources, Shortcuts, and Tools Workshop
Expert data users from PRB, the U.S.

Research Identifies New Strategies to Reduce Undercount of Young Children in U.S. 2020 Census
PRB identifies factors predicting where children under age 5 are more likely to be missed in the 2020 Census and develops a new undercount risk measure for young children.