Rogelio Saenz
Professor of Sociology, Texas A&M University

Population Bulletin Update: Latinos in the United States 2010 (Part 1 of 2)
December 14, 2010
Professor of Sociology, Texas A&M University
This Population Bulletin Update is a follow-up to 1997’s Population Bulletin, “Generations of Diversity: Latinos in the United States,” and provides new data and analysis on the U.S. Latino population and its diversity, socioeconomic status, and issues of identity.
(December 2010) Latinos are increasingly shaping the demographic makeup of the United States. While the U.S. population grew by 36 percent between 1980 and 2009, the Latino population more than tripled, increasing from 14.6 million to nearly 48.4 million.1 Latinos accounted for slightly more than 40 percent of the roughly 81 million people added to the U.S. population over the past 30 years. The influence of the Latino population will only grow in coming decades, and mostly through natural increase, not immigration.
The U.S. population grew by about 9 percent between 2000 and 2009, rising from 281 million to 307 million. The Latino population increased by 37 percent—four times more rapidly than the United States overall—and accounted for slightly more than half of the nearly 26 million people added to the U.S. population during this past decade. Today, Latinos make up almost one-sixth of the U.S. population.
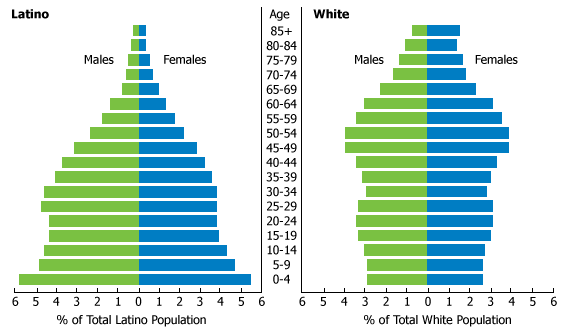
What accounts for the rapid growth of the Latino population? A variety of demographic factors, including high levels of immigration and a combination of high fertility alongside low mortality, partly explain the brisk growth. But the major underlying factor is the young age structure of the Latino population along with a rapidly aging white population. In 2009 the median age of Latinos was 27, compared with 41 among whites.
Figure 1 demonstrates the youthfulness of the Latino population and the aging of the white population. There are five times as many children under 15 years old than persons 65 and older among Latinos. In contrast, there are about an equal share of children and elderly in the white population. Thus, among Latinos there is a large portion of the population that is or will be in the childbearing ages—ages 15 to 44—and a large share who are young and therefore have lower mortality. Given that immigrants tend to be relatively young, they also contribute to the youthfulness of the Latino population.
Figure 1
Age-Sex Pyramids for Latinos and Whites in the United States, 2009

Source: 1% 2009 American Community Survey Sample.
At the national level, population change occurs through natural increase (births minus deaths) and net international migration. Latina women have on average three births each, one more compared with white, Asian or Pacific Islander, and black women.2 Furthermore, Latinos tend to live longer than whites.3
There is a major difference in the birth-to-death ratio between whites and Latinos. Between 2000 and 2009 there were approximately 9 million births and slightly over 1 million deaths among Latinos, while among whites there were about 21 million births and 18 million deaths.4 To put this in perspective, while there are 1.1 births to every one death among whites, there are 8.9 births to every one death among Latinos. This difference has major implications for the widening of the growth rates between Latinos and whites and other groups in the near future.
There were also significant differences in the level of net international migration—the balance between persons who leave the country and those who enter the country. From 2000 to 2009, there was a net increase of 4.8 million Latinos and 1.3 million whites.5 The net addition of immigrants during the period represented 13.5 percent of the Latino population present in 2000, but only 0.7 percent of the white population in 2000.
While Latinos are often viewed as immigrants, the majority (63 percent) of this population in 2009 was born in the United States.6 The newest groups of immigrants among Latinos have the highest percentages of foreign-born: South Americans (66 percent), Central Americans (65 percent), Cubans (59 percent), and Dominicans (57 percent). In contrast, virtually all—99 percent—of Puerto Ricans are U.S.-born.
In accounting for the growth of the Latino population between 2000 and 2009, it is estimated that natural increase (births minus deaths) accounted for 63 percent of the change while net international migration constituted 37 percent.7 Given that the volume of immigration from Mexico and Latin America has been on the decline in recent years, it is likely that natural increase will become a stronger component of Latino population change in the coming years.8 Even with waning immigration, the Latino population is expected to grow, although increasingly through natural increase (more births than deaths) resulting in a greater share of Latinos who are U.S.-born.
Latinos include diverse people who originate from Spanish-speaking countries in Latin America, the Caribbean, and Spain. The recent rapid growth of the Latino population should not overshadow the long history and presence of Latinos in the United States.
This is particularly the case among Mexicans who originally became part of the United States with the annexation of Texas in 1845 and the signing of the Treaty of Guadalupe Hidalgo in which Mexico ceded much of what is the U.S. Southwest today at the end of the war between the two countries in 1848. The names of cities throughout the Southwest along with the cuisine and architecture of the region evince the deep historical roots of Mexicans in the area. Similarly, Puerto Ricans became linked to the United States in 1898 with the signing of the Treaty of Paris at the end of the Spanish-American War and were granted U.S. citizenship in 1917.
Nonetheless, a significant share of the Latino population has immigrated to the United States only recently. This combination of deep historical ties with recent immigration results in great diversity within the Latino population on the basis of national origin, generational status, language, racial and ethnic identification, and socioeconomic status.
Mexicans are the largest segment of the Latino population in the United States, accounting for two-thirds of Latinos in 2009. The 10-largest segments of the Latino population include Mexican (31,689,879), Puerto Rican (4,426,738), Salvadoran (1,718,494), Cuban (1,696,141), Dominican (1,356,361), Guatemalan (1,081,858), Colombian (899,478), Honduran (631,510), Spaniard (613,211), and Ecuadorian (605,564). Together, the 10 groups represented 94 percent of all Latinos.
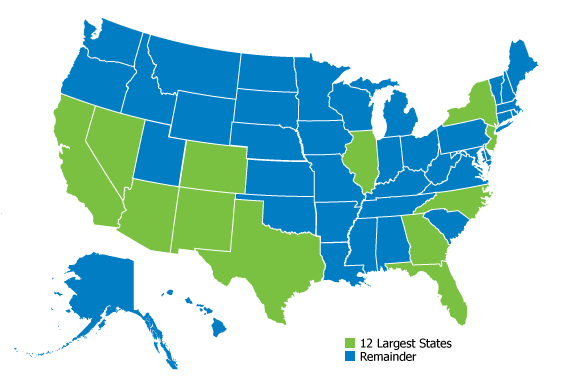
While there has been an increasing dispersion of the Latino population over the last few decades, the group is still clustered in particular areas of the country. For example, close to half (47 percent) of Latinos made their home in California and Texas in 2009. The dozen states with the most Latinos in 2009 are primarily located in the Southwest and South (see Figure 2). Over the last few decades, Georgia, Nevada, and North Carolina have emerged as primary destination areas for Latinos.
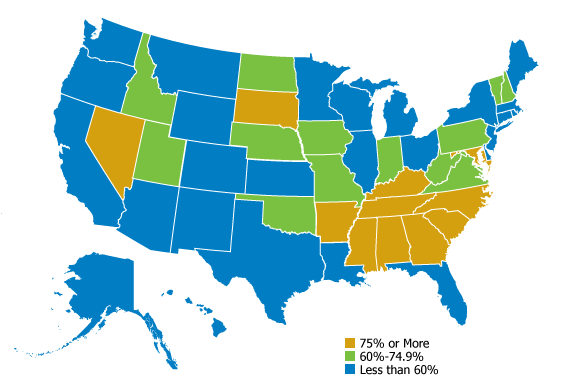
Indeed, the most rapid growth in the Latino population continues to be in areas designated as new destinations for Latinos. The fastest growth in the Latino population between 2000 and 2009 occurred in places located in the South, Midwest, and selected areas of the Northeast and West (see Figure 3).
Figure 2
Twelve States With the Most Latinos, 2009

Source: U.S. Census Bureau, 2009 American Community Survey 1-Year Estimates.
Figure 3
Percentage Change in the Latino Population, 2000-2009

Source: U.S. Census Bureau, 2009 American Community Survey 1-Year Estimates.
Next page: Social and Economic Well-Being and the Future for Latinos in the United States
Rogelio Saenz is professor of sociology at Texas A&M University.
