Mary Kent
Consultant

August 5, 2010
Consultant
When Ann Dunham, a white woman, married a black African student, Barack Obama Sr., in 1961, marriage between white and black Americans was rare. Less than 3 percent of all marriages were interracial in 1960, and the public generally disapproved of such unions. Interracial marriage was even illegal in at least 15 U.S. states. Although the U.S. Supreme Court ruled that laws prohibiting interracial marriages were unconstitutional in 1967, a reported 72 percent of southern white Americans and 42 percent of northern whites said they supported an outright ban on interracial relationships.1 Even by 1987, just 48 percent of Americans said it was “OK for whites and blacks to date each other.”2
In 2010, with Barack Obama Jr., in the White House, attitudes toward interracial dating and marriage are very different. Not surprisingly, this transformation is most evident among young people. As the education and income gaps between racial and ethnic groups shrank, so did the social distance between them. While racial discrimination is still evident, the boundaries separating the major ethnic and racial groups have become more porous.3
A recent survey found that young Americans ages 18 to 29 have nearly universal acceptance of interracial dating and marriage within their own families. Older Americans are not as tolerant: About 55 percent of those ages 50 to 64 and just 38 percent of those 65 or older said they would not mind if a family member married someone of another race.4
Most people appear willing to date outside their race, but they still state preferences. A recent study of profiles submitted to the online dating website Match.com showed, for example, that whites are more open to dating Hispanics and Asians than blacks are.5 And younger clients are more willing to date outside their race than older clients.
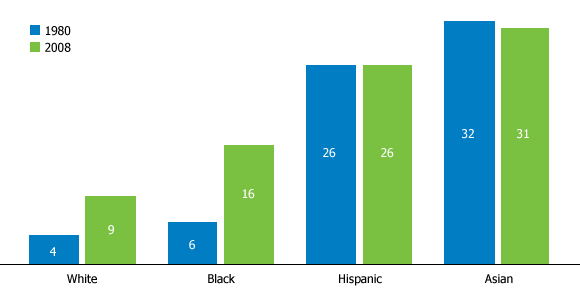
But most Americans marry someone of the same race. A recent report from the Pew Research Center found that one in seven new marriages in 2008 was either interracial or between a Hispanic and a non-Hispanic—unions encompassed by the term “intermarriages.” This is double the percentage of intermarriages in 1980, but still relatively low. And, as sociologist Dan Lichter points out, the biggest increase appears to be within minority groups. White Americans still mostly marry other whites.6 While 31 percent of Asians, 26 percent of Hispanics, and 16 percent of blacks “married out” in 2008, just 9 percent of whites did (see Figure 1).
Figure 1
Percentage Who Married Someone of a Different Race/Ethnicity, 1980 and 2010*

* Data represent the 12 months prior to the survey.
Source: Paul Taylor et al., Marrying Out: One-in-Seven Marriages Is Interracial or Interethnic (Washington, DC: Pew Research Center, 2010).
Interestingly, although younger people were more accepting of intermarriage, the Pew report found little difference in actual intermarriage rates by age—newlyweds age 50 or older were about as likely to marry out as younger newlyweds.
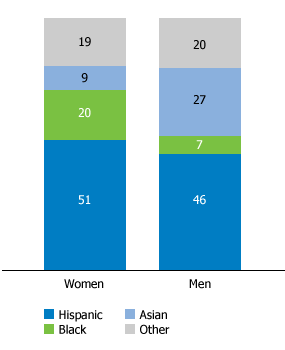
Only 11 percent of 2008 intermarriages were between black and white Americans, reflecting the persistent cultural resistance against relationships between these races. Most common were marriages between a white and a Hispanic (41 percent), followed by marriage between a white and an Asian American (15 percent).
Figure 2
White Men and Women Who “Married Out” in 2008 by Race/Ethnicity of Spouse

Note: “Other” includes American Indians, people identifying with more than one race, and “some other race.”
Source: Paul Taylor et al., Marrying Out: One-in-Seven Marriages Is Interracial or Interethnic (Washington, DC: Pew Research Center, 2010).
These 2008 marriages follow similar patterns by sex as interracial marriages of previous decades. For whites, men and women are about as likely to marry a Hispanic, but differ in their rates of marriage to blacks and Asians (see Figure 2).
In general, marriages between blacks and whites overwhelmingly involve a white wife and a black husband, just as the Dunham/Obama marriage did in 1961. Unions between Asians and whites are also very sex-selective, with most marriages occurring between white men and Asian women.
Although Asian men are much less likely to marry out than Asian women, they are much more likely than whites to intermarry. Twenty percent of Asian men married a non-Asian in 2008, compared with 40 percent of Asian women. Likewise, black women are much less likely to intermarry than black men. More than one-fifth of black men intermarried in 2008, while just 9 percent of black women did. There has been much speculation about why these gender preferences exist—reasons that delve into racial stereotypes and politics.7
Hispanic men and women are about as likely to marry outside their ethnic group, and they tend to marry non-Hispanic whites more than other groups.
The likelihood of choosing a marriage partner of another race or ethnic group is also influenced by the available pool of people of the appropriate age and with a similar educational background, because most people marry someone close in age and educational level. Researchers point out that people are more likely to marry outside their race/ethnicity when their pool of potential spouses of the same race/ethnicity is smaller, and vice versa. This partly explains why U.S. whites—long the racial majority—have the lowest intermarriage rates, followed by blacks. Both white and black Americans have plenty of potential partners within their own groups.
Asians, on the other hand, make up only about 4 percent of the U.S. population, which gives them fewer choices among other Asians. And they are the group most likely to marry out. Nearly 31 percent of Asians marrying in 2008 had a non-Asian spouse, about the same percentage as in 1980. Because of immigration from Asia in recent decades, Asians’ pool of potential spouses has been expanding, which researchers say has reduced the likelihood of intermarriage.
This demographic change has other effects: Foreign-born Asians are less likely to marry out than U.S.-born, and continued immigration has boosted the foreign-born share of Asians. For the same reasons, intermarriage by Hispanics has declined since 1980. About one-quarter of Hispanic men and women married non-Hispanics in 2008. But the Pew report already documented a recent uptick in intermarriage among Hispanics and Asians, as immigration has slowed and the proportion of Hispanics and Asians who were born in the United States has grown.
Will the more tolerant attitudes people express toward intermarriage be matched by actual intermarriage rates? There are many reasons to expect continued increases in intermarriage in coming decades. One prime reason is that the population is becoming increasingly diverse—culturally, ethnically, and racially. Americans reaching marriage age over the next two decades are probably the most racially diverse generation ever, and it will be surprising if they do not intermarry more often than previous generations. About 44 percent of the population under age 18 in 2009 was Hispanic, black, Asian, or another non-white group, compared with about 35 percent of the total U.S. population.8
In addition, more Americans have personal experience with intermarriages involving their families, friends, and work colleagues, which lends a normalcy to these unions. The Pew survey reported that one-third of respondents said they had a family member married to someone of another race or ethnic group. This percentage will only increase for Americans of all races and ethnic groups—especially as the children of these marriages grow up—further expanding the definition of “acceptable” dates and spouses, and likely accelerating the trend toward intermarriage.
