Rising Share of U.S. Children Living in High-Poverty Neighborhoods
(August 2012) Children growing up in high-poverty neighborhoods are at higher risk of health problems, teen pregnancy, dropping out of school, and other social and economic problems compared with children living in more-affluent communities. Many of these neighborhood-related risk factors persist even after taking into account family characteristics and may limit a child’s ability to make a successful transition to adulthood.1
More than 10 percent of U.S. children lived in a high-poverty neighborhood (poverty rates of 30 percent or more) between 2006 and 2010, reflecting a 25 percent increase since 2000, according to a new Population Reference Bureau analysis funded by the Annie E. Casey Foundation.
The share of children living in high-poverty neighborhoods grew from 8.7 percent in 2000 to 10.6 percent by 2010, putting more children at risk of negative outcomes (see table). The share of adults ages 18 and older living in high-poverty neighborhoods also increased from 7 percent to 9 percent during that time. There were more than 29 million people—including nearly 8 million children under age 18—living in high-poverty neighborhoods.
Children and Adults Living in High-Poverty Neighborhoods, 2000 and 2006-2010
| 2000 | 2006-2010 | |||
|---|---|---|---|---|
| Age Group | Number (thousands) | Percent | Number (thousands) | Percent |
| All Ages | 21,161 | 7.5 | 29,071 | 9.6 |
| Children Under Age 18 | 6,301 | 8.7 | 7,879 | 10.6 |
| Adults Ages 18 and Older | 14,860 | 7.1 | 21,192 | 9.2 |
Notes: High-poverty neighborhoods have poverty rates of 30 percent or more. Estimates are subject to both sampling and nonsampling error.
Source: PRB analysis of 2000 U.S. Census and 2006-2010 American Community Survey data.
The population increase in high-poverty neighborhoods since 2000 is not just limited to communities with poverty rates of 30 percent or more. There were also more people residing in neighborhoods with poverty rates that exceeded 40 percent. And the share of children living in these “extreme-poverty” neighborhoods increased from 3.2 percent to 3.5 percent.
Racial and Ethnic Differences
Given the high levels of residential segregation in the United States, it is perhaps not surprising that minority children constitute the overwhelming majority of children living in high-poverty neighborhoods. African American and Latino children together accounted for 37 percent of the total population under age 18, but they made up 76 percent of the child population living in high-poverty neighborhoods.
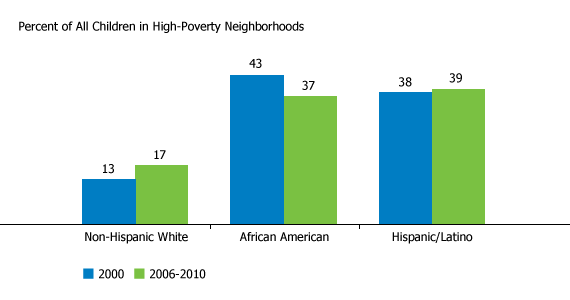
However, the racial/ethnic composition of high-poverty neighborhoods has shifted somewhat since 2000. Non-Hispanic whites, who made up 13 percent of the population under age 18 in high-poverty neighborhoods in 2000, accounted for 17 percent of the child population in such neighborhoods between 2006 and 2010 (see figure). This increase occurred despite the declining share of non-Hispanic white children in the total U.S. population during this period, from 61 percent to 55 percent. Since 2000, the share of children in high-poverty neighborhoods who are African American has dropped sharply, from 43 percent to 37 percent, while the share of Latino children has increased slightly, from 38 percent to 39 percent, so that Latino children now outnumber black children in America’s high-poverty neighborhoods.
Distribution of Children in High-Poverty Neighborhoods

Source: PRB analysis of 2000 U.S. Census and 2006-2010 American Community Survey data.
Among all children in the United States, black children are still much more likely to live in high-poverty neighborhoods (27 percent), compared with Latino children (19 percent) or white children (3 percent). These differences reflect the relative size of these racial and ethnic groups within the population: Although blacks make up a relatively small share of the total population, they are more heavily concentrated in high-poverty neighborhoods than whites or Latinos.
Geographic Patterns
Arizona, Louisiana, Mississippi, New Mexico, New York, and Texas had the highest shares of children living in high-poverty neighborhoods, with more than 15 percent each. In terms of absolute numbers, California and Texas had the most children in high-poverty neighborhoods (more than 1 million each), followed by New York (670,000). Together, California, New York, and Texas accounted for more than one-third of all children living in high-poverty neighborhoods in the 2006 to 2010 period.
The proportions of children in high-poverty neighborhoods declined in eight states since 2000: California, Louisiana, Maryland, Montana, New Mexico, New York, Rhode Island, and Wyoming. The District of Columbia also experienced a 7 percentage-point drop since 2000. In seven states, the share of children in high-poverty neighborhoods increased by 5 percentage points or more: Colorado, Indiana, Michigan, North Carolina, Oklahoma, Tennessee, and South Carolina.
The recent economic and housing crises have created new challenges for low-income families and for the organizations that provide support to them. Many parents in high-poverty neighborhoods don’t have the resources to move away. Persistent long-term unemployment and the rise in unemployment have contributed to the lowest geographic mobility rates since the 1960s. The housing bust has also made it difficult for many homeowners to sell their homes and relocate in search of better opportunities.
For more information, and for strategies to improve the lives of children in high-poverty areas, see the Annie E. Casey Foundation’s Data Snapshot on children living in high-poverty neighborhoods.
Mark Mather is associate vice president for Domestic Programs at the Population Reference Bureau. Genevieve Dupuis is a research associate in Domestic Programs at PRB.
References
- National Research Council and Institute of Medicine, From Neurons to Neighborhoods: The Science of Early Childhood Development, ed. Jack P. Shonkoff and Deborah A. Phillips (Washington, DC: National Academy Press, 2000); and Jeanne Brooks-Gunn et al., “Do Neighborhoods Influence Child and Adolescent Behavior?” American Journal of Sociology 99, no. 2 (1994): 335-95.
