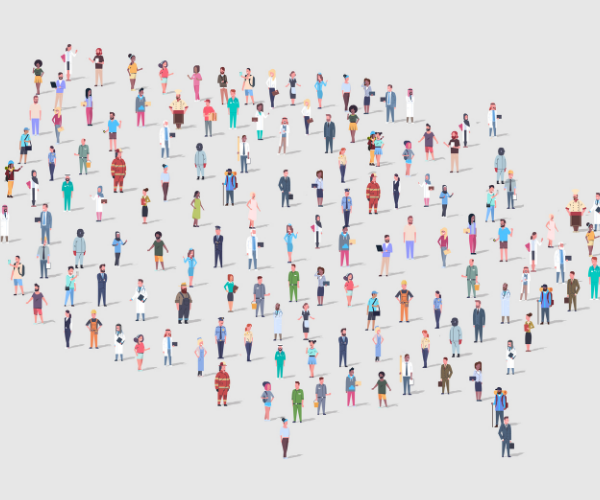
Shifting Latino Ethnic and Racial Identity
(December 2010) Over the past several decades, the U.S. Census Bureau has used variations in its attempt to classify and enumerate Latinos. The 1930 Census was the first time that the bureau attempted to identify and count Latinos specifically. At that time, at the height of the mass movement of Mexicans to the United States in the period surrounding the Mexican Revolution and the Great Depression, the bureau designated “Mexican” as a racial category. Approximately 1.4 million people were enumerated as Mexican during the 1930 Census.1 Most Mexicans lived in Texas (683,681) or California (368,013). With the onset of the Depression, between 400,000 and 500,000 persons of Mexican origin were repatriated to Mexico.2
As the Latino population increased and with the advent of the Civil Rights era, efforts were made to provide a label to Latinos as a way to facilitate their enumeration. Prior to the 1970 census, the labels of “persons of Spanish surname” or “persons of Spanish language” were used to count the population based on the region of the United States. As the 1970 Census neared, the U.S. Interagency Committee on Mexican American Affairs pressured President Nixon to include an item on the census to count Latinos.3 Although the request came too late for the Hispanic item to be included in the short-form questionnaire, it was included in the 5 percent sample long-form questionnaire.
Seven years later, on May 12, 1977, the Office of Management and Budget (OMB) ordered that there would be two ethnic categories for data collection purposes: Hispanic and non-Hispanic.4 According to the OMB, Hispanics included people from Mexican, Puerto Rican, Cuban, Central or South American, or other Spanish culture or origin.5 While the term “Hispanic” became official, there was much debate within the Hispanic and Latino community over the proper term to identify this population. Opponents of the Hispanic term claimed that the term emphasized the Spanish element while neglecting the group’s indigenous roots centered in Latin America. Opponents of the Latino term declared that the term ignores the Spanish roots and excludes people originating from Spain. Today both terms are accepted even though there is often an underlying tension. Nonetheless, a Pew Hispanic Center survey conducted in 2008 indicated that while 43 percent of respondents did not have a preference concerning the two terms, 36 percent preferred the Hispanic identity while 21 percent opted for the Latino label.6
Since Hispanics or Latinos are considered an ethnic and not a racial group, they are asked on census questionnaires to select a racial category. In the 2000 Census, almost half (48 percent) of Latinos classified themselves racially as “white” while more than two-fifths (43 percent) identified themselves racially as “Other.”7 The significance of the high percentage that claims that they identify with the “Other” racial category—rather than the “white” classification—is not completely understood. Possibilities include that such persons view Hispanic or Latino as a racial category and do not locate it among the list of choices, while others may use the term as a rejection of white racial identification, and others may be confused about the racial categories.
The Census Bureau has attempted to provide greater clarification in the annual American Community Survey (ACS) and in the 2010 Census in its attempt to move people away from the “Other” racial designation. The questionnaire emphasizes that “Hispanic origins are not races.” In addition, the layout of racial categories is different from the 2000 Census questionnaire.
Such changes in the census questionnaire appear to have changed the way Latinos identify themselves racially. For example, the percentage of Latinos selecting the white racial category increased from 48 percent in the 2000 Census to 63 percent in the 2009 ACS.8 In contrast, the percentage of Latinos preferring the “Other” racial category dropped from 43 percent to 29 percent. This trend is consistent across Latino subgroups. Cubans have the strongest preference for the white racial category (88 percent). Dominicans have the weakest preference for this racial category (35 percent), opting instead for the “Other” racial category (49 percent).
Rogelio Saenz is professor of sociology at Texas A&M University.
References
- Campbell Gibson and Kay Jung, “Historical Census Statistics on Population Totals by Race, 1790 to 1970, and By Hispanic Origin, 1790 to 1990, For the United States, Regions, Divisions, and States,” Working Paper Series 56, accessed at www.census.gov/population/www/documentation/twps0056/tabE-07.pdf, on Nov. 28, 2010.
- Robert R. McKay, “Mexican Americans and Repatriation,” The Handbook of Texas Online, accessed at www.tshaonline.org/handbook/online/articles/pqmyk, on Nov. 28, 2010.
- Harvey M. Choldin, “Statistics and Politics: The ‘Hispanic Issue’ in the 1980 Census,” Demography 23, no. 3 (1986): 403-18.
- C. Matthew Snipp, “Racial Measurement in the American Census: Past Practices and Implications for the Future,” Annual Review of Sociology 29 (2003): 563-88.
- Office of Management and Budget, Directive No. 15, Race and Ethnic Standards for Federal Statistics and Administration Reporting (Washington, DC: Office of Management and Budget, 1977).
- Jeffrey Passel and Paul Taylor, Who’s Hispanic, accessed at http://pewhispanic.org/files/reports/111.pdf, on Nov. 28, 2010.
- Rogelio Saenz, Latinos and the Changing Face of America (New York: Russell Sage Foundation; Washington, DC: Population Reference Bureau, 2004).
- Saenz, Latinos and the Changing Face of America; and author’s estimates using the 2009 1% American Community Survey.
Related Posts
Five Things You Can Do to Protect Public Data
Even small actions, taken together, can help strengthen the case for the importance of public data to our shared future.
Census Issues, Impact of Dobbs Decision, and Population Aging Among Highlights of 2024 Population Association of America Conference
PRB staff offer summaries of new research and insightful sessions at the annual demography meeting.

How Accurate Was the 2020 Census—and Why Should You Care?
Significant undercounts in the 2020 Census could have serious consequences for underrepresented groups and individual states.
How Will We Measure the Accuracy of the 2020 Census?
Getting an accurate 2020 Census count is important because census numbers impact daily life in the United States in many ways.

Why Are They Asking That? What Everyone Needs to Know About 2020 Census Questions
By law, the U.S. government is required to count the number of people living in the United States every 10 years.