State-by-State Costs of Child Poverty in the U.S.
Research has shown that growing up in poverty leads to negative health, social, and economic consequences for children that often continue in adulthood. Compared with other children, children living below the poverty line are less healthy, have lower educational achievement, and are more likely to become involved with the criminal justice system. As adults, they are less likely to attend college or hold a steady job.
In 2006, an estimated 13.3 million U.S. children were living in poverty, and at risk for such lifelong problems. But the individual hardships brought by poverty also exact a staggering financial toll on broader society. One recent estimate has suggested that growing up in poverty costs the United States $500 billion annually in lost potential earnings, involvement with the criminal justice system, and the costs associated with poor health outcomes.1
Taking its cue from that cost estimate, as well as campaigns in some states designed to reduce poverty, the KIDS COUNT project in Washington state (affiliated with the University of Washington’s Human Services Poverty Center) has produced state-level estimates of the costs of child poverty. By taking the national estimate of child poverty costs and applying it to the estimated the number of poor children in each state in the 2006 American Community Survey, the study estimates the amount that each state would save annually if child poverty were eliminated.
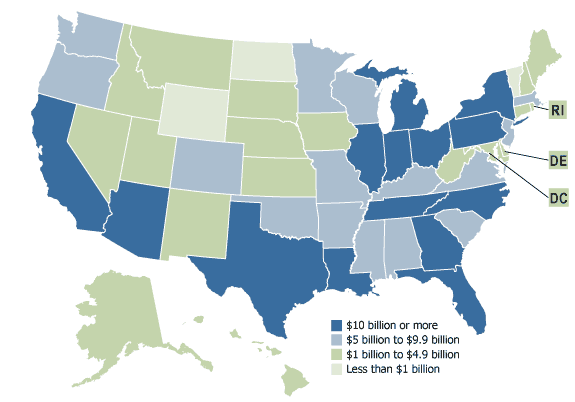
In 14 states, child poverty yielded an annual cost of more than $10 billion, according to the fact sheet issued by Washington KIDS COUNT. Not surprisingly, the most populous states tended to have the highest annual costs (see map)—mainly because they tend to have the largest numbers of children in poverty. California, with an estimated 1.7 million poor children in 2006, had the highest cost of $63.9 billion, followed by Texas at $57.5 billion and New York at $33.4 billion. Even in the smallest state, Wyoming, growing up poor yields an annual cost of about $500 million.
State Costs of Growing Up Poor in the U.S.

Source: Lori Pfingst, “The Cost of Child Poverty State by State.”
While the largest states tended to have the highest costs, child poverty rates also mattered. For example, Maryland’s child population in 2006 was significantly larger than Mississippi’s (1.4 million to 759,000). However, Maryland had a child poverty rate of 10 percent in 2006—one-third Mississippi’s 30 percent rate. As a result, Maryland had fewer children in poverty than Mississippi (130,000 to 220,000), and thus a lower annual poverty cost ($4.9 billion to $8.3 billion).2
The fact sheet was designed to assist anti-poverty efforts. Lori Pfingst, assistant director of Washington KIDS COUNT and author of the fact sheet, writes that such campaigns “should be viewed as a social investment that generates billions of dollars in returns to society in the form of increased economic productivity, reduced expenditures on health care and the criminal justice system, and improvements to multiple dimensions of children’s well-being.”3
References
- Harry J. Holzer et al., “The Economic Costs of Poverty in the United States: Subsequent Effects of Children Growing Up Poor,” National Poverty Center Working Paper Series #07-04 (January 2007), accessed online at http://npc.umich.edu/publications/u/working_paper07-04.pdf, on April 25, 2008.
- The number of children in poverty is based on the number of children in the poverty universe, which does not include persons living in group quarters (such as dormitories or detention centers) or for unrelated individuals under age 15 (such as foster children).
- Lori Pfingst, “The Cost of Child Poverty State by State,” fact sheet from Washington KIDS COUNT, available from the author at pfingst@u.washington.edu.
