
The Degree of Certainty in Population Projections
(April 2007) How much confidence can be placed in projections of what the size of the population will be in 10, 25, 50, or 75 years? The certainty of these projections is of keen interest to a wide range of analysts, including government policymakers and planners who rely on them to guide their decisions.
For example, each year the Social Security and Medicare Board of Trustees reports on the financial outlook of these programs, examining the funds’ solvency over the next 75 years. Their findings are based in part on an assessment of the demographic challenges facing the nation.
Trustee findings have far-reaching consequences that often are the rationale behind proposals for Congress and the White House to increase payroll taxes or to reduce benefits. Also, the law requires the Trustees to issue a warning of low funding levels when Medicare spending is projected to exceed planned revenues substantially for a number of years.1 This leads to the question: How certain are the population projections on which the financial forecasts are based?
Different Methods to Estimate Uncertainty
All population projections include some uncertainty, and there are several techniques for establishing the degree of uncertainty.2 Technical advisers to the Social Security Trustees have recommended that statistical methods be used to determine upper and lower bounds of the population projections and the likelihood that the population size will actually fall within this range.
As of their 2007 report (released in April), the Trustees have not employed statistical methods to project the population, but instead used scenarios that incorporate a series of assumptions about how high or low fertility, mortality, and migration rates could go. The Trustees also make assumptions about economic factors such as inflation and unemployment that could influence the size of the labor force. These assumptions about the population and the national economy are the basis for scenarios that lead to forecasts of Social Security revenue and costs.
The Trustees report three long-range forecasts: low, intermediate, and high costs. Each is based on a different set of assumptions. The low cost, long-range forecast assumes the highest fertility rate and the lowest reduction in mortality over time. Under the low cost scenario, compared with the intermediate or high cost scenarios, there are more working age people relative to the potential number of elderly beneficiaries.
Probabilistic statistical methods can capture both historical trends and fluctuations in past demographic rates. They may use simulations to predict the impact of various combinations of rates on the population size. These methods allow analysts to identify, with varying degrees of certainty, a range in which the population size will fall. The upper and lower bounds of this range are based on the desired degree of certainty (for example, a 60 percent or 90 percent degree of certainty). In population forecasting, these methods also maintain consistency between estimates of future population size, size of the labor force, and ratio of the nonworking population to the working population.
Consistency in estimating the size of these subpopulations is important because the United States has a pay-as-you-go system. The size of the working population paying in and the nonworking population drawing benefits determines the financial status of the Medicare and Social Security funds. Medicare imbalances forecasted over the long run will occur as a result of several factors:
- A large increase in the number of beneficiaries in the next 10 years (see table).
- A rise in the use of health care as the average predicted age of beneficiaries rises.
- A smaller increase in the labor force paying into the fund as baby boomers retire and women’s labor force participation rates stabilize.3
Projected Medicare Enrollment
| Calendar
Year |
Total Medicare Enrollment (in thousands)
|
|---|---|
|
2000*
|
39,688
|
|
2005*
|
42,588
|
|
2010
|
46,936
|
|
2015
|
53,884
|
|
2020
|
62,216
|
|
2025
|
71,238
|
|
2030
|
79,098
|
|
2035
|
83,930
|
|
2040
|
86,872
|
|
2045
|
89,000
|
|
2050
|
91,441
|
*Actual enrollment.
Source: The 2006 Annual Report of the Medicare Board of Trustees.
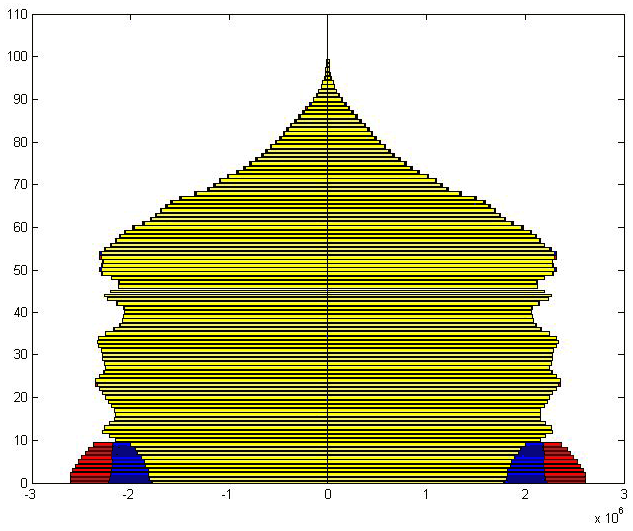
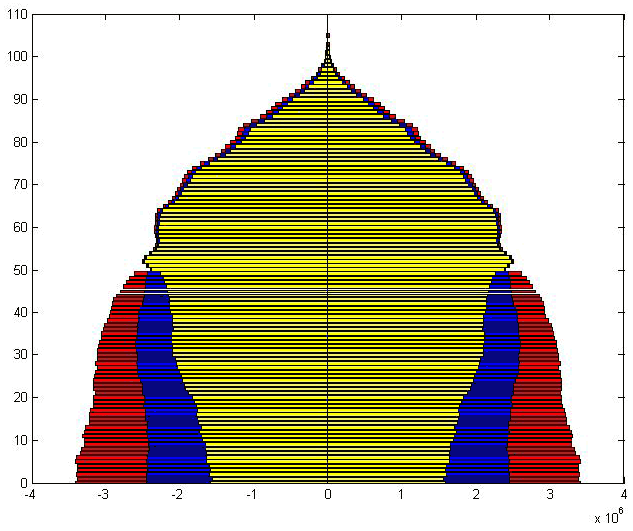
For short-term forecasts of five years or less, demographic uncertainty may be so small that traditional projections with only an expected population size rather than a predicted range are adequate. Over the long-term, however, demographic uncertainty may be so great as to overshadow changes in labor force participation or disability rates. In this case, planners need to take the degree of certainty associated with demographic projections more seriously. When population projections are made using probabilistic statistical procedures and are done by single-year age group, analysts can calculate upper and lower bounds for any age group of interest (see Figure 1 and Figure 2).4 Those ranges help analysts calculate upper and lower bounds for the projection of important subpopulations, such as the labor force and retirees.
Uncertainty Levels Differ in Short-Term and Long-Term Projections
The two population pyramids presented in Figures 1 and 2 show a 2006 example of 10 year and 50 year forecasts of the U.S. population based on probabilistic methods. Each pyramid shows the lower bound of the forecast (in yellow), the middle estimate (in blue), and the upper bound (in red). These represent, by sex and age group, a range in which the analysts, Ronald Lee and Shripad Tuljapurkar, are 67 percent certain the actual population size of each age group will fall.
Shripad Tuljapurkar, Ronald Lee, and their collaborators have used these methods to project the exhaustion of combined Social Security trust funds which pay benefits to retired workers and their families, survivors of deceased workers, and disabled workers and their families.5 Starting with the current population, they use statistical models of historical fluctuations in fertility and mortality rates to predict future births and deaths for a fixed time horizon.6 Migration is considered to be set by policy, such as regulations that limit the number of visas, essentially taking into account only authorized entries.
In short-term projections such as the 10 years in Figure 1, there is significant uncertainty only for the youngest age groups.7 Fertility trends will affect the number of births in each year and survival rates will determine how many from each age group move into the next age group. Because U.S. adult mortality rates in recent decades have been more stable than fertility rates, volatility in fertility rates is the major influence in uncertainty levels in short-term population projections.
U.S. mortality rates at some older ages, however, still have room for improvement. Historical trends suggest that lifespan may lengthen. Over the long term, such as the 50 year projection in Figure 2, we can see both the uncertainty in predicting fertility rates and in predicting death rates at certain older ages.
Knowing the Level of Uncertainty Could Influence Policy Decisions
Figure 2 shows that predictions about the size of the elderly population, even in the long-term, are relatively certain. This allows Social Security Trustees to say with confidence that “only unlikely changes in expected rates of fertility, mortality, and immigration could dramatically alter the outlook.”8 Although the same fertility and mortality estimates are used for analyses in the Medicare report, Medicare forecasts are more uncertain than those for Social Security, particularly long-term forecasts. This is because projected Medicare balances also depend on assumptions about medical advances and whether they are incorporated into standard treatment.
If population projections are to inform policy decisions, then uncertainty of these projections must be assessed. In some areas, greater uncertainty might lead to postponement of action. In other policy arenas such as education planning, greater uncertainty might indicate that the best polices would be those most easily changed as the future unfolds. For example, a school planner facing uncertain projections of enrollment growth might decide to rent additional space for schools rather than building or buying space.9 Explicitly estimating the degree of uncertainty in population projections encourages consideration of alternative population futures and the full range of implications suggested by these alternatives.
Marlene Lee is a senior policy analyst at the Population Reference Bureau. Shripad Tuljapurkar is professor of biology at Stanford University whose work in forecasting populations has been supported by grants from the National Institute of Child Health and Human Development, the National Institute on Aging, and the Michigan Retirement Research Center at the University of Michigan.
References
- Board of Trustees, Federal Old-Age and Survivors Insurance and Federal Disability Insurance Trust Funds, The 2007 Annual Report (Washington, DC: Government Printing Office, 2007); and Board of Trustees, Federal Hospital Insurance and Federal Supplementary Medical InsuranceTrust Funds, The 2007 Annual Report (Washington, DC: Government Printing Office, 2007). The Medicare Modernization Act of 2003 requires Trustees to make a determination of “excess general revenue funding” when “the difference between total Medicare outlays and dedicated financing sources (such as premiums and payroll taxes)” is projected to be more than 45 percent within seven years. Such a determination is treated as a funding warning for Medicare.
- Brian C. O’Neill et al., “A Guide to Global Population Projections,” Demographic Research 4, no. 8 (2001); and Population Reference Bureau, Understanding and Using Population Projections (Washington, DC: Population Reference Bureau, 2001).
- Board of Trustees, Federal Hospital Insurance and Federal Supplementary Medical InsuranceTrust Funds.
- Juha M. Alho, “Stochastic Methods in Population Forecasting” International Journal of Forecasting 6 (1990): 521-30.
- Clark Burdick and Joyce Manchester, “Stochastic Models of the Social Security Trust Funds,” Social Security Bulletin 65, no. 1 (2003/2004): 26-31.
- Ronald D. Lee and Shripad Tuljapurkar, “Population Forecasting for Fiscal Planning: Issues and Innovations,” in Demographic Change and Fiscal Policy, ed. Alan J. Auerbach and Ronald D. Lee (Cambridge, UK: Cambridge University Press, 2001).
- Shripad Tuljapurkar, “Population Forecasts, Fiscal Policy, and Risk,” presentation at Government Spending on the Elderly conference at the Levy Economics Institute of Bard College, April 28-29, 2006.
- Social Security and Medicare Board of Trustees, Summary of the 2006 Annual Reports: A Message to the Public, accessed online at www.socialsecurity.gov, on July 21, 2006.
- Panel on Population Projections, Committee on Population, National Research Council, Beyond Six Billion: Forecasting the World’s Population, ed. John Bongaarts and Rodolfo A. Bulatao (Washington, DC: Government Printing Office, 2000): chapter 7.