
(December 2009) Recent recommendations from the U.S. government suggesting a relaxation in the age women should begin undergoing regular mammography exams have raised major debate and concerns.
The Department of Health and Human Services’ Preventive Services Task Force recommends that women in their 40s forego routine mammography exams until they turn 50, at which time they should have the procedure done every two years.1 The report came on the heels of a debate in the medical community initiated months earlier with the publication of an article that suggested the benefits of early mammography screening were exaggerated, with false-positive detections too easily disregarded.2
Critics of the report have accused the task force of using cold cost/benefit analyses that could potentially overturn the reductions in breast cancer deaths over the last couple of decades. Many fear that the recommendations represent the rationing of health care and that the health insurance industry will use the new guidelines to block access to mammography exams to women younger than 50.3
According to the American Cancer Society, death rates associated with breast cancer have declined since 1990 at about 2 percent per year for women 50 and older and 3.2 percent annually among those younger than 50. Early detection of breast cancer through regular mammograms has been credited as one of the primary reasons behind the declining death rate from breast cancer.4
Despite the decline, the disease continues to inflict a heavy toll on women in the United States. In 2009, approximately 40,000 women are expected to die from breast cancer, while roughly 192,000 women are expected to be diagnosed with the disease.5 There are also substantial race and ethnic gaps in breast cancer mortality rates, which could potentially increase under the newly proposed guidelines.
Changes in Breast Cancer Mortality
Women’s death rates associated with breast cancer dropped by 15.4 percent between 1996 and 2006, from 31.8 deaths per 100,000 females in 1996 to 26.9 deaths per 100,000 females in 2006. The absolute number of deaths from breast cancer also dropped somewhat, from 43,091 in 1996 to 40,821 in 2006.6
Breast cancer death rates rise progressively with age (see Figure 1).7 The median age of those who died from breast cancer was 68 in 1996 and 2006. The median age of women who were recently diagnosed with breast cancer is 61.8 years.
Figure 1
Age-Specific Death Rates Associated With Breast Cancer Among All Persons
by Age Group, United States, 1996 and 2006
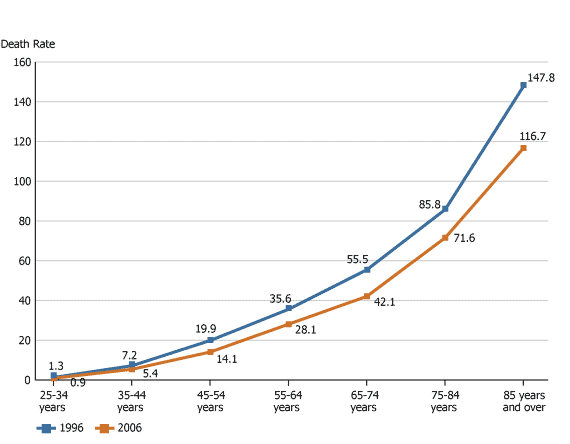
Note: The death rates refer to the number of deaths due to breast cancer per 100,000 persons in the particular age group (including both females and males).
Source: National Center for Health Statistics.
Accordingly, breast cancer age-specific death rates are relatively low among women younger than 55. Nonetheless, while these death rates have declined among all age groups between 1996 and 2006, the drop has been greater among women younger than 55 (for ages 25 to 34, a 31 percent decline; from 45 to 54, 29 percent; and from 35 to 44, 25 percent). In contrast, in relative terms, the declines in the age-specific death rates were slower among older women, especially those ages 75 to 84 (a 17 percent decline).
Racial and Ethnic Group Variations
While whites have higher incidences of breast cancer compared with blacks, blacks are more likely to die from the disease than whites.9 This crossover reflects earlier detection and greater access to health care among whites. The relative black-white difference in age-adjusted death rates of women remained virtually unchanged between 1999 and 2006, with death rates among black women about 37 percent higher than those of white women.10
In contrast, Latina women have lower breast cancer death rates compared with black and white women (see Figure 2). In 2006, the age-adjusted death rate of Latina women was half that of black women and almost two-thirds as high as that of white women. This pattern is consistent with the epidemiological paradox in which Latinos have relatively low mortality rates despite low socioeconomic levels.11 However, the age-adjusted death rate of Latina women remained essentially unchanged between 1999 and 2006 in comparison with more noticeable declines among white and black women.
Figure 2
Age-Adjusted Death Rates Associated With Breast Cancer Among Women
by Selected Racial/Ethnic Groups, United States, 1999 and 2006
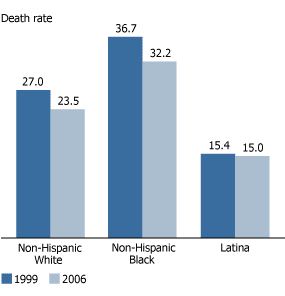
Note: The adjusted death rates are relative measures rather than actual measures. They represent the number of deaths due to breast cancer per 100,000 women assuming that all three groups of women had the same age structure.
Source: National Center for Health Statistics.
Implications
The analysis presented here indicates that the death rate associated with breast cancer has fallen over the last decade. It has been suggested that improved treatment and early detection through mammography exams and related detection methods largely account for the decline in breast cancer deaths since 1990.
However, while the pace of decline has been steady, breast cancer continues to be the second leading cause of death among women (behind lung cancer). In addition, there are racial disparities associated with breast cancer. While white women are more likely than black women to be diagnosed with breast cancer, black women are less likely to survive this disease. This crossover reflects black women’s more-limited resources and access to health care. Thus, health disparities across racial and socioeconomic lines will widen further if mammography screening begins later in life. These trends appear to call into question the recommendations for women to wait until they are 50 to undergo regular mammography exams and then to do so only biennially.
Rogelio Saenz is professor of sociology at Texas A&M University. The author acknowledges the helpful comments and suggestions of Carlos Siordia and Eric Zuehlke.
References
- U.S. Department of Health and Human Services, Breast Cancer Screening, accessed online at www.ahrq.gov/clinic/uspstf/uspsbrca.htm, on Nov. 20, 2009.
- John D. Keen and James E. Keen, “What Is the Point: Will Screening Mammography Save My Life?” BMC Medical Informatics and Decision Making 9, no. 18 (2009), accessed online at www.biomedcentral.com/1472-6947/9/18, on Nov. 26, 2009; Stephen W. Duffy, “Commentary on ‘What Is the Point: Will Screening Mammography Save My Life,’ ” BMC Medical Informatics and Decision Making 9, no. 19 (2009), accessed online at www.biomedcentral.com/1472-6947/9/19, on Nov. 26, 2009; and Michael Retsky, “Comments on John D. Keen and James E. Keen, ‘What Is the Point: Will Screening Mammography Save My Life?’ ” BMC Medical Informatics and Decision Making 9, no. 20 (2009), accessed online at www.biomedcentral.com/1472-6947/9/20, on Nov. 26, 2009.
- American Cancer Society, Breast Cancer Facts & Figures 2009-2010 (Atlanta: American Cancer Society, 2009), accessed online at www.cancer.org, on Nov. 20, 2009.
- American Cancer Society, Breast Cancer Facts & Figures 2009-2010.
- American Cancer Society, Breast Cancer Facts & Figures 2009-2010.
- Data for the analysis presented in this report come from the following two sources: Kimberly D. Peters, Kenneth D. Kochanek, and Sherry L. Murphy, “Deaths: Final Data for 1996,” National Vital Statistics Reports 47, no. 9 (1998); and Melonie Heron et al., “Deaths: Final Data for 2006,” National Vital Statistics Reports 57, no. 14 (2009).
- The age-specific death rates for causes of death available from the National Center for Health Statistics do not disaggregate these rates on the basis of sex. Nonetheless, the vast majority of deaths due to breast cancer occur to women: 99.2 percent in 1996 and 99.1 percent in 2006.
- American Cancer Society, Breast Cancer Facts & Figures 2009-2010; and M.J. Horner et al., SEER Cancer Statistics Review, 1975-2006 (Bethesda, MD: National Cancer Institute, 2009), accessed online at http://seer.cancer.gov/csr/1975_2006/, on Nov. 21, 2009.
- American Cancer Society, Breast Cancer Facts & Figures 2009-2010.
- The data used in this part of the analysis are for non-Hispanic white, non-Hispanic black, and Latina (or Hispanic) women. The National Center for Health Statistics began using this format in 1999. Thus, this part of the analysis examines death rates for the 1999 to 2006 period.
- Alberto Palloni and Elizabeth Arias, “Paradox Lost: Explaining the Hispanic Adult Mortality Advantage,” Demography 41, no. 3 (2004): 385-415; and Robert Hummer et al., “Paradox Found (Again): Infant Mortality Among the Mexican-Origin Population in the United States,” Demography 44, no. 3 (2007): 441-57.