The Effect of Educational Attainment on Adult Mortality in the U.S.
Product: Population Bulletin, vol. 68, no. 1
Authors: Robert A. Hummer Elaine M. Hernandez
Date: July 18, 2013
In 2011, U.S. mortality rates reached record lows for both women and men; as a result, life expectancy at birth reached record highs: 81 years for women and 76 years for men.1 These are impressive figures.
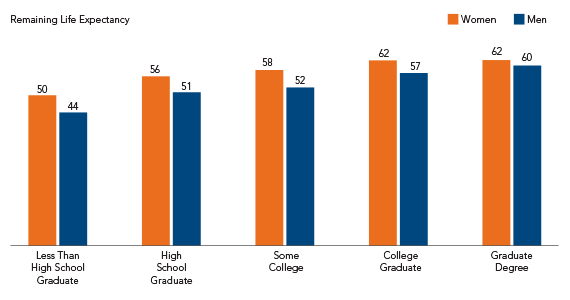
As recently as 1960, women’s life expectancy at birth was only 73.1 years and men’s only 66.6 years.2 Within 50 years, life expectancy at birth increased by 8 years for women and nearly 10 years for men. Unfortunately, these increases in life expectancy mask very wide disparities among population groups. For example, remaining life expectancy at age 25—an important overall indicator of adult population health—is about a decade shorter for people who do not have a high school degree compared with those who have completed college.3 Educational attainment appears to be very important in differentiating U.S. adults’ prospects for long life.
These differences represent critical health and social issues with important implications for policymakers. Because well-educated individuals have a much longer life expectancy, is such an accomplishment (or at least a substantial improvement) possible for other subgroups? The potential to reduce these educational differences in mortality and life expectancy underscores the need to accurately describe them and understand why they exist. Armed with such information, policymakers then have the evidence to ensure that U.S. adults are sufficiently educated so that no group pays a “longevity penalty.”
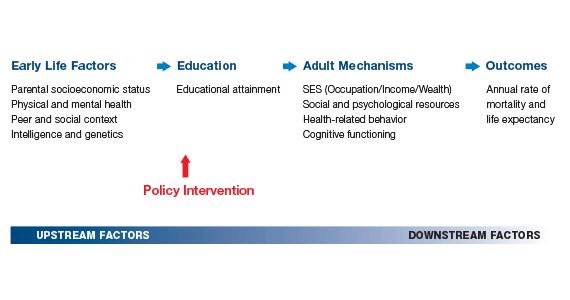
Despite the potential to reduce educational differences in mortality, it may be overly simplistic to assume that they are easily responsive to increased future investments in the education of U.S. children. Higher levels of schooling do not necessarily cause people to live longer. Other factors, such as parental education and income, may be related to both high educational attainment and longevity among U.S. adults. If so, then even the best-intentioned policy efforts to reduce educational differences in mortality may be of little value. In short, this area of scientific inquiry and policy interest is controversial.
In this Population Bulletin, we examine educational differences in U.S. adult mortality and life expectancy. We provide a balanced and up-to-date portrait of the key results and implications of research in this area. We address five major issues: What is the current association between educational attainment and adult mortality? Have educational differences in adult mortality changed over the past 50 years? Why do such wide educational differences in adult mortality now exist? What are the policy implications of recent education-mortality research? And what are the implications of recent work in this area for future education-mortality research?
Listen to the Authors Describe Their Findings
Here are three graphics from the Population Bulletin. Authors Robert Hummer and Elaine Hernandez describe their findings.
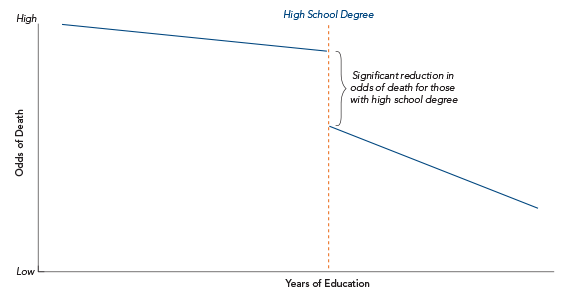
Relationship Between Educational Attainment and Mortality for U.S. Adults

Source: Jennifer Karas Montez et al., “Educational Attainment and Adult Mortality in the United States: A Systematic Analysis of Functional Form,” Demography 49, no. 1 (2012): 315-36..
Remaining Years of Life for U.S. Adults at Age 25 by Educational Attainment, 2005

Source: Brian L. Rostron et al., “Education Reporting and Classification on Death Certificates in the United States,” Vital and Health Statistics Series 2, no. 151 (2010): 1-16.
Conceptual Diagram Linking Educational Attainment to Adult Mortality and Life Expectancy

References
- Donna L. Hoyert and Jiaquan Xu, “Deaths: Preliminary Data for 2011,” National Vital Statistics Reports 61, no. 6 (2012): 1-64.
- Kenneth D. Kochanek et al., “Deaths: Final Data for 2009,” National Vital Statistics Reports 60, no. 3 (2011): 1-117.
- National Center for Health Statistics, Health, United States, 2011: With Special Feature on Socioeconomic Status and Health (2012): figure 32.

 ">
">