
(June 2014) Is there a retirement crisis, or are older Americans preparing adequately for their “golden years”? Because of the wide variety of life circumstances—differing levels of wealth, income, and other resources—it’s impossible to give a single general answer, says James Poterba, an economics professor at the Massachusetts Institute of Technology and president of the National Bureau of Economic Research.
More Living Longer; More Reaching the Oldest Ages
A growing proportion of Americans can expect to celebrate their 65th birthdays (see Table 1). For men born in 1900, fewer than half (47 percent) reached 65; for those born in 2000, the projected likelihood of reaching age 65 is 86 percent. Life expectancy gains for women have been almost as dramatic. Women born in 1900 had a 58 percent chance of reaching 65; for those born in 2000, 91 percent are projected to reach 65.
Table 1
Americans Are Living Longer; More Are Reaching the Oldest Ages
| Probability of Reaching Age 65 (%) | Expected Age at Death After Reaching Age 65 | Age at Which 1 in 5 Will Still Be Alive | ||||
|---|---|---|---|---|---|---|
| Men | Women | Men | Women |
Men | Women |
|
| Born in 1900 |
47 | 58 | 79 | 83 | 86 | 92 |
| Born in 1950 | 76 | 85 | 83 | 85 | 91 | 93 |
| Born in 2000 | 86 | 91 | 85 | 88 | 93 | 96 |
Source: Felicitie Bell and Michael Miller, “Life Tables for the United States Social Security Area 1900-2100,” U.S. Social Security Administration Actuarial Study 120 (2005).
People also are living longer once they reach 65. Men born in 1900 lived, on average, 14 more years after age 65, while those born in 2000 are projected to live an average of 20 additional years, to age 85. For women born in 1900, remaining life expectancy at 65 was 18 years; for women born in 2000, it is projected to be 23 years, reaching age 88 on average.
But individuals saving for retirement should consider more than average life expectancy as their planning horizon, says Poterba. “There’s a wide range of life outcomes.” For those turning 65 in 2015 (born in 1950), one in five men is expected to live beyond his 90th birthday, while one in five women will still be alive at 93.
And income plays a role in longevity. Higher-earning people tend to live longer, and the gap has widened, he points out. Hilary Waldron of the Social Security Administration examined the remaining life expectancy of those turning 65 between 1977 and 2006, based on their lifetime earnings.1 Over nearly four decades, life expectancy rose roughly one year for the bottom half of earners, but almost six years for the upper half. Among those who turned 65 in 2006, men in the top half of earners could expect to live more than five years longer than men in the bottom half.
“If you are in the upper end of the income distribution, you should consider planning for the potential of a very long retirement period, as there is a very strong chance that you might be living into your 90s,” Poterba says. For the lowest earners, the prospect of reaching age 90 is more remote.
More people living to older ages has contributed to a shift in the age composition of the U.S. population. In 1950, 8 percent of Americans were age 65 or older; that share stood at nearly 14 percent in 2012, and is expected to reach 21 percent by 2050. The result of this population aging is a shrinking worker-to-retiree ratio: By 2040, there will be about two workers contributing to the Social Security program for each retiree, down from about three workers per retiree in 2014, and 5 to 1 in 1960.2 Rising life expectancy not only presents challenges for individuals planning for old age but also implies significant increases in outlays on government programs for older Americans.
Policymakers are confronting fiscal pressure to modify Social Security and other programs for older people. “Changes in eligibility rules and program benefits may attenuate, but are unlikely to undo these fiscal demands,” Poterba comments.
Many Rely Almost Exclusively on Social Security
Sources of income in old age vary widely across the income spectrum (see Figure 1). Social Security is the primary or only source of old-age income for elderly with below-average incomes, representing more than 80 percent of this group’s income. This half of the elderly population is most affected by changes in Social Security benefits. Policymakers examining potential Social Security reforms should give careful consideration to the impact on those in the bottom half of the income distribution, Poterba argues.
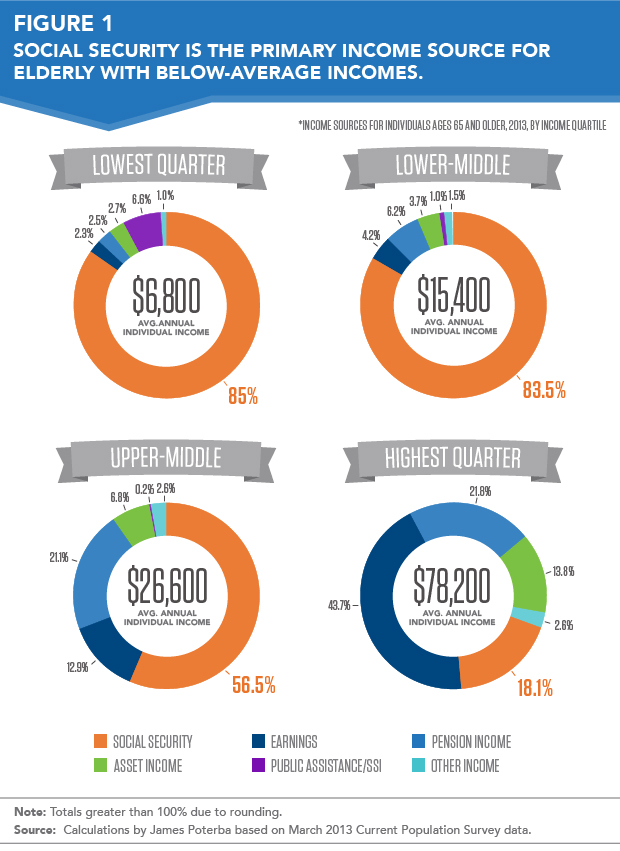
U.S. retirement income has often been described as a “three-legged stool” made up of a balance of government-provided Social Security, employer-based private pensions, and personal savings. However, only the highest-income quarter of elderly Americans “draws substantial support from all three legs,” he says. “The old ‘three-legged stool’ is a one-legged pole for roughly half of older Americans. Social Security benefits and the standard of living of this part of the population are very tightly linked.”
For example, for two out of three of the so-called “young elderly” (ages 65 to 69), the estimated value of their Social Security benefits and home equity made up the vast majority of their net worth in 2008. Currently, the Social Security program is intentionally designed to provide extra support for low-income wage earners. For those in the lowest quarter of the income distribution, Social Security benefits replace about 75 percent of their average annual earnings, compared with about 50 percent for those in the middle of the income distribution, he notes.
Another area of diversity is income from work, which makes up a much larger share of the old-age income for those in the upper half of the income distribution than those in the lower half. Disability and other health problems may prevent some older people from working into their late 60s and 70s; some jobs may be too physically demanding for older people to continue to perform during their later years.
Overall, working past age 65 is on the upswing, which Poterba calls “a striking turnaround over the past 25 years.” Labor force participation rates for men ages 65 to 69 began to drop in the 1960s, bottoming out at 24 percent in 1985, but have risen to about 38 percent in 2014, with signs the climb will continue.
To Poterba, this reversal is a sign that the economic behavior of the older population responds to changing circumstances. “I don’t think anybody in the 1980s would have predicted this turnaround,” he notes. “Retirement patterns for people in their 40s today might look quite different than what we’ve experienced in the past couple of decades.”
A Sizeable Group at Risk of Not Saving Enough
Employers have increasingly shifted away from offering defined benefit (DB) pension plans with guaranteed payouts for long-serving employees based on pay level and years of service. In their place, more employers are offering defined contribution (DC) retirement savings plans (such as 401(k) plans) that require individuals to make complex long-term investment decisions.
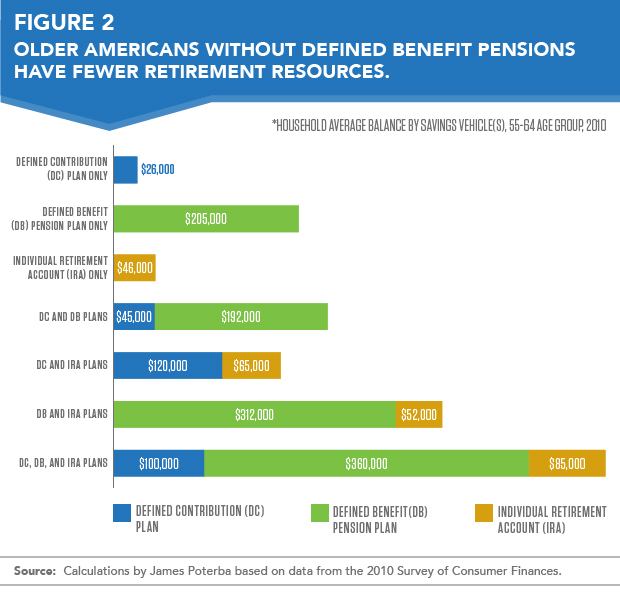
Nearly 75 percent of households in their preretirement years (ages 55 to 64) in 2010 reported they had some kind of DB pension, DC plan, or Individual Retirement Account (IRA), according to Poterba. Figure 2 shows that those without DB pensions had lower levels of retirement savings than those who had such pensions. Poterba notes that many of those who have a retirement account have accumulated only modest savings. While 70 percent of married households between the ages of 55 and 64 have an IRA or a DC retirement plan, only 46 percent have accumulated more than $50,000, and 38 percent have accumulated more than $100,000. Those with small account balances will not be able to rely on these accounts for substantial retirement support. As the number of households covered by DB pensions shrinks, more middle-income households may be at risk of not saving adequately, Poterba points out. “If we are relying on private-sector savings [such at DC plans or IRAs], one would expect to see higher savings rates to deliver the kind of wealth that would support retirement, given today’s low rates of return,” he says.
Nearly half (46 percent) of older Americans die with less than $10,000 in financial assets, according to a study Poterba conducted with Steven Venti of Dartmouth University and David Wise of Harvard University. Many had no housing wealth and depended almost exclusively on Social Security benefits to support themselves. Compared to those with higher asset levels, they were much more likely to be in poor health. Older people with few assets have “little capacity to pay for unanticipated needs such as health expenses or other financial shocks,” the researchers point out.3
But how much should Americans save to avoid outliving their wealth? Researchers have used a variety of approaches to try to answer this question—from analyzing the preretirement savings levels of individuals who ran into financial difficulties to calculations based on maintaining preretirement spending patterns. In one such study, Michael Hurd and Susann Rohwedder of the RAND Corporation measured whether elderly Americans ages 66 to 69 in 2008 could maintain their preretirement consumption levels in retirement.4 They used a formula that assumed a 10 percent decline in spending after retirement and took into account savings, Social Security benefits, life expectancy, taxes, and potential out-of-pocket medical costs.
Single people were less likely to be adequately prepared for retirement than married people, and those with lower levels of education were also more likely to fall short, Hurd and Rohwedder found. About 20 percent of married couples had not saved enough, compared to 35 percent of single men and 49 percent of single women. The difference between married and single women was stark: Single women were 2.5 times more likely to be unprepared for retirement than their married peers. They estimate that a 30 percent reduction in Social Security benefits would increase the share of married people who were unprepared by about 8 percentage points, but would add 11 percentage points to the share of unprepared single people.
Social Security benefits for spouses and widows are often more generous than a woman’s own earned benefits because women, on average, earn less than men and are more likely to interrupt their working careers to raise children or care for family members. Unmarried women and divorced women without 10 years of marriage are ineligible for these spousal and widow Social Security benefits, potentially leaving them with less income in old age than married women.5 Some groups of women are less likely to be married than others. Among U.S. women age 15 or older in 2013, 73 percent of African American women and 57 percent of Hispanic women were single, compared to 48 percent of white women.6
Middle-Income People Could Be Encouraged to Save More
Because the U.S. older population faces diverse circumstances and has vastly different financial resources, a “one-size-fits-all solution for retirement planning probably does not work,” says Poterba. “Whether it’s in the public policy sphere or the private financial advising world, it is difficult to recommend one level of saving or one kind of benefit program for everybody.” For low-income Americans, personal saving is difficult and Social Security will remain crucial to their retirement security, he says. On the other end of the spectrum, high-income earners have access to a wide range of DC savings opportunities and appear to be using them.
The middle-income population could benefit the most from initiatives that would further encourage saving, Poterba argues. Many could use expanded access to retirement savings mechanisms. For example, smaller firms could be offered tax incentives to provide DC retirement plans to their employees. Financial education could help more people understand the advantages of participating in DC plans that have contributions matched by employers and the long-term consequences of liquidating retirement saving before reaching retirement age. Additionally, research is showing that automatically enrolling new employees in employer-sponsored plans, and providing them with an opportunity to opt out rather than requiring them to opt in, increases their participation.7
For More Information:
James Poterba, “Retirement Security in an Aging Population,” American Economic Review: Papers & Proceedings 104, no. 5 (2014): 1-33.
Paola Scommegna is a senior writer/editor at the Population Reference Bureau. Kelvin Pollard, senior demographer at PRB, provided research and technical assistance for this article and the accompanying infographic.
References
- Hilary Waldron, “Trends in Mortality Differentials and Life Expectancy for Male Social Security-Covered Works, by Socioeconomic Status,” Social Security Bulletin 67, no. 3 (2007): 1-19.
- Social Security Administration, “Ratio of Covered Workers to Beneficiaries,” accessed at www.ssa.gov/history/ratios.html; and “Coping with Demographic Challenge: Fewer Children and Living Longer,” accessed at www.ssa.gov/policy/docs/ssb/v66n4/v66n4p37.html, on May 25, 2014.
- James Poterba, Steven Venti, and David Wise, “Were They Prepared for Retirement? Financial Status at Advanced Ages in the HRS and AHEAD Cohorts,” National Bureau of Economic Research Working Paper 17824 (2012).
- Michael Hurd and Susann Rohwedder, “Economic Preparation in Retirement,” in Investigations in the Economics of Aging, ed. David Wise (Chicago: University of Chicago Press, 2012): 77-113.
- Madonna Harrington Meyer, Douglas A. Wolf, and Christine L. Himes, “Linking Benefits to Marital Status: Race and Social Security in the U.S.,” Feminist Economics 11, no. 2 (2005): 145-62.
- U.S. Census Bureau, “America’s Families and Living Arrangements: 2013: Adults (A table series)”, table A1, accessed at www.census.gov/hhes/families/data/cps2013A.html, on May 20, 2014.
- Olivia Mitchell and Stephen Utkus, “Target Date Funds in 401(k) Retirement Plans,” National Bureau of Economic Research Working Paper 17911 (2012).