Paola Scommegna
Contributing Senior Writer

(March 2014) The weak U.S. economy—reflected in higher unemployment, lower incomes, and widening inequality—is the main reason the number of Americans receiving federal food stamp benefits grew rapidly since 2000, reports James Ziliak, director of the Center for Poverty Research at the University of Kentucky, in a recent analysis.1
Demographic trends have acted as countervailing forces, dampening participation in this food assistance program, now officially called the Supplemental Nutrition and Assistance Program (SNAP). Population aging, smaller households, fewer children, and shifts from rural areas to cities are among the trends holding program size in check—in part by limiting the number of poor and near-poor households.
Without demographic changes, SNAP caseloads were projected to be much higher, according to Ziliak.
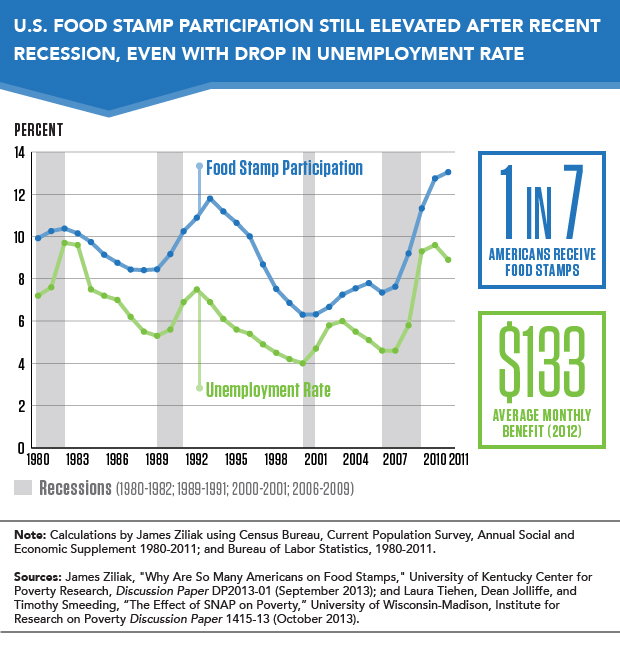
Between 2000 and 2011, the number of SNAP participants grew 171 percent to reach about 47 million people, roughly 14 percent of the population, he calculated. The program cost nearly $80 billion in 2012, more than two and a half times the 2000 level when adjusted for inflation.
Congress considered a variety of program changes to rein in spending; they eventually agreed to cut SNAP funding by $8 billion over 10 years and end automatic enrollment for households qualifying for other government aid programs in February 2014 as part of the farm bill. This cut followed the decision in November 2013 to end a 2009 stimulus bill provision that temporarily added an extra $5 billion annually to SNAP.
“Most households will still remain eligible but they will see their benefits rolled back,” Ziliak explains.
Households with incomes below 130 percent of the poverty line are eligible for SNAP benefits with restrictions on assets and various exceptions. In 2013, the income cutoff for a three-person household was roughly $2,069 per month; the average monthly benefit was $133 per person in 2012, according to research by Laura Tiehen, Dean Jolliffe, and Timothy Smeeding of the University of Wisconsin-Madison.2
“The economy is the most important factor driving short-run changes in participation,” Ziliak says. Economic factors accounted for nearly half the increase in the SNAP caseload between 2000 and 2011, according to his analysis.
The program is operating as intended, supplementing incomes by bolstering food spending during times of economic distress, he points out. Over the past three decades, SNAP participation peaked during periods of high unemployment (see figure).
But since 2000, new patterns have emerged. A growing share of participants worked full-time and year-round, had some college education, and had incomes closer to the poverty line.
SNAP has evolved and is now supplementing the paychecks of “higher educated but low-income households,” he says. “It’s reaching the near-poor, people making more than the minimum wage.”
Ziliak also found that in households receiving SNAP benefits (which often include recipients and nonrecipients), working-age adults (ages 18 to 59) slightly outnumbered children and elderly for the first time, based on the Census Bureau’s Current Population Survey data. Before the recent recession, 55 percent of SNAP household members were elderly and children.
“This may reflect more one-parent and one-child households, a working-age uncle moving in, adult children living with their parents,” he suggests.
These findings go hand-in-hand with stagnating wages and growing inequality. While the incomes of the top earners are increasing, incomes near the bottom are flat, he reports.
Median household income in 2012 was at about the same level as in the late 1990s (about $52,000 adjusting for inflation). But a key measure of inequality showed dramatic growth: The ratio between the income of the bottom 10 percent of workers and the top 10 percent widened by 30 percent since 1980 (from roughly 1:9 to 1:12).
“Lower unemployment levels should pull down the number of SNAP participants, but it is still elevated,” he says. “More people are working but their wages aren’t growing.”
Many of the higher-paying jobs available to lower-skilled workers, especially in manufacturing, are gone, and these jobs have been replaced by lower-wage jobs, mostly in the service and retail sectors, explains Mark Mather, associate vice president for U.S. programs at Population Reference Bureau. “We’re seeing some job growth at the top and the bottom but the middle class is lagging behind.”
Mather, co-author of a new report from the Working Poor Family Project, points out that “low-wage workers are increasingly getting squeezed by the high cost of transportation, child care, and other work-related expenses. They rely on public programs, such as food stamps, to help meet basic needs for their families.”
On balance, demographic trends helped curb the growth in SNAP participants, which surprised Ziliak. “I thought demographics would contribute to program growth.”
Population aging, fewer children, smaller households, and more urban residents all tempered the number of low-income households participating in the program, he found. Older and more-educated people were less likely to participate in SNAP. Only about one-third of elderly who qualify for the program tend to participate, a longstanding pattern.
Ziliak found SNAP participation was lower among smaller households and households with fewer related children. Married-couple households and metro-area residents were also less likely to receive benefits.
But certain groups were more likely to participate in SNAP—nonwhites, multi-generation households, and female-head households. However, the combined impact of these trends did not outweigh trends inhibiting program growth.
Ziliak’s analysis also showed that SNAP program changes—mainly at the state level—contributed to about one-third of the growth since 2000; these include exempting the value of vehicles from asset restrictions, restoring noncitizens to the program, simplifying income reporting, and allowing people to apply over the phone. Policy changes such as the 1996 federal welfare reform and earned income tax credit served to limit SNAP growth.
In the future, demographic trends will continue to help depress SNAP growth, he says. But the economy will be key: “If inequality keeps widening and there is no growth in real wages, the SNAP caseload will likely stay high.”
Paola Scommegna is a senior writer/editor at the Population Reference Bureau.