Racial Differences in Health Status and Health Insurance Coverage in the United States
Date
March 9, 2011
Author
(March 2011) Past research has extensively explored racial and ethnic disparities in health insurance coverage in the United States and found wide differences in the composition of the uninsured populations. In their article published in the November 2010 issue of Demography, James B. Kirby and Toshiko Kaneda expand the existing literature and explore how long individuals are expected to live with different types of health insurance coverage and in different health states throughout their lives. Kirby is a senior social scientist at the Agency for Healthcare Research and Quality, Center for Financing, Access and Cost Trends. Kaneda is a senior research associate at the Population Reference Bureau.
In order to give a more accurate picture of the insurance-related challenges in the United States, Kirby and Kaneda investigated these categories separately for black and white populations. “What motivated us to do this project was the fact that most research on the uninsured focuses on the number and proportion of individuals uninsured at a single point in time, or for brief periods of time,” says Kaneda. “We thought it would be important to quantify the duration one is uninsured over a typical lifetime, and to measure how much of this time is spent in poor health.”
In 2008, 46 million people in the United States did not have health insurance coverage. Compared with those with health insurance, the uninsured are less healthy: They have a higher chance of not receiving preventive or routine medical care, and they are more frequently hospitalized for potentially preventable conditions. As a group, African Americans are more likely to be uninsured than non-Hispanic whites, face a higher risk of serious illness at any age, and spend more years in poor health. Being uninsured and unhealthy is often a vicious cycle: As a result of lower-paying jobs, blacks are less able to afford health insurance or have employers that offer private insurance to them. Therefore, they are at a higher risk for disease and financial problems resulting from unexpected medical events, leading to further socioeconomic disadvantages.
Racial Disparities Evident in Time Spent Without Health Insurance
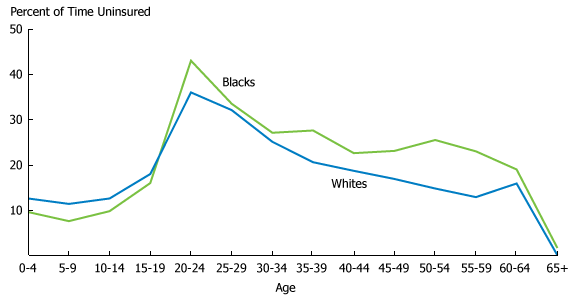
On average, Americans are expected to spend about 12 years without health insurance coverage over their lifetime. The figure below shows that children and people over 65 of both races spend the least amount of time uninsured among all the age groups. The proportion of time without insurance increases rapidly after childhood, peaks at ages 20 to 24, and then gradually declines. African Americans under age 20 actually spend proportionately less time uninsured than whites, likely the result of the expansion of public health insurance coverage for children in low-income families in the 1990s. This is the only period in which blacks fare better than whites: After age 20, blacks spend a higher proportion of time without insurance for every age group. At the peak, 20-to-24-year-old blacks live 43 percent of the time without insurance, while whites in the same age group are uninsured for 36 percent of the time. The racial gap grows bigger between ages 30 to 34 and 60 to 64. At age 65, individuals become eligible for Medicare and time without insurance drops for both races. Racial disparities are the largest among the near-elderly ages 50 to 60, as African Americans spend a much larger portion of these years without insurance than whites. This is a particularly important category because individuals at this age are more likely to need medical attention than any other age group not covered by Medicare. They are a logical target-group for reducing the joint risk of having no insurance and declining health and for reducing the disparities in insurance coverage between whites and blacks.
On Average, Blacks Spend Proportionally More Time Without Health Insurance Coverage

Source: James B. Kirby and Toshiko Kaneda, “Unhealthy and Uninsured: Exploring Racial Differences in Health and Health Insurance Coverage Using a Life Table Approach,” Demography 47, no. 4 (2010): 1035-51.
Health Insurance Types and Health Status Vary by Race
The total life expectancy for individuals born in the United States is 77.5 years. On average, a person can expect to have private insurance coverage for 41.1 years or 53 percent of their life, Medicaid for 8.1 years, Medicare for 16.3 years, and no insurance for 12 years. “We were quite surprised to find just how long Americans on average spend without health insurance over a typical lifetime—it’s 12 years, or about 15 percent of total life expectancy,” says Kirby. “A significant fraction of these years—40 percent—are spent in less healthy states,” when the need for medical care increases. Throughout their lives whites will spend proportionally more time covered by private insurance and Medicare than the population as a whole. Whites will also use Medicaid less and live without health insurance for proportionally fewer years. On the other hand, African Americans will be covered by Medicaid twice as long as whites (14.5 years vs. 7 years, respectively) and have no insurance for almost two years longer (13.6 years vs. 11.8 years, respectively). The original article offers a more detailed examination of the racial disparities and expected distribution of health insurance coverage for each of the 14 individual age groups.
The study also examined what portion of their life Americans are expected to spend in two different health states—healthy and less-healthy. An average person can expect to have 48.5 healthy years and about 29 less-healthy years. The study further divided the two health states and examined the kind of insurance coverage individuals can expect to have in each. These numbers reveal additional differences between blacks and whites.
Kata Fustos is a Communications intern at the Population Reference Bureau.
