U.S. Food Stamp Enrollment Rises
(October 2009) Timely economic data provide the means to assess the severity of the current economic hardship on the U.S. population. Official poverty estimates released on Sept. 10, 2009, by the U.S. Census Bureau show that in 2008, the poverty rate rose to 13.2 percent, and child poverty increased from 18 percent in 2007 to 19 percent, the highest level since 1997. Another measure of economic hardship, the monthly unemployment rate, rose to 9.7 percent in August 2009, a 26-year high.
Poverty and unemployment rates help to track the long-term economic health of families and individuals, but both are indirect measures of economic hardship. A more direct measure of family economic need is the number of individuals and families participating in the Supplemental Nutrition Assistance Program (SNAP), formerly known as the federal Food Stamp Program. The amount of assistance depends on household size, income, and expenses. SNAP participation rates have increased dramatically in recent months and could increase even further as income levels drop and more families become eligible.1
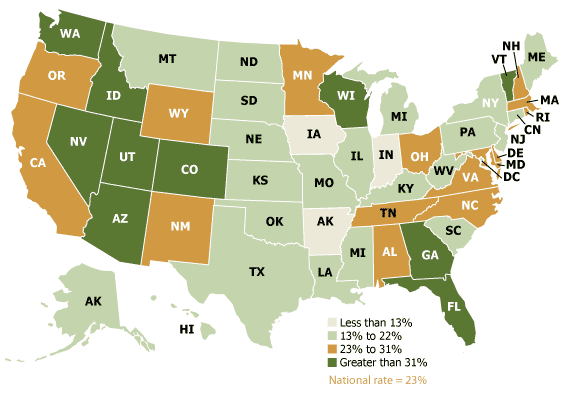
Percent Change in Supplemental Nutrition Assistance Program Participation, 2008-2009

Source: PRB analysis of Supplemental Nutrition Assistance Program data.
Households are eligible for SNAP if their income is less than 130 percent of the poverty line. For a family of four, the gross monthly income must be $2,389 or less and their food stamp allotment can be as much as $668 per month.2 The current average Food Stamp/SNAP benefit per household is about $294 per month.
More than 35 million low-income Americans (16 million households) received federal Food Stamp/SNAP benefits in June 2009, an increase over the 13 million households that received assistance in June 2008. Congress allocated $54 billion for the program in 2009, up from $39 billion last year, to cover the growing number of eligible families.
Between 2008 and 2009, there were two states—Nevada and Utah—where the number of households receiving food stamps increased by more than 40 percent. Most of the states with the biggest increases in participation were in the South or Mountain West.
A complicated and time-consuming program application process, complex renewal requirements, and the stigma attached to receiving food stamps have hindered SNAP participation rates in the past. However, rising unemployment and low expectations about economic recovery have prompted a record number of families to enroll in recent months. The U.S. labor market continues to shed jobs, and although the losses are smaller than a few months ago, the unemployment rate remains high. Prolonged unemployment and negative expectations about the economy are strong predictors of higher Food Stamp participation rates, according to research conducted by the USDA Economic Research Service (ERS).3
The recent increase in SNAP participation is important not only as an indicator of economic hardship, but also because it is linked to changes in the official poverty rate, a lagging indicator updated only once a year. An increase in the number of households participating in SNAP indicates that more families are meeting the 130 percent poverty threshold for eligibility. More important, SNAP participation reduces the burden of poverty on children and families. According to ERS research, adding the value of SNAP benefits to family income reduces child poverty by 4 percent and reduces the severity of child poverty by as much as 28 percent.4
Nadwa Mossaad is a research associate, Domestic Programs, at the Population Reference Bureau.
References
- Julia B. Isaacs and Timothy M. Smeeding, Wisconsin Poverty Report (Madison, WI: Institute for Research on Poverty, 2009).
- The gross income includes income before all deductions and limits are higher in Alaska and Hawaii. Supplemental Nutrition Assistance Program (SNAP) data, accessed online at www.fns.usda.gov/fsp, on Sept. 10, 2009.
- Kenneth Hanson and Craig Gundersen, How Unemployment Affects the Food Stamp Program (Washington, DC: USDA Economic Research Service, 2002).
- The child poverty rate measures the level of poverty, while the “severity” of poverty measures how poor the poor are, or how far their incomes fall below the official poverty line. See Dean Jolliffe et al., “Food Stamp Benefits and Child Poverty,” American Journal of Agricultural Economics 87, no. 3 (2005): 569-81.
