Who Votes in America?
Date
October 1, 2000
Author
Note: This article was written prior to the 2000 presidential election, and census data on the 2000 election were not available.
As the presidential election draws closer, the candidates are paying attention to key demographic groups. But which groups are likely to cast votes in the presidential election?
Women are more likely to vote than men (56 percent vs. 53 percent in 1996), but this has not always been the case. As recently as 1976, voter participation rates were higher among men than among women.
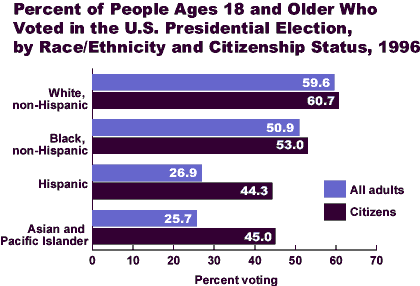
Whites are more likely to vote than blacks (60 percent vs. 51 percent in 1996), and both are significantly more likely to vote than Hispanics (27 percent) and Asian Americans (26 percent). It is important to note that the citizenship requirement keeps the Hispanic and Asian totals down — 53 percent of Hispanics and 58 percent of Asians who didn’t vote could not do so because they were not U.S. citizens. Among citizens, 44 percent of Hispanics and 45 percent of Asian Americans voted in 1996.
Voter participation increases with age. Two-thirds of people ages 65 and older voted in the 1996 election, compared with less than half of adults under age 45. Among young adults (ages 18 to 24), just one-third cast ballots in 1996.
Voting in 1996 was higher in the Midwest (59 percent) than in any other region. Participation was lowest in the South and West (52 percent).
In 1996, 61 percent of married people living with their spouses voted in the presidential election, compared with 58 percent of people who were widowed, 49 percent of people who were divorced, and about 40 percent of people who were separated or never married.
Seventy-three percent of people with at least a college degree reported casting ballots in 1996, compared with 45 percent of adults who never finished high school. Voter participation is higher for white-collar workers than for blue-collar ones. In 1996, 70 percent of managers and professionals voted, compared with just 38 percent of semi-skilled and unskilled laborers.
Homeowners are more likely to vote than renters (62 percent vs. 36 percent in 1996).
Voting is higher among persons in upper income brackets than in lower brackets. Among adults in families with incomes of at least $50,000, 70 percent voted in 1996, compared with 33 percent of adults with family income less than $10,000.

Citations
U.S. Census Bureau, “Voting and Registration in the Election of November 1996 (Detailed Tables),” Current Population Reports P20-504u: table 2. Accessed online at www.census.gov/population/www/socdemo/voting.html on Aug. 1, 2000.
