65 Search Results Found For : "infographic"


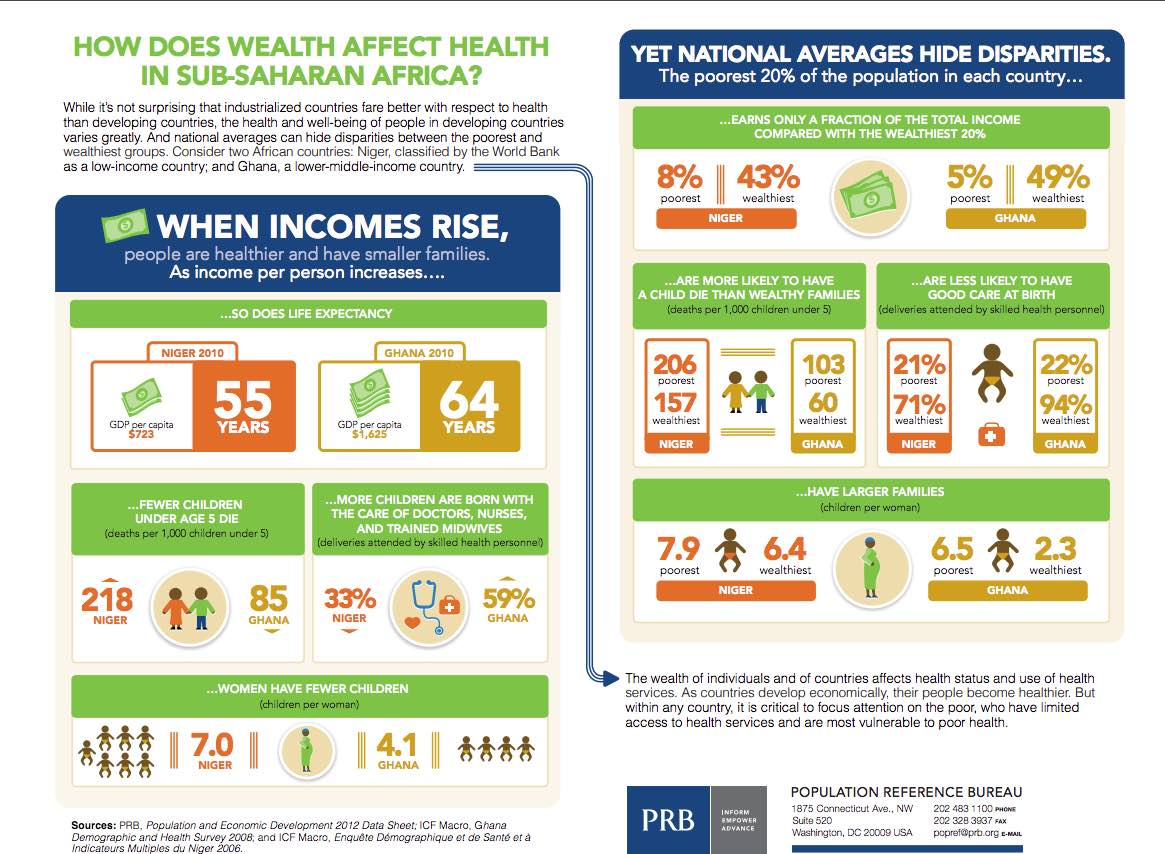
Infographic. How Does Wealth Affect Health in Sub-Saharan Africa? A PRB Infographic

View Details Array ( [ID] => 15282 [id] => 15282 [title] => 03282012-pop_econ_infographic_print [filename] => 03282012-pop_econ_infographic_print.pdf [filesize] => 619263 [url] => https://www.prb.org/wp-content/uploads/2012/03/03282012-pop_econ_infographic_print.pdf [link] => https://www.prb.org/resources/how-does-wealth-affect-health-in-sub-saharan-africa-a-prb-infographic/03282012-pop_econ_infographic_print-2/ [alt] => [author] => 15 [description] => [caption] => [name] => 03282012-pop_econ_infographic_print-2 [status] => inherit [uploaded_to] => 15270 [date] => 2021-01-31 18:29:41 [modified] => 2021-01-31 18:29:41 [menu_order] => 0 [mime_type] => application/pdf [type] => application [subtype] => pdf [icon] => https://www.prb.org/wp-includes/images/media/document.png ) Download (0.6 MB)

Infographic. ‘The Faces of Unmet Need’ A PRB Infographic

View Details Array ( [ID] => 15350 [id] => 15350 [title] => 07102012-unmet-need-infographicPRB-1 [filename] => 07102012-unmet-need-infographicPRB-1.pdf [filesize] => 2202511 [url] => https://www.prb.org/wp-content/uploads/2021/01/07102012-unmet-need-infographicPRB-1.pdf [link] => https://www.prb.org/resources/the-faces-of-unmet-need-a-prb-infographic/07102012-unmet-need-infographicprb-1-2/ [alt] => [author] => 15 [description] => [caption] => [name] => 07102012-unmet-need-infographicprb-1-2 [status] => inherit [uploaded_to] => 15346 [date] => 2021-01-31 20:01:13 [modified] => 2021-01-31 20:01:13 [menu_order] => 0 [mime_type] => application/pdf [type] => application [subtype] => pdf [icon] => https://www.prb.org/wp-includes/images/media/document.png ) Download (2.2 MB)

Female Genital Mutilation/Cutting: Data and Trends Update 2014 – Infographic

(2014) This infographic highlights key data and trends from PRB's datasheet, Female Genital Mutilation/Cutting: Data and Trends Update 2014. The infographic explains what female genital mutilation/cutting (FGM/C) is; who is affected by the practice; where the practice is still present; progress toward ending FGM/C; and lessons learned from 20 years of interventions.

View Details Array ( [ID] => 18718 [id] => 18718 [title] => fgmc-infographic-2014 [filename] => fgmc-infographic-2014.pdf [filesize] => 840474 [url] => https://www.prb.org/wp-content/uploads/2014/02/fgmc-infographic-2014.pdf [link] => https://www.prb.org/resources/female-genital-mutilation-cutting-data-and-trends-update-2014-infographic/fgmc-infographic-2014/ [alt] => [author] => 15 [description] => [caption] => [name] => fgmc-infographic-2014 [status] => inherit [uploaded_to] => 15722 [date] => 2021-02-25 01:14:34 [modified] => 2021-02-25 01:14:34 [menu_order] => 0 [mime_type] => application/pdf [type] => application [subtype] => pdf [icon] => https://www.prb.org/wp-includes/images/media/document.png ) Download (0.8 MB)

Infographic. Female Genital Mutilation/Cutting: Data and Trends Update 2014 (PDF)

(2014) This infographic highlights key data and trends from PRB's datasheet, Female Genital Mutilation/Cutting: Data and Trends Update 2014. The infographic explains what female genital mutilation/cutting (FGM/C) is; who is affected by the practice; where the practice is still present; progress toward ending FGM/C; and lessons learned from 20 years of interventions.

View Details Array ( [ID] => 18718 [id] => 18718 [title] => fgmc-infographic-2014 [filename] => fgmc-infographic-2014.pdf [filesize] => 840474 [url] => https://www.prb.org/wp-content/uploads/2014/02/fgmc-infographic-2014.pdf [link] => https://www.prb.org/resources/female-genital-mutilation-cutting-data-and-trends-update-2014-infographic/fgmc-infographic-2014/ [alt] => [author] => 15 [description] => [caption] => [name] => fgmc-infographic-2014 [status] => inherit [uploaded_to] => 15722 [date] => 2021-02-25 01:14:34 [modified] => 2021-02-25 01:14:34 [menu_order] => 0 [mime_type] => application/pdf [type] => application [subtype] => pdf [icon] => https://www.prb.org/wp-includes/images/media/document.png ) Download (0.8 MB)

Understanding Population Projections Infographic

(2014) This infographic uses three main projections produced by the UN Population Division to illustrate how assumptions can produce significantly different results over time.

View Details

Project: Demography and Economics of Aging and Alzheimer’s Disease

Infographic: Neighborhood Features Play a Role in Healthy Aging in Place

Research finds that a neighborhood’s physical features may be related to older residents’ health and ability to age in place. The infographic (based on Today's Research on Aging Issue 35) provides an overview of recent research on links between the physical environment and age-related disease.

View Details

Project: Demography and Economics of Aging and Alzheimer’s Disease

Infographic: U.S. Aging and Dementia Trends

The share of older Americans with dementia is decreasing, but the total number will rise as the large baby boomer population ages and more people live longer. While education gives older adults an edge, reducing their dementia risk, racial and socioeconomic disparities in dementia are large.

View Details Array ( [ID] => 2117 [id] => 2117 [title] => 061518_NIA_Dementia_Infographic [filename] => 061518_NIA_Dementia_Infographic.pdf [filesize] => 2052200 [url] => https://www.prb.org/wp-content/uploads/2017/02/061518_NIA_Dementia_Infographic.pdf [link] => https://www.prb.org/resources/neighborhood-features-aging-and-dementia-trends/061518_nia_dementia_infographic/ [alt] => [author] => 15 [description] => [caption] => Infographic: U.S. Aging and Dementia Trends The share of older Americans with dementia is decreasing, but the total number will rise as the large baby boomer population ages and more people live longer. While education gives older adults an edge, reducing their dementia risk, racial and socioeconomic disparities in dementia are large. [name] => 061518_nia_dementia_infographic [status] => inherit [uploaded_to] => 2111 [date] => 2020-10-16 14:31:29 [modified] => 2020-10-16 14:32:22 [menu_order] => 0 [mime_type] => application/pdf [type] => application [subtype] => pdf [icon] => https://www.prb.org/wp-includes/images/media/document.png ) Download (2.0 MB)

Project: Demography and Economics of Aging and Alzheimer’s Disease

U.S. Retirement Challenges Infographic

(2014) This infographic highlights U.S. retirement challenges.

View Details Array ( [ID] => 13787 [id] => 13787 [title] => social-security-infographic-1 [filename] => social-security-infographic-1-scaled.jpg [filesize] => 209466 [url] => https://www.prb.org/wp-content/uploads/2021/01/social-security-infographic-1-scaled.jpg [link] => https://www.prb.org/resources/u-s-retirement-challenges-infographic/social-security-infographic-1/ [alt] => [author] => 15 [description] => [caption] => [name] => social-security-infographic-1 [status] => inherit [uploaded_to] => 13785 [date] => 2021-01-24 22:22:35 [modified] => 2021-01-24 22:22:35 [menu_order] => 0 [mime_type] => image/jpeg [type] => image [subtype] => jpeg [icon] => https://www.prb.org/wp-includes/images/media/default.png [width] => 460 [height] => 2560 [sizes] => Array ( [thumbnail] => https://www.prb.org/wp-content/uploads/2021/01/social-security-infographic-1-580x315.jpg [thumbnail-width] => 580 [thumbnail-height] => 315 [medium] => https://www.prb.org/wp-content/uploads/2021/01/social-security-infographic-1-scaled.jpg [medium-width] => 54 [medium-height] => 300 [medium_large] => https://www.prb.org/wp-content/uploads/2021/01/social-security-infographic-1-scaled.jpg [medium_large-width] => 460 [medium_large-height] => 2560 [large] => https://www.prb.org/wp-content/uploads/2021/01/social-security-infographic-1-scaled.jpg [large-width] => 184 [large-height] => 1024 [1536x1536] => https://www.prb.org/wp-content/uploads/2021/01/social-security-infographic-1-276x1536.jpg [1536x1536-width] => 276 [1536x1536-height] => 1536 [2048x2048] => https://www.prb.org/wp-content/uploads/2021/01/social-security-infographic-1-368x2048.jpg [2048x2048-width] => 368 [2048x2048-height] => 2048 [huge] => https://www.prb.org/wp-content/uploads/2021/01/social-security-infographic-1-scaled.jpg [huge-width] => 460 [huge-height] => 2560 [small] => https://www.prb.org/wp-content/uploads/2021/01/social-security-infographic-1-scaled.jpg [small-width] => 460 [small-height] => 2560 [tiny] => https://www.prb.org/wp-content/uploads/2021/01/social-security-infographic-1-scaled.jpg [tiny-width] => 460 [tiny-height] => 2560 [smaller] => https://www.prb.org/wp-content/uploads/2021/01/social-security-infographic-1-scaled.jpg [smaller-width] => 460 [smaller-height] => 2560 [smallest] => https://www.prb.org/wp-content/uploads/2021/01/social-security-infographic-1-416x2314.jpg [smallest-width] => 416 [smallest-height] => 2314 [blurry] => https://www.prb.org/wp-content/uploads/2021/01/social-security-infographic-1-204x1135.jpg [blurry-width] => 204 [blurry-height] => 1135 [banner_img] => https://www.prb.org/wp-content/uploads/2021/01/social-security-infographic-1-623x690.jpg [banner_img-width] => 623 [banner_img-height] => 690 [news_thumb] => https://www.prb.org/wp-content/uploads/2021/01/social-security-infographic-1-360x240.jpg [news_thumb-width] => 360 [news_thumb-height] => 240 [media_thumb] => https://www.prb.org/wp-content/uploads/2021/01/social-security-infographic-1-57x315.jpg [media_thumb-width] => 57 [media_thumb-height] => 315 [pullquote_thumb] => https://www.prb.org/wp-content/uploads/2021/01/social-security-infographic-1-335x300.jpg [pullquote_thumb-width] => 335 [pullquote_thumb-height] => 300 [team_thumb] => https://www.prb.org/wp-content/uploads/2021/01/social-security-infographic-1-265x270.jpg [team_thumb-width] => 265 [team_thumb-height] => 270 [team_small] => https://www.prb.org/wp-content/uploads/2021/01/social-security-infographic-1-360x360.jpg [team_small-width] => 360 [team_small-height] => 360 [pdf] => https://www.prb.org/wp-content/uploads/2021/01/social-security-infographic-1-170x245.jpg [pdf-width] => 170 [pdf-height] => 245 ) ) Download (0.2 MB)

World Vasectomy Day: Male Engagement Infographic

Engaging men as clients, partners, and agents of change can increase family planning use, improve health outcomes for men and women, strengthen families and communities, advance gender equality, and transform gender norms.

View Details

Infographic: How Are U.S. Baby Boomers Getting Along?

(2015) The U.S. baby-boom generation (people born from 1946 to 1964) is the biggest generation in U.S. history, making up close to 25 percent of the total population in 2013. This infographic illustrates data on how these baby boomers are faring as they age into retirement.

View Details Array ( [ID] => 13809 [id] => 13809 [title] => infographic-baby-boomers [filename] => infographic-baby-boomers.png [filesize] => 518521 [url] => https://www.prb.org/wp-content/uploads/2015/01/infographic-baby-boomers.png [link] => https://www.prb.org/resources/infographic-how-are-u-s-baby-boomers-getting-along/infographic-baby-boomers/ [alt] => [author] => 15 [description] => [caption] => [name] => infographic-baby-boomers [status] => inherit [uploaded_to] => 13802 [date] => 2021-01-24 23:04:59 [modified] => 2021-01-24 23:04:59 [menu_order] => 0 [mime_type] => image/png [type] => image [subtype] => png [icon] => https://www.prb.org/wp-includes/images/media/default.png [width] => 670 [height] => 2436 [sizes] => Array ( [thumbnail] => https://www.prb.org/wp-content/uploads/2015/01/infographic-baby-boomers-580x315.png [thumbnail-width] => 580 [thumbnail-height] => 315 [medium] => https://www.prb.org/wp-content/uploads/2015/01/infographic-baby-boomers.png [medium-width] => 83 [medium-height] => 300 [medium_large] => https://www.prb.org/wp-content/uploads/2015/01/infographic-baby-boomers.png [medium_large-width] => 670 [medium_large-height] => 2436 [large] => https://www.prb.org/wp-content/uploads/2015/01/infographic-baby-boomers.png [large-width] => 282 [large-height] => 1024 [1536x1536] => https://www.prb.org/wp-content/uploads/2015/01/infographic-baby-boomers-422x1536.png [1536x1536-width] => 422 [1536x1536-height] => 1536 [2048x2048] => https://www.prb.org/wp-content/uploads/2015/01/infographic-baby-boomers-563x2048.png [2048x2048-width] => 563 [2048x2048-height] => 2048 [huge] => https://www.prb.org/wp-content/uploads/2015/01/infographic-baby-boomers.png [huge-width] => 670 [huge-height] => 2436 [small] => https://www.prb.org/wp-content/uploads/2015/01/infographic-baby-boomers.png [small-width] => 670 [small-height] => 2436 [tiny] => https://www.prb.org/wp-content/uploads/2015/01/infographic-baby-boomers.png [tiny-width] => 670 [tiny-height] => 2436 [smaller] => https://www.prb.org/wp-content/uploads/2015/01/infographic-baby-boomers.png [smaller-width] => 670 [smaller-height] => 2436 [smallest] => https://www.prb.org/wp-content/uploads/2015/01/infographic-baby-boomers-416x1513.png [smallest-width] => 416 [smallest-height] => 1513 [blurry] => https://www.prb.org/wp-content/uploads/2015/01/infographic-baby-boomers-204x742.png [blurry-width] => 204 [blurry-height] => 742 [banner_img] => https://www.prb.org/wp-content/uploads/2015/01/infographic-baby-boomers-670x690.png [banner_img-width] => 670 [banner_img-height] => 690 [news_thumb] => https://www.prb.org/wp-content/uploads/2015/01/infographic-baby-boomers-360x240.png [news_thumb-width] => 360 [news_thumb-height] => 240 [media_thumb] => https://www.prb.org/wp-content/uploads/2015/01/infographic-baby-boomers-87x315.png [media_thumb-width] => 87 [media_thumb-height] => 315 [pullquote_thumb] => https://www.prb.org/wp-content/uploads/2015/01/infographic-baby-boomers-335x300.png [pullquote_thumb-width] => 335 [pullquote_thumb-height] => 300 [team_thumb] => https://www.prb.org/wp-content/uploads/2015/01/infographic-baby-boomers-265x270.png [team_thumb-width] => 265 [team_thumb-height] => 270 [team_small] => https://www.prb.org/wp-content/uploads/2015/01/infographic-baby-boomers-360x360.png [team_small-width] => 360 [team_small-height] => 360 [pdf] => https://www.prb.org/wp-content/uploads/2015/01/infographic-baby-boomers-170x245.png [pdf-width] => 170 [pdf-height] => 245 ) ) Download (0.5 MB)