Capturing COVID’s Impact on the American Community Survey Across Counties
The COVID-19 pandemic greatly disrupted data collection for the American Community Survey (ACS) in 2020. In several months, no survey mailings went out, and the U.S. Census Bureau had to make dramatic changes to how they reached out to nonresponding households. As a result of these disruptions, 2020 saw fewer completed ACS interviews than other years.
Those who did respond to the ACS also differed in important ways from respondents in a typical year. Respondents in 2020 had higher levels of education and income and were more likely to be married than respondents in prior years. The Census Bureau addressed these differences through a series of methodological adjustments to reduce bias in the 2020 estimates.
Although the Census Bureau could adjust the data to mitigate bias in who did (or did not) respond, it could not overcome the fact that the 2020 survey received dramatically fewer responses overall. Nationwide, there were 1.4 million final interviews in 2020—down from 2.1 million in 2019—a drop of nearly one-third. (“Final interviews” refers to all ACS interviews of housing units conducted by internet, mail, or personal visits.) Because of concerns about nonresponse, the Census Bureau decided not to release standard 1-year ACS data products for 2020.
The effects of the dip were somewhat less pronounced in the 5-year ACS (which pools data from 2016-2020), and the Census Bureau released those estimates in March 2022. In the 5-year ACS, the average county saw an 8.4% decline in final interviews.
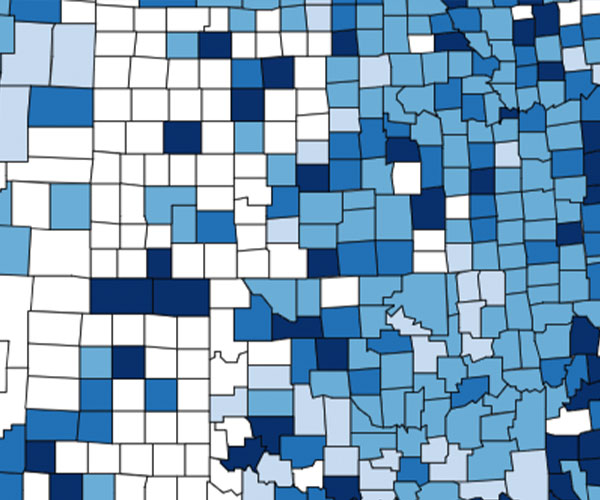
Census Bureau statisticians note that certain areas may have been more—or less—affected, “depending on how hard they were hit by the [pandemic-related] stay-at-home orders in 2020.” To assess this claim, we created a county map to look for patterns in final interview completion across the country. Which counties saw the biggest declines in the number of final interviews between survey periods 2015-2019 and 2016-2020?
Given that the pandemic was behind many of the survey disruptions, we hypothesized that areas with strict lockdown measures would see the biggest drops in final interviews. But after reviewing the data, we found that California and Florida—states with very different responses to the pandemic—experienced similar changes across counties. Rural areas experienced the largest drops, with Hickory County, Mississippi; Hale County, Alabama; and Kusilvak Census Area, Alaska, taking the top spots—each with at least 20% declines in the number of final interviews. West Virginia counties took four of the top 10 spots for largest decline.
10 Counties With Largest Percentage Declines in Final Interviews
County | Number of Final Interviews, 2015-2019 | Number of Final Interviews, 2016-2020 | Percent Change |
|---|---|---|---|
Hickory County, Missouri | 1,043 | 826 | -20.8 |
Hale County, Alabama | 1,372 | 1,094 | -20.3 |
Kusilvak Census Area, Alaska | 3,510 | 2,806 | -20.1 |
Taylor County, West Virginia | 1,324 | 1,067 | -19.4 |
Burke County, Georgia | 1,696 | 1,383 | -18.5 |
Pocahontas County, West Virginia | 1,066 | 872 | -18.2 |
Barbour County, West Virginia | 1,490 | 1,228 | -17.6 |
Fleming County, Kentucky | 1,434 | 1,191 | -16.9 |
Hendry County, Florida | 1,824 | 1,515 | -16.9 |
McDowell County, West Virginia | 1,776 | 1,478 | -16.8 |
Note: For this analysis, we excluded counties with fewer than 1,000 interviews in 2015-2019, which were more likely to see large percent declines in final interviews.
Source: U.S. Census Bureau, Table B98003, accessed at data.census.gov.
Several counties spanning the Navajo Nation also saw steep declines in final interviews, including McKinley County, New Mexico (down 14.0%) and Navajo County, Arizona (down 12.7%).
The biggest numeric declines were, unsurprisingly, in some of the largest counties (Maricopa County, Arizona; Los Angeles County, California; Cook County, Illinois; Kings County, New York; and Harris County, Texas). There were 159,000 fewer final interviews across these five counties in 2016-2020, compared with 2015-2019.
Given these changes, ACS data users should expect to see somewhat larger margins of error in the 2016-2020 ACS data than they have seen in prior years.
Note: For this analysis, we excluded counties with fewer than 1,000 interviews in 2015-2019, which were more likely to see large percent declines in final interviews. Data from Puerto Rico were also excluded but are available through Table B98003 at data.census.gov.
Related Posts
Newly Unveiled Plans for the 2030 Census Test Suggest Trouble Ahead
Here are four big reasons why we're worried—and why you should be too.

Five Things You Can Do to Protect Public Data
Even small actions, taken together, can help strengthen the case for the importance of public data to our shared future.
How Accurate Was the 2020 Census—and Why Should You Care?
Significant undercounts in the 2020 Census could have serious consequences for underrepresented groups and individual states.
How Will We Measure the Accuracy of the 2020 Census?
Getting an accurate 2020 Census count is important because census numbers impact daily life in the United States in many ways.

Why Are They Asking That? What Everyone Needs to Know About 2020 Census Questions
By law, the U.S. government is required to count the number of people living in the United States every 10 years.