AZ-Hero-for-prb.org

Youth & NCD Digital Health Interventions

A library of research on how digital health interventions can engage youth in low- and middle-income countries to minimize their risks of noncommunicable diseases.

AstraZeneca Young Health Programme

This site presents summaries of research projects from low- and middle-income countries (LMICs) on the effectiveness of digital health interventions, such as apps, websites, and online games, in curbing the following key risk behaviors for noncommunicable diseases (NCDs) among youth: tobacco and alcohol use, unhealthy diet, and physical inactivity.

view site

Why Focus on NCDs and Young People?

NCDs, such as cancer, diabetes, and cardiovascular disease, are the leading causes of death worldwide. Premature deaths from NCDs, defined by the World Health Organization as occurring between ages 30 and 70, take place disproportionately in LMICs and affect individuals at the height of their economic productivity.

NCDs pose a major threat to the health of populations, place an increasing burden on health systems, and threaten economic growth and development. Prevention is therefore a critical priority for addressing the growing NCD epidemic. In addition, the Sustainable Development Goals call for reducing premature mortality from major NCDs by one-third by 2030. Early intervention that focuses on young people is key to reducing premature NCD mortality.

Over 80% of premature deaths from NCDs are due to cardiovascular diseases, cancers, diabetes, and chronic respiratory diseases. These NCDs share four key behavioral risk factors—tobacco use, harmful use of alcohol, physical inactivity, and unhealthy diet—that are all modifiable and typically begin or become habits in adolescence and young adulthood.

Today, there is a unique window of opportunity to curb the NCD epidemic before young people develop unhealthy behaviors and while many LMICs still have relatively young populations. By encouraging young people to adopt positive behaviors and limit negative ones as they gain autonomy over their lives, we can reduce premature deaths from NCDs and set youth on healthier paths into adulthood.

Why Study Digital Health Interventions for Youth in LMICs?

The opportunity to implement digital health interventions in LMICs is increasing as access to the internet expands globally, particularly for young people who access the internet at a higher rate than older age groups. While many digital health interventions addressing the risk behaviors among young people have been tried and evaluated in high-income countries, such interventions have been much less common in LMICs. What’s more, only a few have been evaluated and information about their evaluation is scattered.

About the Studies

The research presented on this site covers a range of digital platforms, including phone apps, text messaging, websites, social media platforms, and online games. Only interventions that specifically targeted young people within the age range of 10 to 24, or those with a study sample predominantly composed of young people were considered for inclusion. Studies were further limited to those that had samples large enough to assess the effectiveness of the interventions, and most were published in 2015 or later.

Many of the studies suffered from limitations, including small sample sizes, high attrition rates, short trial periods, and reliance on self-reporting, and very few were grounded in theoretical behavior change. Nevertheless, our summaries highlight a variety of efforts to use digital platforms to address NCD risk behaviors in youth, some of which have shown promising results, and help build a knowledge base for anyone working to develop, revise, or better understand such interventions to improve health outcomes and to reduce the growing NCD epidemic.

prb-hero

(April 2012) For some time now, Brazil, Russia, India, and China have been grouped together under the acronym BRIC. The BRICs are described as countries at the same stage of economic development, but not yet at the point where they would be considered more developed countries. The BRIC position argues that, since the four countries are “developing rapidly,” their combined economies could eclipse the collective economies of the current richest countries of the world by 2050.

The BRIC Economy

The combined 2010 gross national income of the BRICs was US$10.5 billion, 25 percent of the GNI of high-income countries (see table). In 2009, it was 15 percent of the world total. The BRICs rank quite high in terms of global GNIs and China has almost certainly overtaken Japan by now to claim the second spot.


Brazil, Russia, India, and China, Selected Indicators

Indicator Brazil Russia India China
Population mid-2011 (millions) 197 143 1,241 1,346
Population 2050 (millions) 223 126 1,692 1,313
Percent of population <age 15 25 15 33 17
Total fertility rate 1.9 1.6 2.6 1.5
Percent of population living <$US2/day 10 1 76 36
2010 gross national income (in billions)* $1,830 $1,404 $1,554 $5,721
2010 world rank for GNI 8 12 11 3
2010 gross national income per capita* $9,390 $9,910 $1,340 $4,260
GNI growth rate (%), 2009-2010 15.8 6.3 10.1 17.1

* Atlas method.
Sources: Population Reference Bureau; United Nations Population Division; International Labour Organisation; National Statistical Offices; and World Bank.


The picture changes dramatically when we consider the countries’ rank on GNI per capita. The size of their economies is largely a result of population size.The BRICs are among the top 10 countries in the world in population.

Will the BRIC economies really eclipse the world’s wealthier countries? Table 1 offers one way to quantify that possibility. The high GNI growth rates of China and India are partly due to the still relatively small size of their economies. As economies grow, we can expect rates of growth to decrease simply because the denominator, GNI, will grow. Let’s assume that the BRICs will average a 4 percent GNI growth rate for the next 40 years and the high-income countries will average 2 percent. That latter assumption, of course, posits that the current recession will end at some point. And, an assumption of 4 percent growth for the BRICs over such a long period is rather generous. Under that scenario, the combined income of the BRICs would rise from 25 percent of the high-income countries’GNI in 2009 to 49 percent in 2050. Not exactly an eclipse but significant growth nonetheless.

Age Structure and Fertility

Age is all-important for its effect on the size of the labor force. India remains a rather young country with 33 percent of its population below age 15. Brazil is not far behind at 25 percent, while China and Russia, due to their very low birth rates, have only 17 and 15 percent, respectively.

The population pyramids (age and sex structure) of all four BRIC countries are quite different, primarily a result of their different birth histories. Brazil and China are somewhat similar, reflecting their transition to low birth rates. Brazil’s total fertility rate (the average number of children per woman) is now at a low, industrialized-country level of 1.9 children per woman. India has also made considerable progress in its fertility transition, but its TFR is still about 2.6.


Age and Sex Structure of Brazil (2010) and Russia (2010)

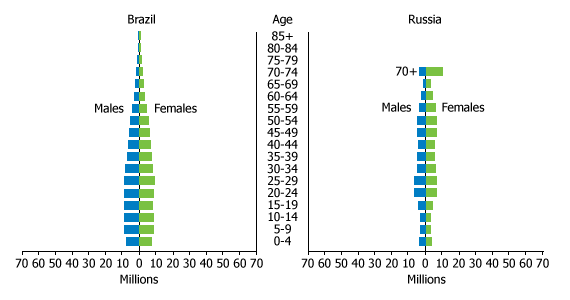
Sources: Brazil: United Nations; Russia: GOSKOMSTAT.


Age and Sex Structure of China (2010) and India (2011)

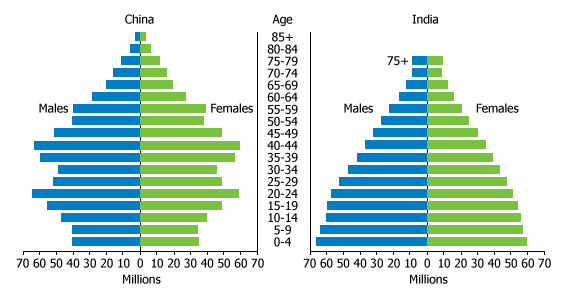
Sources: China: IDB; India: PRB/PFI projections.


China and Russia present two unusual age structures. China’s jagged pyramid results from a number of factors: mass deaths, social disruption, and the country’s “one-child” policy, all of which affected the population structure. In Russia, the economic disruption following the breakup of the USSR dropped the TFR below 1.2 in 1999, although it had risen to nearly 1.6 by 2010 (a rise that slowed in 2011). India is the “youngest” country of the group, and even by 2050, the 0-4 age group will be virtually equal to the 5-9 group.

Labor Force and Poverty

Both China and India still have substantial proportions of their labor force engaged in agriculture, but in India the proportion is a whopping two-thirds. In India, only about 7 million people work in the “organized” manufacturing sector (factories that register with the government and, supposedly, maintain records and pay workers required benefits). These workers, however, account for about two-thirds of manufacturing output while earning a comparatively high wage equivalent to US91 cents per hour in 2006.1 The great majority of India’s labor force of 400 million work in the unorganized sector, where work varies from casual day labor to work in small shops and fabrication facilities and for which comparable labor force data are not available.

The large proportion of the population living in poverty—abject poverty—is often overlooked. The World Bank estimates that 76 percent of the population in India lives on less than US$2 per day, compared to 36 percent in China. Over 900 million people living in poverty in India, most with little effective education, are not likely to share in the prosperity enjoyed by a few and are not likely to form the basis for an exploding consumer market anytime soon. China’s future is difficult to foresee in that it now faces unaccustomed population aging should it not relax its stringent one-child policy. But China, unlike India, is one of the world’s largest exporters.

Of the four BRIC countries, Russia seems a true outlier. Despite an uptick in the birth rate, it still had 130,000 more deaths than births in 2011, primarily due to a decrease of 106,000 deaths in 2011 from the 2010 level. It had reported nearly 1 million more deaths than births in 2000. Childbearing among women ages 20 to 29 and the number of women moving into those ages will diminish sharply over the next 20 years, even with some offsetting effects of immigration.

Potential

Several things need to happen for the BRICs to reach their advertised potential. In India, a massive campaign to provide potential workers with education and training will be required. The government is trying to tackle this daunting task but provincial politics can be a major obstacle. As an official from the impoverished state of Bihar once commented to me regarding the demographic dividend in his state, “Having a huge amount of illiterate people is not an advantage!” Relaxed regulations in the early 1990s for foreign investments jump-started the Indian economy. Will China follow? China has a clearly disadvantageous demographic profile, and may need to alter it through immigration or by allowing the birth rate to rise? At the very least, Russia will likely have to rely on immigration to fill its labor force gaps. Finally, Brazil does have the appearance of a country whose economy has reached an advanced stage with a high per capita GNI. That said, the current world economic situation can too easily reshape the very different societies of the BRICs.


Carl Haub is a senior demographer at the Population Reference Bureau.


References

  1. Jessica R. Sincavage, Carl Haub, and O.P. Sharma, “Labor Costs in India’s Organized Manufacturing Sector,” Monthly Labor Review 133, no. 5 (2010): 3-22.
prb-hero

Rural Migrant Remittances May Protect Forests

(February 2012) Sprawling urban areas most obviously demonstrate the environmental impact of migration. Water scarcity, pollution, and lack of adequate housing are some of the more evident impacts of urban population growth. But migration also affects the environment of the communities from which the migrants come, and may actually protect forests. Recent research in the journal Population and Environment suggests that migrant remittances (earnings sent home) often shape household decisionmaking about land use at forest edges.

Migrant remittances have become a powerful social and economic force. According to the World Bank, remittances are expected to total over $350 billion in 2011, representing three times the size of official development assistance.1 Hans Timmer, director of the Bank’s Development Prospects Group, explains, “Despite the global economic crisis that has impacted private capital flows, remittance flows to developing countries have remained resilient, posting an estimated growth of 8 percent in 2011.”

As households in developing nations seek to diversify income sources and minimize risk, migration represents a common economic strategy—remittances often are essential to meet household needs. Less obvious, however, are the environmental implications of remittances. And these environmental effects are not commonly discussed within policy circles, perhaps because research on the remittance-land use connection is only beginning to yield an overarching story. New research clearly suggests that remittances are reshaping the ways in which agricultural households manage their local environments and land holdings.

Ecuador

Clark Gray, a researcher at the University of North Carolina at Chapel Hill, has undertaken extensive fieldwork in Ecuador to examine these associations. Migration is a prominent livelihood strategy in Ecuador. Since 1990, over 1 million Ecuadorians have emigrated, and international remittances represented 6.4 percent of the nation’s 2005 GDP.

In Gray’s study area of southern Loja province, households depend mostly on maize-centered small-farm agriculture, small-scale cattle ranching, and coffee-based agroforestry which allows for shade coffee production under the forest canopy. Still, the region’s agricultural productivity is marginal, suggesting that out-migration provides better options for income. Although out-migration might be linked with declining agricultural production (due to loss of farm labor), Gray found otherwise based on a survey of approximately 400 rural households. International migrant remittances are more often used to increase farm production through hired labor as well as through enhanced fertilizer use. In fact, “a doubling of international remittances led to a 7.4 percent increase in spending on chemical inputs,” explains Gray.2 In this setting, migrant remittances can intensify agricultural production on existing land and reduce pressure to expand cropland into forests.

Brazilian Amazon

Other research on the remittance-land use connection has been undertaken in the Brazilian Amazon. Leah VanWey, a Brown University researcher, has studied land use decisionmaking among Amazonian households for decades. Her work has primarily focused on small-farm families in Altamira, Para, Brazil, initially settled in the 1970s as a result of the TransAmazon highway.3

Agricultural-based livelihood strategies characterize this region. Households plant subsistence annual food crops—manioc, beans, and rice— mostly for personal consumption. Other strategies include raising cattle for regional markets, although many years are required to create pasture from forest. Perennial cash crops, especially cacao, are also common. These cash crops, destined for international markets have the highest income return, but substantial savings or access to credit are needed to purchase sufficient seedlings. Cacao also has a long maturation time—often 10 years to peak production.

Migrants from the region tend to come from households with plentiful labor, so the loss in farm help doesn’t typically reduce agricultural production. Instead, migrant remittances encourage investment in capital-intensive perennial production, mostly cacao, in place of clearing forest for pasture (see figure). VanWey and her collaborators conclude that providing migrant income opportunities and promoting capital-intensive crops where possible “has the potential to protect forest and improve rural livelihoods.”


Property in Perennials and Pasture, by Migrants Sending Remittances


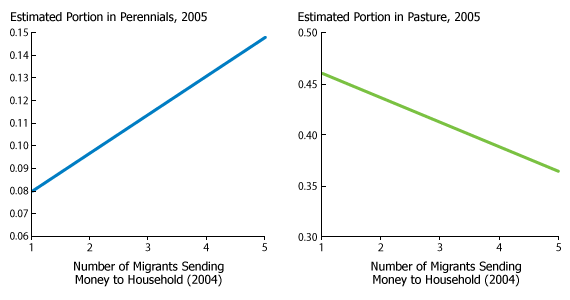
Source: Adapted from Leah K. VanWey, Gilvan R. Guedes, and Alvaro O. D’Antona, “Out-Migration and Land-Use Change in Agricultural Frontiers: Insights From the Altamira Settlement Project,” Population and Environment (online, Dec. 6, 2011).


Guatemala and Mexico

A slightly different dynamic plays out in the highlands of Guatemala. Based on ethnographic case studies in two rural communities, University of California-Santa Barbara researchers Jason Davis and David Lopez-Carr find that remittances are primarily used for new home construction and educational expenses, although hiring agricultural labor and using fertilizers are also common. In fact, although overall levels of household consumption may rise, agriculturally productive areas may actually shrink because aging parents tend to use the remittances to purchase food as a substitute for on-farm food production.4

Still, the protection or regrowth of local forest may come with a cultural cost. Scholars James P. Robson and Prateep K. Nayak argue that migration can “facilitate deep-seated change in traditional ways of life, whereby migrants (and their families) become disconnected from both resource practices and the institutions of the home (or sending) community.”5 In their rural Mexican study site, migration is associated with a decline in subsistence agriculture and an increased dependence on the marketplace for food and other necessities. In fact, their research suggests that between 50 percent and 60 percent of traditional agricultural lands have been abandoned over the past 30 to 40 years. Although such abandonment means forest regrowth, the researchers lament the loss of community and traditional natural resource management institutions.6

In absolute numbers, international migration is at an all-time high. And remittances to developing countries are expected to continue increasing at a rate of 7 percent to 8 percent annually, potentially reaching $441 billion by 2014. Although migration’s impacts may be most obvious in migrant destinations, these remittances alter socioeconomic and environmental patterns and processes in origin areas as well, but may help protect forests.7


Lori Hunter is an associate professor of sociology, Institute of Behavioral Science, Programs on Population, Environment and Society, at the University of Colorado, Boulder. She is also editor-in-chief of Population and Environment. This article is part of PRB’s CPIPR project, funded by a grant from the Eunice Kennedy Shriver National Institute of Child Health and Human Development. Hunter is liaison from the University of Colorado’s Population Center to CPIPR. Other NICHD-funded researchers who are highlighted in this article are Clark Gray, University of North Carolina, Chapel Hill; and Leah VanWey, Brown University.


References

  1. Sanket Mohapatra, Dilip Ratha, and Ani Silwal, Migration and Development Brief 17 (2011).
  2. Clark L. Gray, “Rural Out-Migration and Smallholder Agriculture in the Southern Ecuadorian Andes,” Population and Environment 30, no. 4-5 (2009): 193-217.
  3. Leah K. VanWey, Gilvan R. Guedes, and Alvaro O. D’Antona, “Out-Migration and Land-Use Change in Agricultural Frontiers: Insights From the Altamira Settlement Project,” Population and Environment (online, Dec. 6, 2011).
  4. Jason Davis and David Lopez-Carr, “The Effects of Migrant Remittances on Population-Environment Dynamics in Migrant Origin Areas: International Migration, Fertility, and Consumption in Highland Guatemala,” Population and Environment 32, no. 4-5 (2010): 216-37.
  5. James P. Robson and Pareet K. Nayak, “Rural Out-Migration and Resource Dependent Communities: Lessons From Mexico and India,” Population and Environment 32, no. 4-5 (2010): 263-84.
  6. James P. Robson and Fikret Berkes, “Exploring Some of the Myths of Land Use Change: Can Rural to Urban Migration Drive Declines in Biodiversity?” Global Environmental Change 21, no. 3 (2011): 844-54.
  7. For more information, see: Clark L. Gray, “Gender, Natural Capital, and Migration in the Southern Ecuadorian Andes,” Environment and Planning 42, no. 3 (2010): 678-96; Eric F. Lambin and Patrick Meyfroidt, “Global Land Use Change, Economic Globalization, and the Looming Land Scarcity,” Proceedings of the National Academies of Sciences of the United States of America (PNAS) 108, no. 9 (2011): 3465-72; Philip Martin, “Remittances and the Recession’s Effects on International Migration” (2011), accessed at www.prb.org/Articles/2011/international-migration-recession-remittances.aspx, on Jan. 30, 2012; and Population Reference Bureau, “Human Population: Migration” (2009), on Jan. 30, 2012.
prb-hero

Half of men ages 18 to 70 who participated in a study of genital human papillomavirus (HPV) in Brazil, Mexico, and the United States were infected with some form of the virus, according to the “HPV in Men” (HIM) study recently published in The Lancet.1 Anna Giuliano, of the H. Lee Moffitt Cancer Center, and her colleagues screened 4,074 men from the general population, universities, and organized health care systems in southern Florida; Sao Paulo, Brazil; and Cuernavaca, Mexico. The researchers studied the natural history of HPV infections to get a snapshot of how they affect men.

HPV is a group of more than 150 types of related viruses—of which more than 40 are sexually transmitted and can be spread very easily through genital contact with another person.2 Genital HPV is the most common sexually transmitted infection in the United States, currently affecting about 20 million Americans.3 According to the U.S. Centers for Disease Control and Prevention, HPV is so common that at least half of sexually active men and women get it at some point in their lives. But only one type, HPV-16, causes cancer in men, said Giuliano in an interview with NPR on March 4, 2011.4

Giuliano’s study reports on the first 1,159 men who participated in the study. At the time of enrollment, 50 percent of men were infected with genital HPV. “We were actually detecting 37 different types of HPV occurring—that could occur in men at the external genital skin. And we followed men prospectively so we could actually look at the rate at which men acquire these new infections, and the rate at which these infections are cleared,” she told NPR. She emphasized in the interview that the study was “a summary measure of all HPV types that were detected”—only some of the 37 HPV types cause cancer.

Different Types of Genital HPV

Some genital HPVs are high-risk, causing cancer and other diseases; others are low-risk, for example, those causing genital warts.5 About 15 high-risk viruses are factors in cancer of the cervix, vulva, vagina, anus, and head and neck in women; and contributors to cancers of the penis, anus, and head and neck in men (see Table 1). HPV infection accounts for 5 percent of all cancers worldwide. HPV-16 and HPV-18 together are linked to about 70 percent of cervical cancers. There is no simple screening to find HPV in men and no effective screening for noncervical cancers in men and women.6


Table 1
HPV-Related Cancer and Disease in the U.S.

HPV-Type Most Attributed Average Number of Men Affected Yearly Average Number of Women Affected Yearly
Anal Cancer 16 1,100 (2010) 2,700 (2009)
Cervical Cancer 16 & 18 n/a 11,000 (2011)
Genital Warts 6,11 1 in 100* (2011) 1 in 100* (2011)
Head and Neck Cancers 16 5,700 (2010) 2,300 (2009)
Penile Cancer 16 800 (2010) n/a
Vaginal Cancer 16 & 18 n/a 1,000 (2009)
Vulvar Cancer 16 & 18 n/a 3,700 (2009)

Note: *Of sexually active adults.
Sources: Centers for Disease Control (CDC), Genital HPV Infection Fact Sheet, Nov. 24, 2009, accessed at www.cdc.gov, on March 8, 2011; CDC, HPV and Men Fact Sheet, October 14, 2010, accessed at www.cdc.gov, on March 8, 2011; CDC, “HPV Vaccine: Questions and Answers” (April 6, 2011), accessed at www.cdc.gov/vaccines/vpd-vac/hpv/vac-faqs.htm, on May 16, 2011; Gypsyamber D’Souza et al., “Case-Control Study of Human Papillomavirus and Oropharyngeal Cancer,” The New England Journal of Medicine, May 10, 2007, accessed at www.nejm.org, on March 16, 2011; Maura L. Gillison, Anil K. Chaturvedi, and Douglas R. Lowy, “HPV Prophylactic Vaccines and the Potential Prevention of Noncervical Cancers in Both Men and Women,” Supplement to Cancer, Nov. 3, 2008, accessed at www.interscience.wiley.com, on March 18, 2011; Anna R. Giuliano et al., “Incidence and Clearance of Genital Human Papillomavirus Infection in Men (HIM): A Cohort Study,” The Lancet, March 1, 2011, accessed at www.thelancet.com, on March 7, 2011; and National Cancer Institute, Human Papillomaviruses and Cancer Fact Sheet, Dec. 13, 2010, accessed at www.cancer.gov, on March 14, 2011.


Men Clear HPV Infections Slower Than Women

HPV is a silent infection. Most people infected with HPV show no symptoms and can unknowingly transmit the virus to their sexual partners.7 In 90 percent of cases, the body’s immune system clears the infection on its own within two years. In the HIM study group, new HPV infections took an average of 7.5 months to clear (see Table 2). Men ages 18 to 30 require significantly longer than other age groups to clear any type of HPV infection—a phenomenon strongly associated with sexual behavior with female and male sexual partners. While women’s risk of HPV decreases with age, men appear to be at high risk of acquiring new HPV infections throughout their lives.


Table 2
HPV Infection in Men Ages 18-70, 2009

% Prevalence
Any HPV 50
Cancer-causing 30
HPV-16 6
HPV-18 2
Other 38
HPV-6 7
HPV-11 1

Source: Anna R. Giuliano et al., “Incidence and Clearance of Genital Human Papillomavirus Infection in Men (HIM): A Cohort Study,” The Lancet, March 1, 2011, accessed at http://www.thelancet.com, on March 7, 2011.


HPV Infection Can Be Prevented but not Cured

As with other sexually transmitted infections, the risk of getting or transmitting an HPV infection can be significantly reduced by always using a condom. In 2006, the FDA approved vaccines to protect girls and young women from being infected with common types of HPV. Gardasil and Cervarix protect against cancer-causing types 16 and 18, while Gardasil also protects against types 6 and 11 which cause genital warts. These vaccines lessen the risk of new infections; they do not cure existing ones.

While Gardasil has also been approved for boys and men ages 9 through 26, the vaccine is not on the CDC’s recommended immunization schedule for males in this age group. The reason: Studies suggest that the best way to prevent the most HPV-related disease is by vaccinating as many girls and women as possible.8 As of 2009, 17 percent of women ages 19 to 26 had received at least one dose of HPV vaccination. Among boys ages 11 to 17, less than 1 percent have been vaccinated, but the share of vaccinated men on college campuses is around 15 percent.9

While genital warts are not a health threat and do not lead to cancer, Dr. James C. Turner, a liaison to the government’s Advisory Committee on Immunization Practices, indicates that they are more than just a nuisance for those affected: “I would say that the men that I see would rate genital warts on the quality scale just above death,” Turner noted in a New York Times article.10


References

  1. Anna R. Giuliano et al., “Incidence and Clearance of Genital Human Papillomavirus Infection in Men (HIM): A Cohort Study,” The Lancet, March 1, 2011, accessed at www.thelancet.com, on March 7, 2011.
  2. National Cancer Institute, Human Papillomaviruses and Cancer Fact Sheet, Dec. 13, 2010, accessed at www.cancer.gov, on March 14, 2011.
  3. Centers for Disease Control (CDC), Genital HPV Infection Fact Sheet, Nov. 24, 2009, accessed at www.cdc.gov, on March 8, 2011.
  4. NPR, “Human Papillomavirus Infection and Cancer Risk” (March 4, 2011), accessed at www.npr.org, on March 7, 2011.
  5. American Cancer Society, “What Is HPV?” (Jan. 3, 2011), accessed at www.cancer.org, on March 18, 2011.
  6. CDC, HPV and Men Fact Sheet, October 14, 2010, accessed at www.cdc.gov, on March 8, 2011; and Maura L. Gillison, Anil K. Chaturvedi, and Douglas R. Lowy, “HPV Prophylactic Vaccines and the Potential Prevention of Noncervical Cancers in Both Men and Women,” Supplement to Cancer, Nov. 3, 2008, accessed at www.interscience.wiley.com, on March 18, 2011.
  7. CDC, HPV and Men Fact Sheet, October 14, 2010, accessed at www.cdc.gov, on March 8, 2011.
  8. CDC, “HPV Vaccine: Questions and Answers” (April 6, 2011), accessed at www.cdc.gov/vaccines/vpd-vac/hpv/vac-faqs.htm, on May 16, 2011.
  9. Gardiner Harris, “U.S. Panel Debates Value of HPV Vaccine for Boys” (Oct. 28, 2010), accessed at www.nytimes.com/2010/10/29/us/29vaccine.html, on March 7, 2011.
  10. CDC, “2009 Adult Vaccination Coverage, NHIS” (March 2, 2011), accessed at www.cdc.gov/vaccines/stats-surv/nhis/2009-nhis.htm, on May 16, 2011.
prb-hero

South American Transition to Low Fertility Spreads to Paraguay

(April 2010) Paraguay does not seem a likely candidate for rapid fertility decline: The population is poorer, more rural, and has lower educational levels than its neighboring countries. A large percentage of the population speaks Guarani, an indigenous language, rather than Spanish, the official language. Yet despite a large population that is traditionally hard to reach with reproductive health information and services, Paraguay recorded a remarkable increase in contraceptive use and a sharp decline in fertility over the past decade. A recent study of Paraguay’s fertility transition through 2004 documented a fall in the total fertility rate (TFR), or lifetime number of births per woman, from 4.3 in 1998 to 2.9 in the 2001-2004 period, and suggested continued decline because younger women said they wanted fewer children.1 A new survey seems to confirm that assertion, showing the TFR down to 2.5 children per woman by 2008, a faster decline than projected in the most recent United Nations’ population projection series.2 The percentage of married women ages 15 to 44 using contraception increased impressively, from 57 percent to 79 percent between 1998 and 2008.

There is a wide gap in TFRs between the more modern and educated populations and the more traditional population groups. The TFR was down to 2.2 children per woman among urban residents, while it was still 3.0 among rural residents in 2002. Similarly, Spanish-speaking women averaged just 2.2 children, compared with 3.3 among Guarani-speaking Paraguayans. The most dramatic differences were by education: Women with less than five years of education averaged 3.6 children, while those with at least 12 years of education averaged just 2.0 children.

Like many developing countries, Paraguay has seen rapid improvements in the education of girls in recent decades. Enrollment in elementary school is nearly universal, and data from UNESCO show the percentage enrolled in secondary school rising from 59 percent to 68 percent between 1999 and 2002, the most recent year statistics are available. This is well below the regional average of 92 percent, but a marked improvement in just a few years.3

Recent increases in the education of women in Paraguay have been tied to greater contraceptive use up through 2004. However, the 2008 survey shows that acceptance of contraceptive use has spread among all education levels. Even among women with less than three years of formal education, 72 percent used a contraceptive in 2008, compared with just 36 percent in 1998 (see Figure 1). Just as telling, the gap in contraceptive use between urban and rural women disappeared by 2008. While there are still clear rural and education differences in actual childbearing, it seems likely that those differences will abate further in coming years.


Figure 1
Increasing Contraceptive Use Among Paraguayan Women, 1998 to 2008

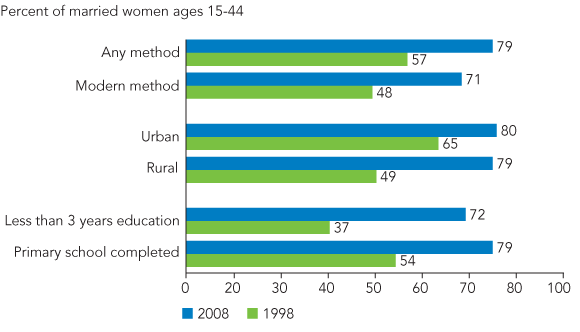
Source: El Centro Paraguayo de Estudios de Población et al., Paraguay Reproductive Health Survey 2008, CD-ROM.


Low Fertility in the Southern Cone

With the low and declining fertility documented in these new surveys, Paraguay joins its more urbanized and prosperous neighbors in South America’s southern cone in forming a low-fertility zone.

Brazil saw impressive declines in fertility since the mid-1990s, from about 2.5 children per woman to 1.8 according to the National Institute for Geography and Statistics (IBGE)—possibly the lowest in South America. Brazil’s fertility decline has been attributed to a shift in preferences for fewer children that some analysts tie to popular nighttime soap operas, or telenovelas, that reinforced the positive image of small families.4 Effective contraceptives are widely available, with sterilization (male and female combined) the most common method.5

Argentina has had relatively low fertility—below 3 children per couple—for decades, but the TFR only recently dropped close to the replacement level of 2.1 children per women (see Figure 2). Fertility has tracked even lower in Uruguay and Chile. Uruguay’s TFR is now at the two-child level, according to official birth statistics. Chile’s fertility declined close to replacement level by 2000, and is now about 1.9. While we do not have recent surveys of contraceptive use from these other countries, there is evidence that contraceptives are widely available and accepted.


Figure 2
Fertility Decline in Southern Cone Countries, 1990-95 to 2010

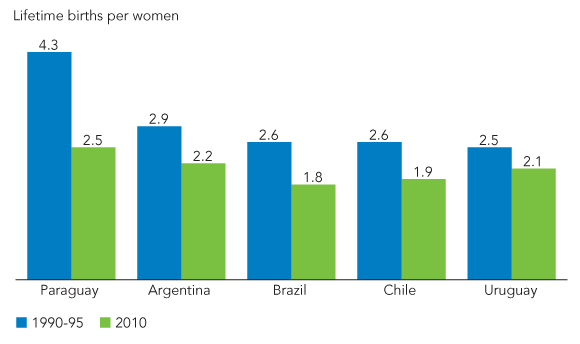
Sources: UN Population Division, World Population Prospects: The 2008 Revision; UN Statistics Division, UN Demographic Yearbook, 2006; Ministério da Saúde e Centro Brasileiro de Análise e Planejamento, Pesquisa Nacional de Demographfia e Saúde da Criança e da Mulher, 2006; El Centro Paraguayo de Estudios de Población et al., Paraguay Reproductive Health Survey 2008, CD-ROM.


Fertility Higher in Other South American Countries

While fertility rates have fallen throughout South America, they have not fallen as far in the more northern countries, especially in Bolivia, Ecuador, and Peru. Bolivia has among the region’s highest fertility, with a TFR of 3.5 according to a 2008 Demographic and Health Survey. Bolivia, with its large indigenous, non-Spanish speaking population, has the characteristics of a high-fertility country: lower educational levels, high poverty levels, a large rural population, and low use of modern contraceptives. The UN Population Division and the Center for Latin American and Caribbean Demography (CELADE) project modest fertility decline in Bolivia in the next two decades.

Fertility is expected to fall more rapidly in more economically developed and more urban countries of South America, including Colombia and Venezuela. They are projected to join the southern cone countries with replacement level fertility over the next decade. The major uncertainty is how fast fertility will fall, especially in areas that have lagged behind in economic and social development. The surprisingly rapid fertility decline in Paraguay shows how quickly things can change when young couples embrace the idea of smaller families and actively limit the number of children they have.


Mary Mederios Kent is senior demographic editor at the Population Reference Bureau.


References

  1. Kanako Ishida, Paul Stupp, and Mercedes Melian, “Fertility Decline in Paraguay,” Studies in Family Planning 40, no. 3 (2009): 227-34.
  2. El Centro Paraguayo de Estudios de Población et al., “Paraguay Reproductive Health Survey, 2008,” CD-ROM (Atlanta: Centers for Disease Control and Prevention, 2009).
  3. UNESCO, Institute for Statistics Data Centre, accessed at http://stats.uis.unesco.org,  on March 26, 2010. These figures are for the gross enrollment in secondary schools: the total number of secondary students of any age divided by the number of children of secondary-school age.
  4. Vilmar E. Faria and Joseph E. Potter, “Television, Telenovelas, and Fertility Change in Northeast Brazil,” in Dynamics of Values in Fertility Change, ed. Richard Leete (Oxford, England: Clarendon Press, 1999); and Eliana La Ferrara, Alberto Chong, and Suzanne Duryea, “Soap Operas and Fertility, Evidence From Brazil” (Inter-American Development Bank, 2008), accessed at www.iadb.org/res/files/WP-633updated.pdf,, on April 6, 2010.
  5. Ministério da Saúde e Centro Brasileiro de Análise e Planejamento, Pesquisa Nacional de Demografia e Saúde da Criança e da Mulher, 2006, accessed at http://bvsms.saude.gov.br/bvs/pnds/index.php,, on April 1, 2010.
prb-hero

Brazil's Fertility Falls Below Two-Child Average

(February 2009) Recent population estimates from Brazil’s national statistical office (IBGE) peg the national fertility rate at just 1.9 lifetime children per woman in 2007, lower than previous rates estimated by the UN, the U.S. Census Bureau, PRB, and other international organizations that estimate population measures. Notably, this new estimate is below the long-term replacement fertility rate of 2.1 children per woman—and below the 2.1 estimated for the United States in 2007.

Brazil does not have complete registration of births and has not had a national demographic and health survey since 1996, the usual data sources for national fertility estimates. But IBGE analyzed 2000 Census data, vital registration statistics, and household surveys and found evidence of a sharp fertility decline. These new estimates show the rate falling from 5.3 children per woman in 1970 to 2.8 in 1990, and a projected 1.8 by 2010. The rate levels off at 1.5 children per woman by 2030.

This sharp fertility decline in Latin America’s largest country has major implications for the region’s future population size, and signals significant population aging. Brazil’s population, nearly 190 million in 2008 in the new IBGE estimates, is projected to reach 216.4 million by 2030, and then slip to 215.3 million by 2050. While the total population is projected to decline slightly between 2030 and 2050, for example, the number of Brazilians ages 65 or older is expected to grow by 70 percent.


Mary Mederios Kent is senior demographic editor at the Population Reference Bureau.


References

Instituto Brasileiro de Geografia e Estatística (IBGE), Projeção da População do Brasil por Sexo e Idade—1980-2050: Revisão 2008 (2008), accessed online at www.ibge.gov.br/home/estatistica/populacao/projecao_da_populacao/2008/projecao.pdf, on Feb. 12, 2009.

IBGE, Projeção da População do Brasil: População Brasileira Envelhece em Ritmo Acelerado (Comunicação Social, Nov. 27, 2008), accessed online at www.ibge.gov.br, on Feb. 17, 2009.

UN Population Division, World Population Prospects: The 2006 Revision, Online Data, accessed online on Feb. 12, 2009; and UN Population Division, Worl Population Prospects: The 2008 Revision (forthcoming).

prb-hero

Forest Conservation and Population Growth Among Indigenous Peoples of the Amazon

(August 2008) Fertility has declined significantly throughout the developing world, and in Latin America total fertility rates (TFRs) have declined by 50 percent over the last three decades, from 5.0 births per woman in 1970 to only 2.5 today.1 Service providers have achieved many family planning and reproductive health (FP/RH) successes in Latin America, most notably the increase in modern contraceptive prevalence rates to 64.5 percent of sexually active women in 2007.2 These successes have led international health and development agencies to focus their attention on other regions that have yet to show similar improvements in reproductive health.

The successes in Latin America however, mask a great deal of regional variation. In countries such as Bolivia, Guatemala, and Haiti, total fertility rates, a measure of the average number of children a woman will have over her lifetime, are still nearly 4.0 or higher.3 Furthermore, in these countries, between 22 percent and 32 percent of women who do not desire another child or want to space their births still have no access to family planning services.4 Within the Latin American countries that have experienced substantial declines in fertility, there are sub-populations and regional pockets characterized by high fertility and lack of access to FP/RH services. Among those with the most limited access to basic reproductive health services are people living in the poorest and most remote communities—on the frontiers of lowland tropical forests like the Amazon and indigenous people living far beyond forest frontiers.

An analysis by the authors of regional and provincial data from Demographic and Health Surveys (DHS) show continued high fertility in the Amazon regions of several countries including Bolivia, Brazil, Colombia, Ecuador, and Peru (see Table 1). Total fertility rates are in most cases substantially higher than national rates: In Ecuador, fertility is higher in the Amazon than in any other region of the country. These averages mask substantially higher fertility in rural areas of the Amazon, which are almost unrepresented in DHS data. The DHS data for the Brazil North region, for example, contains only 14 rural observations. The DHS data from rural Amazon provinces of Colombia report no data. And fertility surveys from Ecuador do not report disaggregated rural data for the Amazon.


Table 1
Total Fertility Rates (TFR) for Select Areas of the Amazon Latin America

Country/year Provinces/regions in lowland areas TFR
Bolivia, 2003 National 3.8
Beni/Pando provinces 4.2
Brazil, 1996 National 2.5
North region 2.7
Central West region 2.3
Colombia, 2005 National 2.4
Amazonas province 2.8
Vaupes province 3.4
Guania province 2.9
Ecuador, 2004 National 3.3
Amazon region 4.2
Peru, 2004–06 National 2.4
Amazon region 3.4


Note: The total fertility rate (TFR) measures the total number of lifetime births a woman would have given current birth rates.
Sources: The TFRs for Bolivia, Brazil, Colombia, and Peru were obtained from Demographic and Health Survey (DHS) reports. The TFRs for Ecuador were obtained from the report for ENDEMAIN—a DHS-type survey conducted periodically by MEASURE and CEPAR.


Data on modern contraceptive prevalence rates for these same regions also reveal low rates of modern contraceptive use (see Table 2). The little rural data available suggest that contraceptive prevalence rates (CPR) among sexually active women of reproductive age are under 50 percent for the majority of the Amazon.


Table 2
Modern Contraceptive Prevalence Rates (CPR) for Select Amazon Tropical Forest Areas of Latin America


Country/Year Provinces/Regions in Lowland Areas Modern CPR (%)
Urban Rural
Bolivia, 2003 Beni/Pando provinces 53.9 45.0
Brazil, 1996 North region 69.0 44.4a
Central West region 80.0 76.4
Colombia, 2005 Amazonas province 55.0b – – – –d
Vaupes province 57.1b – – – –d
Guania province 65.3b – – – –d
Ecuador, 2004 Amazon region 65.3c – – – –c
Peru, 2004 06 Amazon region 53.4 33.7


a Rural North Region contains only 14 observations.
b Urban areas only.
c Women in unions. Rural and urban could not be disaggregated for Ecuador Amazon.
d Data not available.
Note: The total fertility rate (TFR) measures the total number of lifetime births a woman would have given current birth rates.
Sources: The CPR for Bolivia, Brazil, and Peru were calculated from Demographic and Health Survey (DHS) data and included women ages 15 to 49 who were currently married or in consensual union, and unmarried sexually active women. CPR for Columbia and Ecuador were obtained from the DHS and ENDEMAIN reports respectively.


Indigenous populations in lowland Latin America tend to be particularly underserved by health providers for many reasons, including cultural barriers, language, and accessibility. Available studies among these indigenous populations indicate TFRs from 7.0 to 8.0.5 Some researchers have argued that fertility rates among these indigenous women remain high because of a strong desire to have large families. However, survey data from indigenous women in the Ecuadorian Amazon contradict this argument, and indicate that approximately 50 percent do not want another child. Yet 98 percent of these women were not using a modern contraceptive method.6 While some might argue that the populations are too small to warrant attention from development agencies, the social and environmental implications of this growth are of great interest to the environmental community.


Conservation, Population, and Indigenous Peoples


Latin American tropical forests, including the Amazon basin, contain the world’s greatest concentration of biodiversity and play a critical role in climate change. More than two decades of conservation efforts have sought to decrease rates of deforestation in Latin American tropical forests. Despite these efforts, estimates of Amazon deforestation from 2002 to 2004 were near their highest levels since monitoring began in 1988, with an average of 2.5 million hectares annually.7 After three years of improvement, recent reports of deforestation during the last months of 2007 and first months of 2008 were the highest ever recorded for the wet season.8 The causes of this deforestation include underlying forces such as crop prices, land and forestry policies that encourage logging, and weak enforcement institutions at the national and global level. These forces drive local-level human activities such as agricultural expansion, timber extraction, and infrastructure growth that directly result in forest loss.9


In response, conservationists are seeking new strategies and new partners to protect the largest remaining tracts of tropical forest. Indigenous lands now encompass the single largest category of protected area in the Amazon, and 20 percent of the Amazon is now under the permanent rights of indigenous people. Indigenous lands are now touted as a critical barrier to future deforestation.10 Many of the largest conservation groups now work with indigenous groups, and international development agencies are beginning to finance conservation projects that work with indigenous groups. Central to the conservation objectives of these programs is the improved well-being of indigenous populations. Thus, indigenous communities and conservation organizations together should assess how demographic change will impact the health and livelihoods of indigenous households and the ecosystems in which they live.


The direct linkages between fertility and deforestation are often thought to be obvious (for example, more people leads to larger farms and thus more deforestation). In reality, however, the relationship between high fertility and land use has not been found to be as clear as is often stated. Research on the causes of tropical deforestation has found population growth to be a consistent underlying factor contributing to deforestation, though this growth is often due to migration and settlement of new colonists rather than high fertility rates.11 A more established link is the cyclical relationship between fertility and poverty, in which high fertility and poor maternal and child health outcomes are both symptoms of poverty and contributors to impoverishment, and affect the way people use, conserve, or overuse resources.


Changes in indigenous livelihoods are already evident at the household level, where increasing wage employment, market-based agriculture, and migration to cities have begun to replace traditional livelihoods of subsistence agriculture, hunting, fishing, and gathering of forest products. Less understood, however, are how demographic changes might affect the communal management groups that have traditionally managed agricultural lands, rivers, and forests. These communal management groups, for example, often make decisions regarding who can hunt, when they can hunt, and what they can hunt on indigenous lands. Now, these groups must confront the added challenges of greater external pressure from the growing population surrounding indigenous lands as well as greater internal pressure from their own growing populations.12


Role of Conservation Organizations


Over the last several years, a few conservation organizations have piloted projects that address the complex links between reproductive health, poverty, and conservation. These projects have adopted an integrated approach to community development that has been termed the Population, Health, and Environment (PHE) approach. The central tenets to this approach are first, that in many remote areas, conservation organizations are among the only institutions providing communities with development assistance; and second, providing men and women with health services and the opportunity to plan their families is beneficial both to the well-being of households and to the long-term sustainability of the forest, fishing, and hunting resources they manage.


The Population Reference Bureau’s PHE Program has been instrumental in developing the PHE approach by providing information to conservation organizations on the links between population, health, and environment, building the capacity of individuals and organizations to work on these cross-cutting issues, and encouraging institutions to form professional networks to share PHE experiences and lessons.


This approach, however, has principally been piloted in Africa and Asia because of the greater need for FP/RH services in these regions and, in part, because of the perception that most Latin American countries no longer need international assistance to provide FP/RH services.13 Furthermore, most Latin American ministries of health are just beginning to develop the capacity to procure and manage supply chains for contraceptives and have yet to focus on distribution of services to remote areas.14 Thus, despite the existence in Latin America of high-priority conservation areas with high unmet need for family planning, there is little indication that the next generation of PHE projects will focus on the unmet need of remote populations in Latin America.


Nonetheless, people in lowland areas of Latin America show an interest in and need for FP/RH services, and conservation organizations are among the few institutions building relationships with indigenous groups. There is, therefore, great opportunity for collaboration between health care providers and conservationists to better the welfare of indigenous peoples, a group typically underrepresented as benefactors of development in the Americas. Responding to this opportunity will require the creativity and commitment of the PHE community and the identification of new priority areas, new partners, and new sources of funding.


Jason Bremner is program director for Population, Health, and Environment at the Population Reference Bureau. Audrey Dorélien was a 2008 Bixby intern at PRB.


References


    1. United Nations Department of Economic and Social Affairs, World Population Prospects: The 2006 Revision (New York: United Nations, 2007).


    1. United Nations Department of Economic and Social Affairs, World Contraceptive Use 2007 (New York: United Nations, 2007).


    1. United Nations Department of Economic and Social Affairs, World Population Prospects: The 2006 Revision.


    1. United Nations Department of Economic and Social Affairs, World Contraceptive Use 2007.


    1. Kendra McSweeney and Shanha Arps, “A Demographic Turnaround—The Rapid Growth of Indigenous Populations in Lowland Latin America,” Latin American Research Review 40, no. 1 (2005): 3-29.


    1. Jason Bremner et al. “Fertility Beyond the Frontier: Indigenous Women, Fertility, and Reproductive Practices in the Ecuadorian Amazon,” Population Environment (forthcoming).


    1. Instituto Nacional de Pesquisas Espaciais, Annual Estimates of Deforestation 1988-2007, accessed online at www.inpe.br, on June 5, 2008.


    1. Alexei Barrionuevo, “Brazil Rainforest Analysis Sets Off Political Debate,” The New York Times, May 25, 2008.


    1. Helmut J. Geist and Eric Lambin, “Underlying Driving Forces of Tropical Deforestation,” Bioscience 52, no. 2 (2002): 143-50.


    1. Daniel Nepstad et al., “Inhibition of Amazon Deforestation and Fire by Parks and Indigenous Lands,” Conservation Biology 20, no. 1 (2005): 65-73.


    1. Geist and Lambin, “Underlying Driving Forces of Tropical Deforestation.”


    1. Jason Bremner and Flora Lu, “Common Property Among Indigenous Peoples of the Ecuadorian Amazon,” Conservation and Society 4, no. 4 (2006): 499-521.


    1. John Pielmeier et al., Assessment of USAID’s Population and Environment Projects and Programming Options (Washington, DC: United States Agency for International Development, 2007).


    1. Thais Aguilar, Safeguarding the Contraceptive Supply in Latin America in an Era of Donor Phase Out (Washington, DC: Population Reference Bureau, 2006.


prb-hero

Family Planning Policies and the Poor in Peru

(March 2008) Over the past two decades, the government of Peru has instituted a series of laws and policies designed to expand access to family planning services. A recent article in International Family Planning Perspectives notes that in practice, these policies have not always achieved their desired effect. Between 1996 and 2004, for example, a growing share of government family planning clients in Peru consisted of wealthier women. The share of government clients composed of women in the richest three-fifths of the population rose from 46 percent to 53 percent. And the percentage of clients that were from the poorest two-fifths dropped from 54 percent to 47 percent.


James N. Gribble, lead author of the article and director of the BRIDGE Project at the Population Reference Bureau, says the outcome is not surprising: “Policies aimed at promoting equity and serving the poor often ultimately benefit those who are better off, but not their intended target.”


Reference


James N. Gribble, Suneeta Sharma, and Elaine P. Menotti, “Family Planning Policies and Their Impacts on the Poor: Peru’s Experience,” International Family Planning Perspectives 33, no. 4 (2007): 176-81.

prb-hero

Fighting Air Pollution in Mexico City and São Paulo

(July 2007) Mexico City has some of the worst air pollution in the world. The city’s residents lose 2.5 million working days a year to health problems caused by particle matter, such as soot. Other Latin American capitals such as São Paulo, also rank among the world’s worst in terms of outdoor air pollution. Because increases in respiratory and cardiovascular illness and death have been linked to major air pollution, cities are taking steps to clear the air. To learn more about how these megacities have reduced air pollution levels with new policies and relatively simple technological fixes, go to: www.dcp2.org/features/47.

The Disease Control Priorities Project (DCPP) is an ongoing effort to assess disease control priorities and produce evidence-based analysis and resource materials to inform health policymaking in developing countries. DCPP has produced three volumes providing technical resources that can assist developing countries in improving their health systems and ultimately, the health of their people.

prb-hero

Domestic Violence in Developing Countries: An Intergenerational Crisis

(September 2004) A new comparative study using nationally representative information on domestic violence in nine developing countries finds that women whose fathers abused their mothers are twice as likely to suffer domestic abuse themselves.

The report, Profiling Domestic Violence: A Multi-Country Study, published by ORC Macro, also finds that domestic violence in these countries is highly correlated with a husband’s drunkenness and controlling behaviors. But the study did not find that a woman’s poverty, lack of education, or lack of decisionmaking control consistently elevate her risk of being abused.1

“Gender-based violence is a gender issue,” explains Kiersten Johnson, a co-author of the study and a researcher at ORC Macro. For example, the study found that women who shared the bulk of household decisions with their male partners were at a lower risk of abuse—regardless of their household’s income levels.

Domestic Violence is a Worldwide Problem

The report is based on data from the Demographic and Health Surveys (DHS) in nine developing countries: Cambodia, Colombia, Dominican Republic, Egypt, Haiti, India, Nicaragua, Peru, and Zambia. These surveys, conducted mostly after 1998, collected comprehensive demographic and health data from women ages 15 to 49. In addition, information was collected on “empowerment” indicators such as education, employment, and participation in household decisionmaking.

Researchers also asked the women about their experience of domestic violence throughout their adult lives, including detailed questions about their experience of physical, sexual, and emotional violence within their current relationships. The percentages of women who said an intimate partner had ever abused them ranged from 48 percent in Zambia and 44 percent in Colombia to 18 percent in Cambodia and 19 percent in India. (A 1998 Commonwealth Fund study put levels of similar violence in the United States at 31 percent.2)

More than one in six married women in each country that was studied reported being pushed, shaken, slapped, or targeted with a thrown object by their male partners. At least one in 10 has been threatened or publicly humiliated by their husbands.

Co-author Sunita Kishor, a senior gender specialist at ORC Macro, cautioned that survey questions differed across some of the countries, making absolute comparisons of domestic-abuse prevalence problematic. But Profiling Domestic Violence makes clear that domestic violence remains a problem in these nine countries—and that in at least several of them, women are socialized into accepting its legitimacy under some circumstances.

“Educated women tend to disagree [with the practice of domestic abuse] more, but it’s not as if you get a zero-level of disagreement even among them,” says Kishor. “In most countries, the gender-role norm violation that woman are most likely to agree with as deserving of a beating is a woman’s neglect of her children. This is very, very telling—there’s a huge buy-in to the care of children being a very fundamental duty of women.”

Culture of Violence ‘Akin to Second-Hand Smoke’

The wealth of data collected by DHS also enabled Kishor and Johnson to identify common global risk factors for domestic violence—all of which, they stress, are largely beyond a woman’s control.

“Often there’s this belief that you see in public discourse that women who are beaten are in some way to blame—they’re too fat or unattractive, for example,” says Johnson. “But it’s not any one characteristic or aspect of your life. Instead, there are multiple factors at the individual, husband, and family level—including your ‘inheritance’—that are dynamically interacting.”

By “inheritance,” Johnson means a woman’s experience as a child of her mother’s abuse. Such experience, Kishor says, has “tremendous intergenerational implications.”

“I don’t think enough attention is being paid to these matters,” says Kishor. “The data shows that even exposure to a mother’s experience of abuse, not just firsthand violence, almost doubles your risk [of being abused yourself]. It’s akin to the literature about secondhand smoke—even exposure to it can have ill-effects” (see Table 1).


Table 1
Percentages of ever-married women age 15-49 who experienced spousal violence ever and in the past 12 months, by whether their mother was ever beaten by their father

Family History Cambodia Colombia Dominican
Republic
Haiti Nicaragua Peru
Ever Experienced Spousal Violence
Father beat mother
No 15.2 36.1 20.0 27.0 27.4 35.8
Yes 29.7 55.4 36.3 37.8 36.6 50.0
Don’t know 20.7 46.5 27.9 32.1 35.4 46.3
Experienced Violence in the Past 12 Months
Father beat mother
No 13.1 u 9.2 20.5 11.4 u
Yes 28.1 u 21.6 33.2 17.2 u
Don’t know 17.7 u 18.2 22.8 15.5 u

u = Unknown (not available)
Note: Data not available for remaining three countries studied in report.


Profiling Domestic Violence also found that other common correlates of domestic abuse—besides having husbands who frequently get drunk or exhibit controlling behaviors (such as limiting her outside contact or repeatedly accusing her of infidelity)—include:

  • Being married more than once;
  • Being married young;
  • Having multiple children; or
  • Being older than your husband.

In addition, Kishor and Johnson found that many abused women in developing countries do not seek help, ranging from 41 percent in Nicaragua to 78 percent in Cambodia. And those who do reach out often contact people they know rather than health professionals.

Disempowerment and Violence: No Clear Connection

Surprisingly, several measures of female empowerment—employment, education, or attitudes related to gender equity, such as believing that women have the right to refuse sex to their husbands—did not directly correlate in the study with a reduced risk of abuse. And women who make most of their household’s decisions alone—such as whether to make large purchases or to have another child—were victims of domestic violence at the same rate as those with little say in the allocation of their family’s resources. Instead, the study found that women who made decisions jointly with their male partners suffered far less abuse.

“The causality is not clear from these data between increased risk of abuse for women who make most of the decisions alone,” Kishor says. “Is it because she is in such a dysfunctional relationship that she is forced into taking charge? Or is it because she’s taking the decisions alone that she’s actually being beaten?” This uncertainty, she adds, raises questions about conventional indices of empowerment.

“We need to be looking closely at a lot of these indicators and asking what they’re really telling us in different contexts,” Kishor says. “While empowerment usually implies that you are in control of your life, the data suggest that, within a marital context, ‘dominating’ [these] decisions may not equate to empowerment.”

The Health Consequences of Abuse

The study found clearer connections between abuse and degraded health for victimized women and their children. For instance, women in almost all the surveyed countries who had experienced abuse from their intimate partners had higher rates of unwanted births and nonlive births (by 33 percent to 72 percent) than those who had never been abused.

Women who experienced violence were also more likely to have had sexually transmitted infections, their pregnancies were substantially less likely to have received first-trimester antenatal care, and their children between the ages of 12 months and 35 months were less likely to have been fully vaccinated. The children of abused women were also more likely to die before age 5.

Both authors stress that including national domestic violence statistics alongside health and demographic information is a large step forward in addressing the roots of abuse.

“Up until recently, there wasn’t the kind of impetus or interest in this kind of data, or even the recognition of domestic violence as an issue of public health and development,” Johnson says. “It’s important to know that there are multiple factors involved, and thus multiple arenas in which interventions can occur.”


Robert Lalasz is a senior editor at PRB.


References

  1. Sunita Kishor and Kiersten Johnson, Profiling Domestic Violence: A Multi-Country Study (Columbia, MD: ORC Macro, 2004).
  2. Karen Scott Collins et al., Health Concerns Across a Woman’s Lifespan: The Commonwealth Fund 1998 Survey of Women’s Health, accessed at www.cmwf.org/usr_doc/Healthconcerns_surveyreport.pdf, on Sept. 14, 2004.

For More Information

Profiling Domestic Violence: A Multi-Country Study is available at www.measuredhs.com/pubs/pdf/OD31/DV.pdf.