

Collaborating for Action on the Future of Demographic and Health Surveys
This convening held on May 7-8, 2025, brought together key stakeholders—including leaders from National Statistical Offices, donor organizations, partner organizations, and data user groups—to identify opportunities and priorities for collaboration to protect current data and preserve ongoing data collection activities.
Date
June 25, 2025
Meeting Report
Since 1984, USAID has funded the Demographic and Health Surveys (DHS) Program to provide technical assistance to more than 400 surveys in over 90 countries. On February 24, 2025, the U.S. government terminated the DHS Program. In the aftermath of the termination, numerous efforts have emerged to mobilize action to sustain collection of high-quality demographic and health data through surveys. These efforts span a range of critical challenges, including preservation and accessibility of current data, completion of near-final surveys, and identifying long-term strategies to support future data collection. As multiple streams of effort have emerged, PRB organized a virtual global convening to support coordination and collaboration.
The convening brought together key stakeholders—including leaders from National Statistical Offices, donor organizations, partner organizations, and data user groups—to identify opportunities and priorities for collaboration to protect current data and preserve ongoing data collection activities. This event created a space to identify needs, gaps, opportunities, and emerging solutions; share efforts that are underway; and support ongoing coordination among stakeholders moving forward.
This meeting report summarizes the discussion and ideas shared in the convening. Each topic, objective, and related stakeholder discussion is presented, with little interpretation, to form a record of the conversation and ideas that arose. This report concludes with a summary of emerging next steps.
For questions about the report or to learn more about ways to engage ongoing dialogue on the future of the DHS, contact Kaitlyn Patierno (kpatierno@prb.org).

Fact Sheet: Trends in Family Care for Older Americans
In the United States, over 24 million people provide unpaid care for older adults—a 32% increase from a decade ago
Date
March 18, 2025
AUTHORS

Mark Mather
Associate Vice President, U.S. Programs

Paola Scommegna
Contributing Senior Writer
Focus Area
As the large Baby Boom generation enters advanced ages, more family members and other unpaid helpers are stepping in as caregivers. In just over a decade, the number of family caregivers regularly assisting older adults with daily activities at home grew by 32%, increasing from 18.2 million to 24.1 million between 2011 and 2022.1
While the caregiving cadre has grown, who’s getting care has also changed. Older Americans receiving family care are younger, better educated, and less likely to have dementia than they were in 2011, report Jennifer L. Wolff of Johns Hopkins University, independent consultant Jennifer C. Cornman, and Vicki A. Freedman of the University of Michigan.
The increase in family caregiving partly reflects the rising share of older adults with multiple chronic conditions, such as heart disease, hypertension, stroke, and cancer. And while the share of older adults with dementia has declined, unpaid caregivers average twice as many hours each week caring for people with dementia than without dementia (about 31 hours versus 14), Wolff and team found (see Figure 1).
In addition, a new study estimates that the number of new dementia cases will double over the next 40 years as the population ages—setting the stage for more demands on dementia caregivers and more changes to the caregiving landscape.
“Understanding the changing composition and experiences of family caregiving has never been more important, but it is challenging to assess,” the researchers write. “[It] requires consistent measurement for well-characterized, generalizable samples of people who receive and provide help.”
The nationally representative National Study of Caregiving and the National Health and Aging Trends Study offer important insights. The two studies provide a snapshot of the family caregivers that help Americans ages 65+ who live in the community (i.e., at home or with a relative) or in a residential care setting other than a skilled nursing facility, such as an assisted or independent living facility, a personal care home, or a continuing care retirement community.
Family caregivers include relatives and unpaid helpers, like neighbors and friends, who assist with personal care tasks like bathing and dressing; mobility tasks like getting out of bed and getting around the house; and household activities such as laundry, food preparation, shopping, and managing money.
Dementia Caregivers See Increasing Demands on Their Time, Employment Woes
On average, the time that family caregivers spent helping older adults with dementia increased by almost 50% over the decade, rising from 21.4 hours per week in 2011 to 31.0 hours in 2022. By contrast, time spent assisting older adults without dementia fell from 15.3 hours a week in 2011 to 13.9 hours in 2022 (Figure 1).
Figure 1: Family Caregivers Are Spending 50% More Time Caring for Older Adults With Dementia
Average Weekly Family Caregiving Hours, by the Dementia Status of Older Adults (65+), 2011 and 2022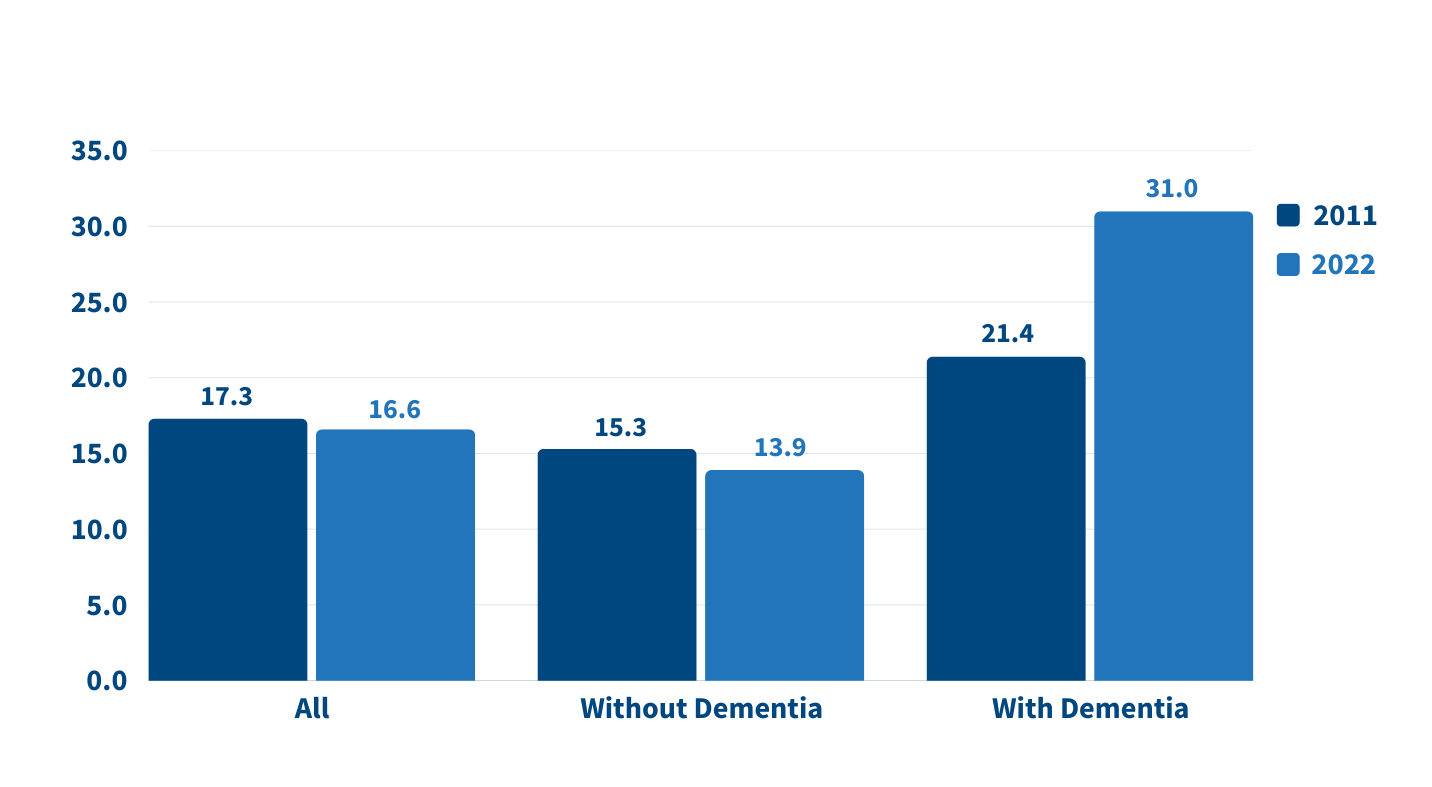
Source: Jennifer L. Wolff, Jennifer C. Cornman, and Vicki A. Freedman, “The Number of Family Caregivers Helping Older US Adults Increased From 18 Million to 24 Million, 2011–22,” Health Affairs 44, no. 2 (2025): 189-95.
People caring for older adults with dementia have high—and increasing—demands on their time. More than half (51.7%) of dementia caregivers lived with the person they were caring for in 2022, up from 39.4% in 2011, Wolff and team report. And the share able to hold jobs—outside their caregiving work—dropped from 42.5% to 34.6% during the same period.
Among caregivers with formal jobs, the share who reported challenges with their employment—including working fewer hours or being less productive—increased over the decade, regardless of whether they cared for someone for dementia.
“Challenges are exacerbated when caregivers are in poor health themselves; have a lack of choice in assuming the caregiving role; and, for the substantial proportion of family caregivers who are employed, work in low-wage jobs with limited flexibility,” the researchers note.
Care Recipients Are Mainly Older Women, but the Share of Men Receiving Care Is Growing
Which older Americans get family care? As in the past, they tend to be female, non-Hispanic white women who are married or widowed. But growing numbers of family care recipients are male and have some college education. More are also separated and divorced compared to 2011, reflecting national trends.
Adult Children Continue to Care for Their Parents
Who’s providing care? Family caregivers continue to be largely female and married, and most report being in good health. In 2022, adult children still made up the largest share of family caregivers for older adults, at 40.7%, but this represents a significant decline since 2011 (Figure 2).
Figure 2: The Share of Adult Children Caring for Older Relatives Has Declined
Relationship of Family Caregivers to Adults Ages 65 and Older Receiving Care, 2011 and 2022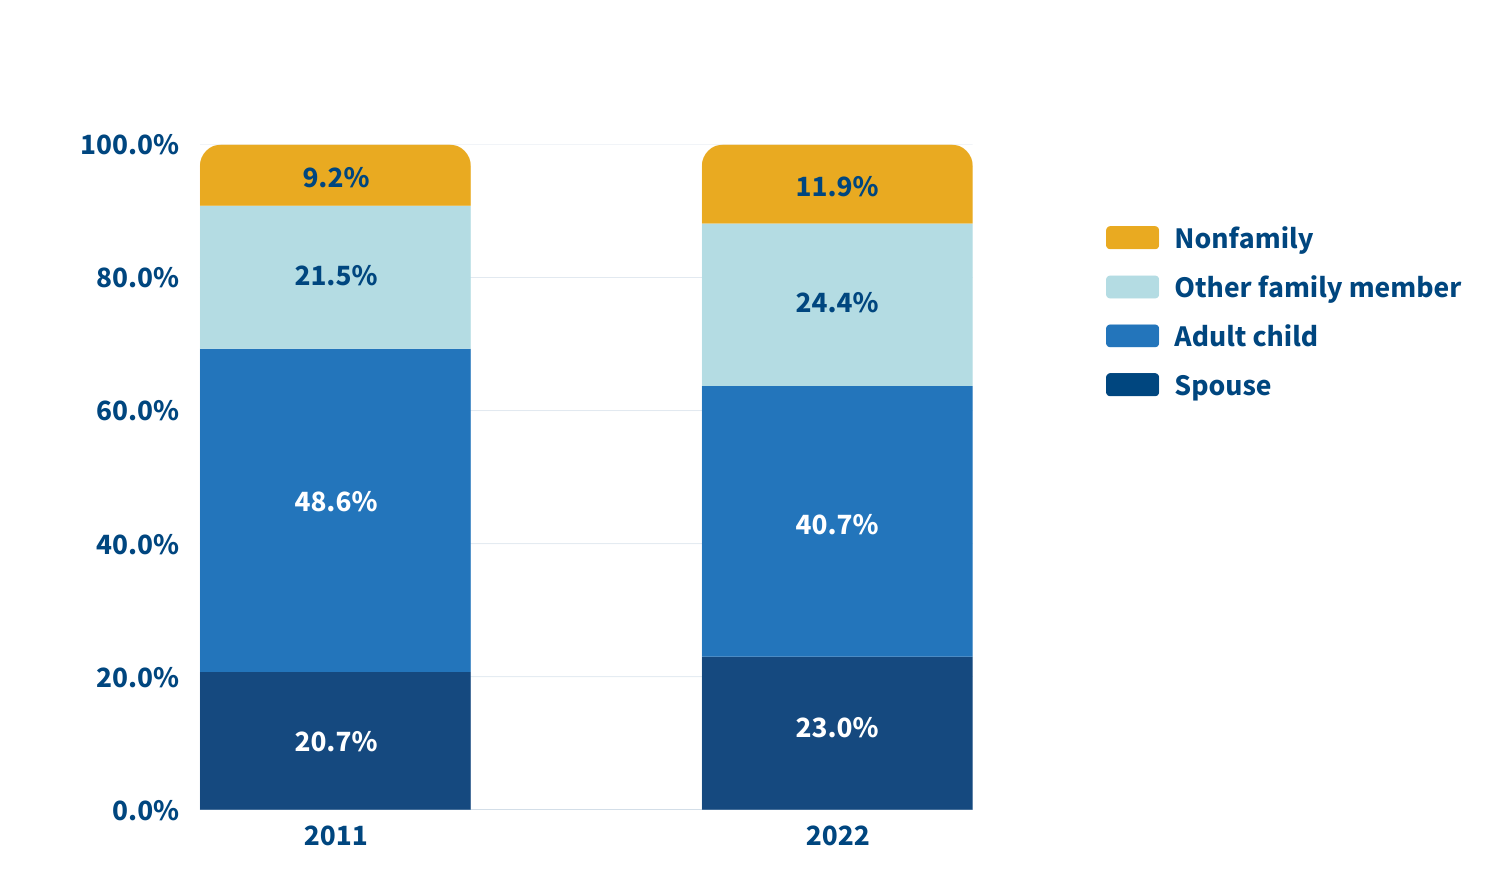
Source: Jennifer L. Wolff, Jennifer C. Cornman, and Vicki A. Freedman, “The Number of Family Caregivers Helping Older US Adults Increased From 18 Million to 24 Million, 2011–22,” Health Affairs 44, no. 2 (2025): 189-95.
In 2022, adult children accounted for about half (49.1%) of family caregivers for older adults with dementia, compared with 38.4% of caregivers for those without dementia. Just 17.7% of family caregivers for older adults with dementia were spouses, compared with 24.5% of family caregivers for people without dementia.
A sizeable share of family caregivers (17.0%) had children under age 18 at home in 2022, and 6% to 13% viewed their care responsibilities for older adults as a source of financial, physical, or emotional difficulty.
Despite these challenges, the researchers report a decline in the use of support groups (4.1% to 2.5%) and respite services (12.9% to 9.3%) between 2011 and 2022.
Trends and Policy Implications
Many caregivers face extraordinary demands and should be the focus of support services, Wolff and colleagues say. They single out those caring for older adults with dementia or nearing the end of life, as well as caregivers “from racial and ethnic minority groups who are more likely to assist people who have extensive care needs in circumstances that involve scare economic resources.”
Family care needs are likely to rise as the number of U.S. adults ages 85 and older is projected to triple by 2050. The researchers note that the number of family caregivers rose even as the long-term use of skilled nursing facilities among older Americans dropped and community living increased. The challenges these caregivers continue to face is “sobering,” they write, including competing time demands from work and child care while spending an average of 17 hours per week on care. In addition, about 1 in 8 family caregivers report financial, physical, or emotional difficulties related to their caregiving roles, percentages that were largely unchanged over the 11 years examined.
Policies and programs to help reduce the financial, physical, and emotional burden of caregiving exist, but do not represent a coherent strategy, the researchers say. “Local, state, and federal policies are a patchwork that is uneven in availability and largely symbolic in magnitude,” they argue. Addressing the needs of family caregivers will require a “cohesive framework in support of the care economy.”
References
1. Jennifer L. Wolff, Jennifer C. Cornman, and Vicki A. Freedman, “The Number of Family Caregivers Helping Older US Adults Increased From 18 Million to 24 Million, 2011–22,” Health Affairs 44, no. 2 (2025): 189-95.
Featured Articles


Date
March 18, 2025
English Publication
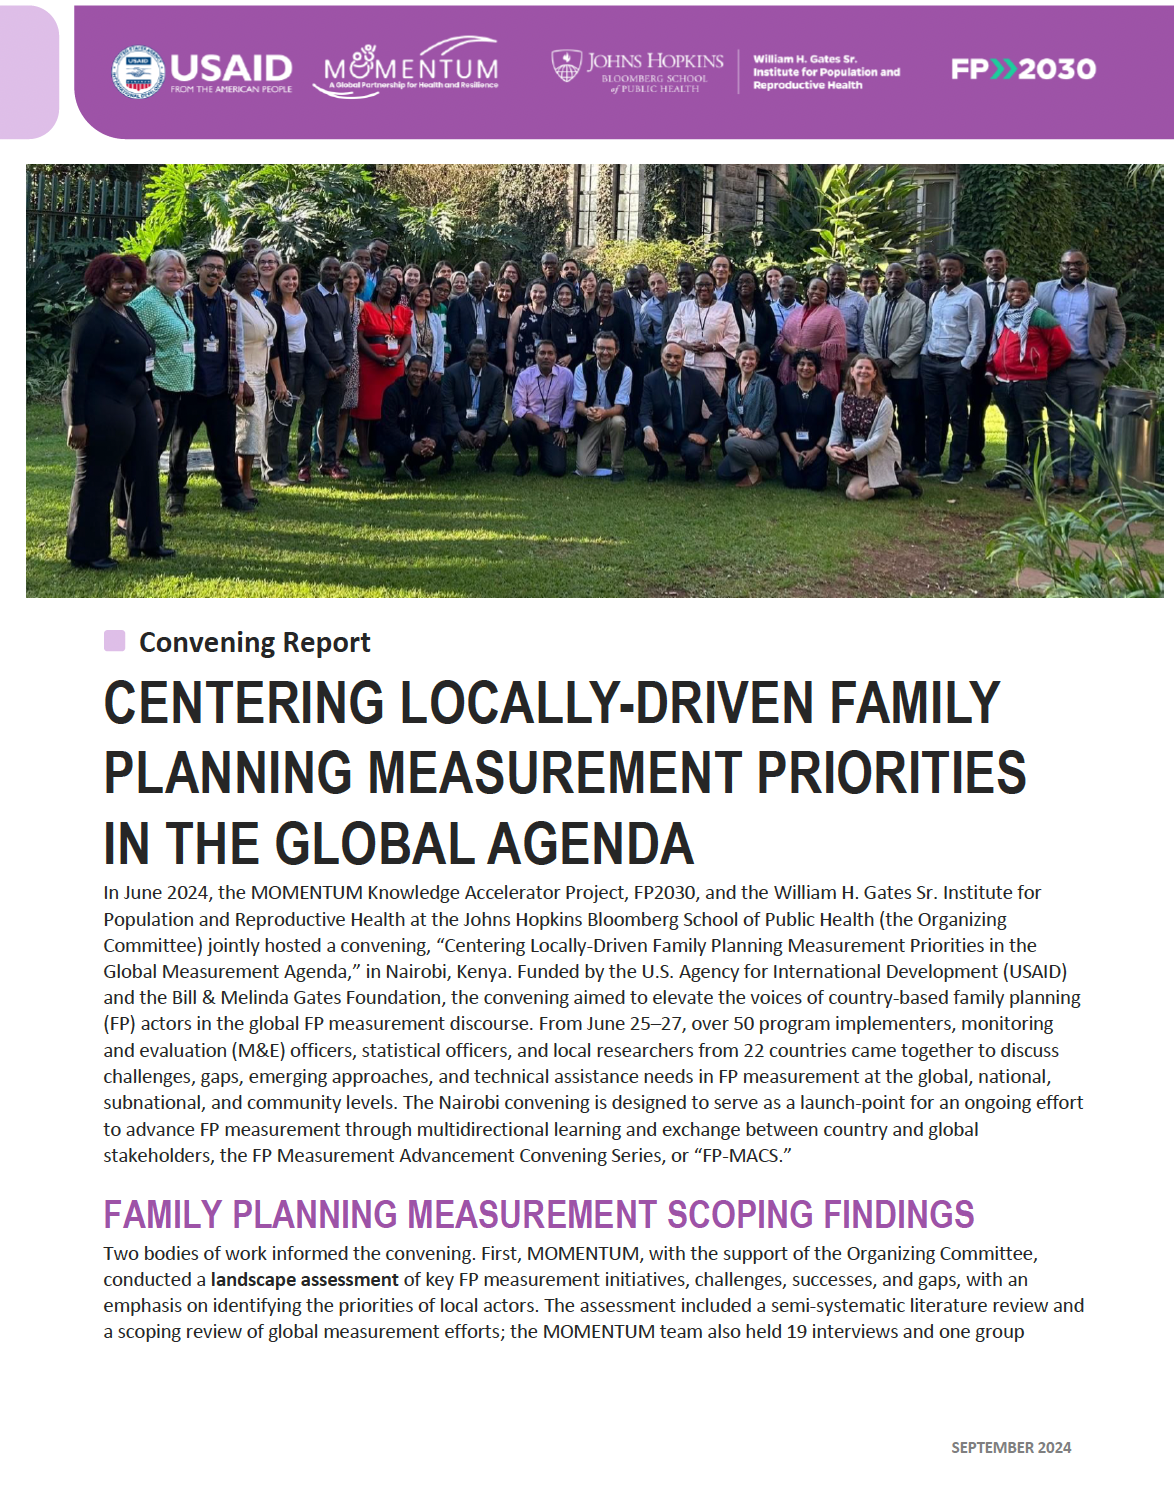
In June 2024, the MOMENTUM Knowledge Accelerator Project, FP2030, and the William H. Gates Sr. Institute for Population and Reproductive Health at the Johns Hopkins Bloomberg School of Public Health (the Organizing Committee) jointly hosted a convening, “Centering Locally-Driven Family Planning Measurement Priorities in the Global Measurement Agenda,” in Nairobi, Kenya. Funded by the U.S. Agency for International Development (USAID) and the Bill & Melinda Gates Foundation, the convening aimed to elevate the voices of country-based family planning (FP) actors in the global FP measurement discourse. From June 25–27, over 50 program implementers, monitoring and evaluation (M&E) officers, statistical officers, and local researchers from 22 countries came together to discuss challenges, gaps, emerging approaches, and technical assistance needs in FP measurement at the global, national, subnational, and community levels. The Nairobi convening is designed to serve as a launch-point for an ongoing effort to advance FP measurement through multidirectional learning and exchange between country and global stakeholders, the FP Measurement Advancement Convening Series, or “FP-MACS.”

Webinar: The Pros and Cons of Virtual vs. In-Person Interaction for Older Adults
Date
March 18, 2025
In this March 4, 2025 webinar, three researchers discussed how social media and new technologies may enhance—or limit—social connectedness and emotional well-being among older adults.
- Karen L. Fingerman (University of Texas at Austin) focused on the relationships between social media use, social ties, and emotional well-being in later life.
- Ellen L. Compernolle (NORC at the University of Chicago) summarized research on loneliness among older adults from Chicago during and before the COVID-19 Pandemic.
- Steven W. Cole (University of California at Los Angeles) described how in-person and virtual social environments influenced gene expression during the COVID-19 Pandemic.
This webinar was hosted by PRB and the Coordinating Center for the Centers on the Demography and Economics of Aging and Alzheimer’s Disease and Related Dementias, with funding from the National Institute on Aging.
Webinar: Bridging Research and Policies: Enhancing Budgeting Processes for Africa's Demographic Dividend
PRB hosted a high-level webinar with budget experts, parliamentarians, and national directors to discuss the importance of the Demographic Dividend Sensitive Budgeting approach in enhancing budgeting processes across Africa.
Date
January 24, 2025
Texte français à venir.
On Aug. 6, 2024, PRB’s Africa Director, Aïssata Fall, hosted a high-level webinar with budget experts, parliamentarians, and national directors to discuss the importance of the Demographic Dividend Sensitive Budgeting (DDSB) approach in enhancing budgeting processes across Africa. The webinar, “Bridging Research and Policies: Enhancing Budgeting Processes Africa’s Demographic Dividend,” was held in coordination with the Regional Consortium for Research in Generational Economy (CREG), a nonprofit based in Senegal led by Prof. Latif Dramani. It is available in English and French.
Panelists include:
- Prof. Latif Dramani, President and Coordinator, Consortium Régional pour la Recherche en Economie Générationnelle (CREG), Senegal
- Pr. Germaine Anate, Professor, Director of the Center for Studies and Research on Organizations, Communication, and Education; University of Lomé, Togo
- Ms. Astou Diouf, National Director of Gender Equity and Equality, Ministry of Family and Solidarity, Senegal
- Miss Mariama Fanneh, Director, National Population Council, The Gambia
- Dr. Larba Issa Kobyagda, Director General of Economy and Planning, Ministry of Economy, Finance, and Development, Burkina Faso; Coordinator, National Observatory of the Demographic Dividend, Burkina Faso
- Mr. Moussa Sidibe, National Coordinator, Sahel Women’s Empowerment and Demographic Dividend (SWEDD) project, Mali
Transcript
Aïssata Fall, Africa Director, PRB: To better achieve our development goals and more specifically, we will be talking about budgeting processes in order to enhance Africa’s demographic dividends. Demographic dividends is an issue that is being widely spoken about, and sometimes it seems theoretical or abstract. But today we are fortunate to be able to look at this more concretely and look at some of the processes that have been developed and put into place with the help of the African Union and several African countries to help capture some of these demographic dividends by investing in youth and in women. And our presenters today will be talking about how research in Africa has been helping to better analyze and create tools in collaboration with technical staff from various governments, specifically in French speaking Africa, in order to create these tools and provide them to decisionmakers to help them better plan and be able to really capture the demographic dividends.
We will have Professor Dramani, who is the coordinator of the CREG, in Senegal. He will be speaking to you, and first he will be talking about a tool that is the budgeting tool that is sensitive to demographic dividends. And he’ll be talking about how we can use public expenditures to better enhance these dividends.
Let me give you just a moment. I am having a connection, let me ask you to give me just a minute, 30 seconds, I’m having a connection issue here in Dakar, and I need to switch networks.
I think that is better.
Professor Dramani has his doctorate in Economy from Senegal, and he is a Professor at the University of Thiès and Coordinator of the Center for Research and Applied Economics and Finance -Thies, representing Africa in the National Transfer Accounts Network. He is also the coordinator of the Regional Center of Excellence in Generational Economics, or CREG, and Africa’s representative in the NTA Network. Professor Dramani is affiliated with several universities around the world: University of Manchester, Berkley, Baku State University, University of Cape Town, University of Hawaii, and he’s the author of several scientific and programmatic works. Professor Dramani primarily conducts research on sustainable development through the lens of demographic dividend and generational economics, poverty dynamics, unpaid domestic work, and women’s contributions to GDP. And finally, he works on national and local economic integration. So, I would now like to give the floor to Professor Dramani, who will be speaking to us in French. Professor Dramani, if you could turn on your camera. Over to you, Professor Dramani.
Prof. Latif Dramani, President and Coordinator, CREG: Thank you very much. And good morning. Good afternoon, everyone. Thank you, Aïssata. And thank you to PRB.
I would like to say hello to everybody, all the colleagues online, all the participants who have joined us on our call today. I see a lot of friends online, and a lot of colleagues from many different institutions. It’s a pleasure to see you and as Aïssata was saying, I’m going to give a brief presentation, opening up our webinar to get our discussion started. We have two presentations today. We have a presentation that will be focusing on policymakers and then also presentations, focusing on researchers who will be talking about some of the tools they’re developing. And we will also be sharing links with all the, for all these tools from NTA that will be of use for the researchers, and especially if they want to get more into the technical and scientific issues. Thank you once again and to Aissata and all the colleagues from PRB for all the work you have done to organize today’s webinar.
Next slide please.
We have been attempting to see how we can integrate demographic dynamics into development policies and the ICPD Cairo resolution has been from 1994, has been seeking to integrate demographic dynamics into these policies as a priority. We also have the African Union’s Agenda 2063, which was launched in 2013. For the Africa we want, which is a strategic framework for the social economic transformation of the African continent over a 50-year period, looking at how we can capitalize on the potential of youth and women. We also have the African Union 2017 Roadmap on Harnessing the Demographic Dividend through investments in the youth. And this roadmap contains four pillars Employment and entrepreneurship, education and skills development, health and wellbeing, which is pillar three and then pillar for law, governance and youth empowerment.
So, this is the framework in which we have been conducting this work looking at demographic dynamics and we are going to be looking at all of these frameworks. The Cairo resolution from 1994, the African Unions agenda 2063. These are all important frameworks to help us, spur this work and give us a basis for all this work that we will be presenting today.
Next slide please.
So, our NTA network has published this was in 2022, published some of the, document about the major, one slide back, please, about some of the major international trends. One slide back. Thank you. So these are some of the major global trends about demographic change and how it impacts the global economy and overall we see that there were six main outcomes in terms of these trends. That, first of all, Africa is the continent that has the youngest population right now, Africa is more and more going to continue having growth. And we’re seeing a huge demographic explosion in Africa. But this is not necessarily the case at the global level or in other countries where the other countries are facing issues of an aging population. So, we are looking at how we can really enhance and maximize these demographic dividends, and where we can best invest our resources in which sectors, which are the priority sectors in an environment where there are limited resources, where can we best invest our resources? So, this overall is the overview that we see from this document about the impacts on the global economy and demographic trends, and looking more specifically at Africa with its young population and how we can benefit from this demographic growth, whereas in other continents we are seeing an aging population.
Next slide please.
In this perspective, there is a whole range of tools that have been developed, and the tools that were developed are aligned with the AU’s roadmap on capturing demographic dividends. So, among these tools, there were tools to analyze and understand the impacts on the economy, the impacts of demographic growth on economic. So, population economics as we said. And because all leaders when they come to power whether it’s in the DRC or Senegal or various countries. In Kenya, we’re seeing that our leaders are facing this issue of social demands with the new generation because they are more and more demanding and this is a huge problem for many leaders. So, we are developing tools to analyze these pressures. Also, tools to help measure and to monitor demographic dividends. We’ve also been developing tools that will enable us to see how demographic dividends can be better aligned or integrated into national development plans in our countries because, as all economists know, as well as development actors, if we don’t have budgeting policies that are sound and integrated we are not going to be able to capture these dividends. So, we have developed a whole range of tools with support from the NTA network that we are a member of. We have also worked with UNFPA, which contributed greatly, especially in the West African countries. We have, The Hewlett Foundation, that also provided a lot of support in developing these tools. So, we have a number of partners, we have the NTA profile and NTTA profile, that looks at how all individuals produce, consume and share and savings. So, we have about 30 African countries right now who have developed profiles. And then we have the National Time Transfer Account (NTTA), which quantifies and values an unpaid domestic works contribution to the economy. Whereas the National Transfer Accounts (NTA), they examine how individuals produce, consume, share and save resources. But the NTTA focuses more on unpaid domestic work. Also, we have tools that measure the contributions of persons with disabilities, which is often not accounted for.
We also have tools to monitor dividends, which we call the DD monitoring rather monitoring index. This tracks progress implementation and in the African Union’s roadmap through five dimensions. And then we have the GDDI, the gender index, which measures the differentiation of women and men’s participation in achieving demographic dividends. And then we have the BSDD, the budgeting sensitive to demographic dividend, which assesses demographic dividend issues and budget allocation and effective consideration of DD and public policies. So, these are the tools that were developed, and they are aligned with the recommendations in the AU roadmap.
Next slide please.
Here we show an example of some of the results. And this is a result from the NTA. And this is the example from Togo, if you look at the graph on the left in red you have consumption by age, aggregated consumption by age from childhood through working age and then older persons. And what we observe here is that, and this is a country that is an example of what we see in many African countries where we have a youth bulge, and the fact that consumption. Is quite high in earlier years. And this shows that there is a huge problem in terms of being able to meet consumer needs for young people. And then we see that there’s also a surplus during the working age, you see that in light blue where we don’t overcome these two deficits, the two deficits that we see in among youth and working aged person. So, this is part of the analysis from the NTA that looks at the whole population economy to see what trends are occurring in a country. And then we also have the support ratio, where we look at the number of effective producers and the number of effective consumers. So, if everybody works, then you didn’t have the same productivity necessarily. Uh, somebody may be working more hours a day than another person, or somebody may, for example, for a surgeon or a doctor, they might be spending some days just doing medical visits and other days during surgery, saving lives that it’s not necessarily the same degree of productivity. So that’s how we look at effective producers and then effective consumers. This takes into account the consumer needs and the fact that they vary with age. A child is not going to consume the same amount as a young person or an adolescent who’s not going to consume the same amount as an adult or an elderly person. So that’s what we mean by effective consumers. And this is what we’re looking at with the NTA tool and we’re looking at the growth rate and what we call the primary dividends. And overall, this is an overview, a quick overview of the basis for all this work that we have been conducting to look. Of course, economies have a certain life cycle. And we look at the households at the microeconomic level. But then we look at the state at the macro-economic level.
Next slide please.
Here we have looked at this as data that is disaggregated by sex or by gender.
And what you see here is that there is a predominance of men on the market, and that is in the blue line, where you see the men’s average labor income, and then you see the women’s average labor income in red, and you can see that men predominate or dominate in Togo throughout the whole life cycle. There’s a dominance of men over women in terms of the labor market. And so, where the market is, where money is circulating, it is men who are dominating.
And this is illustrated here with the case of Togo.
Next slide please.
So, this looked at the market, but there is another market and that is the domestic market where it is much more about the older types of work you know, so non unpaid domestic work. So, every one of us at home do a certain type of work, even, uh, women, even if they were to have servants, they do certain work at home. And this is not counted within national accounts, but this work is at the very heart of the dividend, because without this work, being done, nobody can get out of the house to go work elsewhere. So, this is very important, uh, you know, this socialization that exists there, there are all these implicit contracts in terms of social cohesion. So, this is a very important work that contributes to the population, but it is not accounted for. In terms of the University of Berkeley, we are attempting to achieve an international harmonization of a way to account for this time used within households. So, we will call it NTTA, the national time transfer accounts. This has to do with all everything we do about women empowerment, gender equality etc.
The following slide.
Okay, here we see an illustrative example. So, we have this profile that you see on the screen that shows you the number of hours per week that are produced and consumed. So, the dark red line, that is the position of time in women. So, you see that woman, produce a maximum of 20 hours per week, let’s recall that 40 hours as a work week. If you look at men, their maximum is six hours, seven hours per week.
So, if you look at 15 years old or 20 years old, you will see that young women and their male equivalents, they produce much more domestic work in terms of time. And this really, you know, so in the SWEDD project, we’re currently really looking into dropping out how why women drop out of school. so young women are dropping out of school not because they want to, but because there is this amount of time that is part of socialization. That is because they are women. So, they have, say, 15 hours of work. So you have a woman who is at university, she has to spend 20 hours working in the home. This is enormous. So and this work is unpaid. So it is not accounted for within national accounts. It is almost invisible work labor. And then, you know, when we talk to parliamentarians, you know, like in Senegal, we were told, oh No, we must say that this work is not used in accounting. So first we have to acknowledge that women do a lot of work. And this is what we’re going to detail here. Everybody works for a number of hours, but not everyone produces during these hours. So, you know, when you have young children or elders that you have to take care of, that is one thing.
Next slide please
So, we looked at a few countries that are represented here. So, we looked at Niger, Cote d’Ivoire, and a few other countries in terms of paid work and unpaid work. So, what you can see here If you look at, you know, the production of type like for example, in Cote d’Ivoire and Niger so we showed that in could Cote d’Ivoire we had the weakest estimates in terms of time, in terms of domestic working time. These were the lowest amounts, this is tied to socialization in Cote d’Ivoire. In Niger we found the highest times. And this again has to do with the socialization in Niger, because the fact that from a sociological standpoint women get married very early, very young. And so in terms of time you know, they have around six children on average. So you can imagine it takes time to take care of that many children. And they get married very young, around 16, 17 years old and so between that and up to 45 years old, they’re spending all this time. So, this takes time and, and all the other domestic work that they have to do. So that is what we’re trying to illustrate here. Here we have a deficit of care because in the. Here we see a lack of sufficient care throughout the life cycle. So, this is care for young children and elder individuals. And this is shown on the slide.
So, there we did a quick we took stock of the NTA and NTTA, this is very the basis of the work that we are doing. And the African Union has asked for the creation of an index for the monitoring of the demographic dividend. So this is how the DDMI was established, which is made up of four pillars, uh, with five dimensions. So pillar one was employment and entrepreneurship so this pillar one is covered by three dimensions of the DDMI, economic dependency. That is the first one dimension to is quality of living conditions and dimension three is poverty transition. And then the second pillar about education and the development of skills, and then the pillar on health and well-being, which is, um, fueled by dimension four, which we’ve talked about, which we’ve called extended human development, which makes us able to see the human and development at the national and subnational level. And then we have of course, rights, governance and youth empowerment. This is fueled by dimension five and also dimension two. And this is everything that has to do about, the arrangement of the territory the having potential opportunities at the national level, not just in some regions, as we see in most of our countries at this time. And the fact that people must have access to services, young people, women must have access to reproductive services, health services, infrastructures, transportation services, financial services, for example, throughout the entirety of the country’s territories. So that’s dimension five of DDMI. And we have results for about a dozen countries in West and Central Africa.
Next slide.
So we have GDDI and its gender specific version because we know that women represent 51 to 50%, 52% of the population in general. So, we saw earlier with Togo and what we saw for Togo is pretty much what we see throughout Africa. We have inequality between the genders. So, the DDMI index was divided by gender. So the GDDI gender, demographic dividend and to see how we could budgetize to take care of national issues, but also taking care of this 52% of the population. That is enormous, because as we saw it, is the women who contribute the most to socialization and do all this unpaid work that is not accounted for at the national level. So, this can represent 10 to 25% of GDP in countries. That is the estimate we have for the region.
Next slide.
So, this brings us once we developed all these indexes. So we have the basic preferences that show us where things are not going well. So we can go okay. It is not going well here. But the plan, the diagram is not complete. When you look at this diagram, you can see it’s incomplete as someone who is a policymaker, etc. And then you have issues of equity, territorial planning, etc. you have equity issues. But the question is what do you do with all this? So this is where Democratic Dividend sensitive budgeting originates, because it’s not just a we can’t just stop here. You know, this gives us a diagnostic it tells us what to do. But how do we do it? We need public resources. Demographic dividend sensitive budgeting is because we are talking about public funds everything that we know about economic theory is that the state is the sole guarantor of collective good. A private person cannot create and build an airport. It will be his airport. It will not be a public airport. So when we’re talking about public funds, they are what is going to be used to take care of all these problems? How to use these resources to obtain the benefits of this demographic dividend. So, the DDMI that we talked about with five dimensions, it is very much a diagnostic tool, but it’s not really legible for those who take care of budgeting, those who are in charge of public finance, they really want things to be very clear for them. This is why the BSDD was created. So, this is about budgeting, we broke down the index so that it could become understandable to our friends who create budgets within our countries. So we created four components that can be used by any country. The first one, the first component is human capital, then second governance, then economic structure and the fourth component is network. And within each of these there are two functions, first education and health, which fall under human capital. Under governance you have institutions and security, under economic structure you have economic affairs and infrastructures, public works, energy and then networks you have specialized networks, which we call social networks and professional networks. So this is the normal type of nomenclature that can be understood by people who take care of budgeting. And this is actually informed by the DMI. So here we have this results indicator, the DMI, which is now anchored to the budget via this table. These four components. so this is the very core of what we want to talk about today. We this was what was asked for by our leaders. You know, we know we have finance. We have a growth in the youth population, but we must establish priorities. You know, in a developing country, everything is important. So what is the priority? So this work has been done to establish where the priorities lie in terms of budgeting, where do, where must authorities make strategic investments, you know, and where do these authorities, decide that they must do very specific things, things like commercial plans, essentially, have a total rupture from the past.
So here these are the first results of BSDD demographic dividend sensitive budgeting. This is the structure of budgets. So when we analyze the budgets of our countries, when we talk about, you know, it’s often analyzed in terms of percentage of increase of growth. Yes. Growth is important, but what is even more important is the weight of each sector within the budget. So, when we talk about demographic dividend there are very simple things we can observe. So the dividend first must have a well-educated population that has skills and that is in good health. So there you will see the columns that are labeled education and health. What do you see there? So that’s the head. That is the top part. It is well formed. So now I must have an economy that can support this so that the infrastructure, you know the buildings and public works, etc. so we can have an economy without energy to, for example you know, create electricity and manufacturing etc. So that is very important. So on top we have education, so that’s the head of the body. Then we have the spinal cord is the structure of the economy. And then we have governance coordination, So we have security, So we have laws. And then finally we need social cohesion. We need specialists, And that is your networks. So, you have the head, the spinal cord, two feet and two hands. So when you look at the structure, we observed that in our countries we allocated many more resources to institutions. Institutions consumed a lot of the budget. You know, look in, in comparison to the resources that so for example, the resources allocated to institutions and the resources allocated to health there you can see there is a problem. If you look at both those columns. Now, when you talk about gender, that’s about social matters. And look at the portion of the budget that is allocated in the various countries, to creating gender programing, you know, about gender equity to empower women, in order to improve the system. So then you have the social networks.
So apart from Mauritania, things are not going very well in that aspect. So this enables us to tell the authorities because you know, we’re talking about public expenditure. This is everybody’s money. So we need to tell the authorities things are not going right without, we can’t really benefit from the dividend in this way. We really need to change how we allocate resources. So that is an initial analysis of the first results of the first results that we have found in terms of the various countries noted on this slide.
So I talked about the various countries on the previous slide, but this is an average of all our countries together. So, you know, we have about 12 countries that we averaged out to get to these results. If you look at the budget structure you have 100% there. And then you can see how these budgets are allocated. So, you will see more specifically. So the budget does what you know is it used to invest. Is it used for operation or for transfers? I’ll take the line on Health First because without health you can’t get anywhere. So, let us talk about health, you have 6% in total on average between all these countries, when you look at the investment column, you see 1%. So as an economist, if I am not even as an economist, we can see that we do not have a good medical basis. We do not have the materials to achieve health within the population. So even if we have staff, we have personnel they cannot do anything because you need to have equipment to achieve health. So, we don’t have adequate medical equipment for our reality now. So the average is 6% but then look at institutions now just going down one line, that’s 32%. That is five times more, So institutions were originally created to coordinate the system, yet we see that they are taking up a lot of time, a lot of money. They are at 30% for investments, so 13 times higher than health. So, investments for institutions, it’s usually often equipment, cars, that sort of thing that is purchased. but it is more important for human capital to do a strategic investment rather than investment in these institutions. So we have countries undergoing crises. Well, so look at what is there. So we’re, you know, and then there’s the other sectors, sectors that are just sort of left aside. So we have a lack of balance among our budgets, basically we cannot benefit from the dividend with all this you have, it’s the institutions that are taking up most of the budget. There is no money allocated to health, to human capital, to education and you see that governance is actually more weighted than the economic structure. And so I am therefore a man whose spinal column could not support its arms if we do this body analogy. So basically, that means that we cannot stand as such because the spinal column cannot support the hands. So the spinal column is the economy. So, you have 14%, 10%. So these countries cannot stand up on their own feet until they can, really fix this issue and balance out the structure.
These are the initial steps of BSDD. They are the easiest to use, especially for policymakers and for everyone. Because okay, so you have public funds. This is our money. This is everybody is concerned by this. So we establish we provide the reasons why things are not going well. And these can be verified, because this is work that is done with various countries. It is done in an anonymous manner. So now is important to talk about issues of collaboration to bring about change because it is not obvious, but everybody has got to play their role. We have various stakeholders. So you have the sectorial ministries, you have the parliamentarians, you have civil society, you have researchers and the entire society. Everybody has to play their role because we learn while talking with parliamentarians that when they say that they can’t take on a problem if civil society doesn’t tell them, hey, there’s a problem here. And from a technical standpoint, we must strengthen the different sectorial ministries so that we can really start creating these services for our Populations strengthening skills, have communication an advocacy so that things can change. Especially, I really emphasize health because I really think without health, you cannot even begin to change things. Um, you know, the previous column we saw, we were about around a dozen countries where at about 6%. So there’s a lot of work to still be done. So we need for the tool to be truly used by the budget team so that they know that when they allocate resources, you know they are allocating resources for the development of their countries, but you can’t do it haphazardly. You need to find out what sectors you must invest in order to have results. And so this this tool can really allow us to seize upon this dividend. We have the youth, we have the young people, and they’re going to be around for quite a while, you know, but in 20 years, they’ll be 20 years older.
Next slide.
I really want to thank the SWEDD project and I want to, thank you the UNFPA, the Hewlett Foundation on the Counting Women’s Work, but they also supported us in our research and, and the fact that we were able to do this research with thanks to the Hewlett Foundation. We had Gates Institute also supported us in achieving these results. So thank you to all the stakeholders. Because what I just presented, this is 10-12 years of research work. And, you know, it may seem simple, but it’s it really represents 12 years of work for all from all these partners. So UNFPA, WCARO, Hewlett, UNECA, Gates Institute, etc. and of course, all the other partners we may have forgotten. The NTA network also has been a supporter since the very beginning, well before this program in order to really work on fundamental research on and as a applied researcher. Thank you so much, sorry, I took a little too much time. Thanks again Aïssata.
Aïssata Fall: Thank you very much, Professor Dramani. It was necessary for you to take that time. Professor Dramani, I cannot explain all the technical details. It is not really useful for me to repeat them but I think that this information is really important for us to continue having engagement. Engagement of all the member states of the EU, for the roadmap, for capturing demographic dividends, because this is going to be absolutely essential to really be able to capitalize on the youth contribution to this kind of these countries economies. We can also see the overall trend on the global level that these demographic trends are having an impact on economies. And we can’t ignore this. It is absolutely necessary and this started already back in 2014 when we were looking at this issue as part of a development issue.
Analysis show us and thanks to the work that we’ve done with the NTA and the NTTA, the analysis show us what is driving countries’ economies in terms of investments, but also not only money, but investments in terms of time. And this shows us we can’t ignore the fact that time is also a fundamental investment in order to have it. And we have to really have a good vision of the labor force in our countries, but also the policies that are going to allow every person, man or woman to be able to contribute to productively and fully to the growth of their countries’ economies. Another essential element, I think, is that in Africa, we have to look at the budget resources of states and in most cases, the government, the state is the main employer, and the private sector does not always dominate the market. It is more the public sector and so we need to see how we can also maximize the effectiveness of these tools and budgeting tools and processes. So now we’re going to be talking with some of our panelists who are representatives of their governments, who are talking, who are going to be talking to us about their budgeting processes and how they’re using these to capitalize on demographic dividends and before moving to our panelists, I would like to look at a few of the questions that we had for Professor Dramani, we have one question saying, when you look at the gender differences in terms of time spent on work, we can see that the differences start at a very young age. Is this a gender socialization issue, or is it an issue of early marriage? Or what are the issues that make this separation appear so?
Put a question in the Q&A. Could you retype in your questions please? And I will ask Professor Dramani to ask the first question that I had just asked right before we got cut off. Did you hear the question, professor Dramani? No. Could you repeat it again, please? Yes. The question. I’m not entirely sure I remember exactly what it was, but the fact that we see the set of this differentiation at a very young age in terms of time and is this different use of time, is this big difference at a young age? Is this because of working time? Is this because of socialization? Is it because of early marriages, or are there other factors that explain this different gender difference at such a young age? And what are the problems that we can see? What are some of the barriers in terms of the difference of time use at a very young age for between paid work for girls and boys.
Prof. Latif Dramani: Yes. Would you like me to answer?
Aïssata Fall: Yes. Go ahead and then I will follow up with the other questions after.
Prof. Latif Dramani: Yes. Thank you. Aïssata. What we see from the results of our analysis, and we’ve been working with all the different national representatives from the countries that we’re working with, to maybe also, give us some way in as to explanations. How do we explain this? Is it because in many of our countries, we have observed that there is this difference, starting at a very young age, especially in the countries we’ve observed this, and we see a very a different set of very young age between young girls and young boys. And this is probably most likely due to social norms and cultures. There are certain domestic activities that girls do that boys don’t do. And this is just something that is hardwired into social norms, if you will, that women have, work that they do a household work that is expected of women. So, I think that this is probably what really explains it, this division of labor that we see at a very early age because of social norms. So, I think it’s mostly socialization in the various countries. Then we can also see that when we look at countries in the Gulf region, for example, that changes quite a bit. There are differences, but they’re not quite as marked. And this is this is the answer I can provide as of now. But we have asked for the different country teams that have been doing the NTA and the NTTA. We’ve asked them to also consult with sociologists who can help give a shed light on this phenomenon that we’re observing and give us more explanation, because this is something that we do see quite clearly in many countries. It’s not something that we see that changes really from one country or one analysis to another. This is something that we really see that in every country across these this region and so I will stop there. But I that is my answer.
Aïssata Fall: Thank you very much. Let me take a second question now.
What is the strategy that could be implemented in order to urge our states to change these trends? We have talked about investing more in education and in health, but nothing is happening. What can we do to what strategies can we use to really pressure our governments to make these changes?
Prof. Latif Dramani: Would you like me to answer? Is it good?
Aïssata: Yes. Go ahead please.
Prof. Latif Dramani: Well, I think that one of the main things we see is that we have to, first of all, get the results more widely disseminated because we see often that our ministries, this is not something that people are talking about. It’s not being analyzed in terms of the state budget, It’s awful. Often looked at just at the growth rates. The budget is growing and it’s being looked at from that point of view. But it’s not necessarily looking at how this impact is affecting the budget. And often this is what the politicians are looking at, the minister is saying, well, we get a little more money, so we’ll give a little bit more money to health or if we get a little bit more money or money, rather, we can give a little more money to the health sector. But in terms of structural changes, things are not really changing much. So I think that we need to, first of all, start analyzing this from a structural point of view, looking at the structures, because in terms of our budgetary policies. Things need to be trending upward in terms of our structural policies, but you have to look at whether you’re investing 10%, 5%, 25% and that and then if there is a growth rate, you have to look at it and say, why are we seeing budget growth? Because unless there are budgetary shocks such as crises, wars or so forth, all the aggregates are generally on an upward trend over time and this is because social demands, the basis is growing, the population is growing. And so the needs that have to be a matter also growing. So if we don’t look at the structure, if we look at only growth rates, which is often what we do then we’re not going to be able to really implement these changes. We have to change the way we analyze it. And ministries and the sectoral departments and regional departments have to look at how this is impacting the budget. Because if you look at a certain sector and if they don’t have sufficient resources, it’s going to fail. So often it’s because they haven’t been given the resources, they need to do the work that needs to be done. So in health or education, if they don’t have the resources, if we want to make progress, we have to have a clear basis and we have to have a good structure in place.
And then once we have these structural policies in place, then we can look at how things are progressing and how we are improving public expenditures.
Thank you.
Aïssata: Thank you. For people who had posted questions, I am sorry, but we have a lot of questions, and we don’t have a lot of time left. So, some questions are more country specific. Why Senegal invests this or why Mauritania doesn’t invest that and so forth. So rather than discussing individual countries now, we will provide answers by in writing after our webinar. But we are going to try to look at some of the more general questions today.
I think this important for us to look at issues of. And this is a question in English it says, how can this information be used for advocacy and what are the desired outcomes over the long time? So these are the types of questions we would like to ask of our panelists today who I’m going to introduce shortly. But the other questions, we are not going to forget the other questions. And we will provide answers after. But what I can say for now is that, yes, these results are in tools are publicly available and they are intended to be meant by or intended to be used by governments and policymakers. This is the fruit of about ten years of work. But these are tools that are now newly being used in the budgeting and planning, uh, areas. And we’re trying to see how social sectors can not only use these results, but also use these mechanisms to better understand these budgeting processes. And this is of course related to the quality of the data and how the data is being used. For me, in terms of social protections and demographics, I think that the use of these tools and these results is useful because these are tools that are going to help governments have concrete tools to help better plan their budgeting processes. But it’s also a way to validate the work of technicians, researchers who have validated these tools as being effective tools. And by usin the data that we have, we will come back to these questions. We will provide answers in writing after the webinar, as I said, but we don’t have a lot of time left. So I would now like to continue with the next section of our webinar. And we will have a roundtable discussion with four people, who are directly involved in using this data. And they will be giving us their opinions about how useful this data can be and these tools for policies and decision making.
We have, first of all, Mariama Fanneh, who is a Director of the National Population Council in Gambia. She is with the office of the Vice President in the Gambia. In this role, she is responsible for coordinating the national population policy and programs, including the UNFPA funded country program. As Director, she also leads the National Observatory for the Demographic Dividend in The Gambia. Currently, she is a part time lecturer in public policy at the Management Development Institute, and her career includes positions such as Assistant lecturer in Management and Economics at the University of the Gambia and other schools. She’s currently pursuing a PhD in Public Administration at the University of the Gambia focusing her research on harnessing the demographic dividend through youth and women’s empowerment in the Gambia. She holds a Master’s degree in Business Administration from Clayton State University in Georgia, United States, and a masters in Population Studies from the University of Ghana, and she also has a bachelor’s degree in Economics, and she has also led significant research projects, including a national study on COVID 19 in The Gambia. And she’s worked on several initiatives related to youth and women empowerment.
Next, we have Pr. Germaine Anate, who is a full professor in information and communication sciences, and she is the director of the center for Studies and Research on Organizations, Communication and Education at the University of Lomé. She is a member of the National Assembly of Togo, and she has also served as Minister of Communication, Culture, Arts, and Civic Education. In addition, she is deeply involved in humanitarian and associated organizations. In this capacity, she chairs the Board of Directors of the NGO care solidaire, where she advocates for the empowerment and development of youth and women through, among other things, leadership training, communication techniques, and efforts to combat gender-based violence. She is also the president of the Togo Writers Association, and she’s published several articles, scientific works, and literary books.
Next, we will have from Burkina Faso, Dr. Larba Issa Kobyagda, who has a Ph.D. in economic sciences and a background as a financial economist. He has held strategic positions within the Burkinabe public administration for the past ten years, including at the Ministry of Economy and Development as a lecturer and assistant professor in economic sciences at Thomas Sankara University. He’s also a member of the research team on the global economic policy issues, and has authored several scientific publications on economic and financial policies. Dr. Larba, as Director General of Economy and Planning, is responsible for coordinating tools to support the effective management of the economy and development, as well as overseeing the monitoring and evaluation of public investments. Additionally, he serves as the coordinator of the National Observatory of the Demographic Dividend of Burkina Faso, where he conducts studies and research in generational economics, advocates for policy, and strengthens national capacities in monitoring demographic dividends.
And finally, from Mali, we have Mr. Moussa Sidibe, an agro-economist and local development expert, who is the national coordinator of the World Bank’s Sahel Women’s Empowerment and Demographic Dividend, or SWEDD project in Mali. Moussa Sidibe holds a degree in agricultural engineering and rural engineering from the Institute Polytechnique Royale from Göteborg in Mali, and a master’s degree in analysis and evaluation of agricultural, social, industrial and environmental development projects from the School of Economic Sciences of Rennes one, France. He has over 30 years of experience in social economic development, particularly in rural areas, working with NGOs and consultancy firms. He is conducted several expert missions for development partners in Mali, Africa and Europe, and since February 2016 he has been coordinating the SWEDD Mali project, which focuses on population issues, human capital, and particularly on women’s empowerment and the demographic dividend in the Sahel.
I am going to ask our panelists to turn on their cameras if possible. But I know that sometimes the connections don’t allow for your videos to be on. But so if you have the bandwidth and can turn on your cameras.
Great. I see, Dr. Larba and Professor Aneta. Moussa, are you able to turn on your camera? But if you’re not, that’s fine. No problem. And then I also see that we have Ms. Astou Diouf, who is a legal expert with degrees from the Cheikh Anta Diop University in Senegal. And she is currently the national director of Gender Equity and Equality since November 2019 at the Ministry of Family and Solidarity. With a rich experience of 19 years, she has held various leadership roles in the sectors of women, children, family and gender. She has worked in promoting women’s status, managing legal affairs, and directing programs related to gender equity and equality. As a national focal point for ECOWAS, she is played a key role in initiatives concerning women, peace, and security. Her career demonstrates a deep commitment to improving the living conditions of women and families through an approach focused on equality and social inclusion, and Miss Diouf holds a master’s degree in finance and public management, a master’s degree in defense, Peace and security, and a masters in Environmental law.
So I would like to start with our questions for the panelists, and I’d like to ask you to try to answer your questions in just 2 to 3 minutes. we have had a few connection issues, so we lost a little bit of time. So if you could be very brief with your answers, that would be great. So we’ll try to pretend as though we’re not in West Africa with the connection issues. And I don’t think anybody’s going to be too traumatized by the fact that we had some issues and are running a little late. But first of all, and before I ask my questions, I don’t know if everybody I don’t know if all the panelists can turn on their cameras if possible. Okay, great. Thank you. Now I see you all. Oh, for those who are able to.
To begin, I would like to ask this question to Mr. Larba from Burkina Faso, Miss Diouf from Senegal, and Miss Fanneh Gambia. And when we look at this process the BSDD and we see that it’s a long process and we’re looking at the demographic dividends and the final results. We have all these analyzes that we’re doing, the NTA, the NTTA so forth. And we’re also looking at the different indicators and the indexes that are allowing us to align these analyzes with the African Union roadmap. So I’d like to ask if you could explore the concrete impact and benefits. And can you provide some specific examples of how the BSDD has influenced your decisions and improved outcomes in economic development and gender equity?
So for Dr. Larba, Burkina Faso is rather advanced in this BSDD process. So can you maybe talk about which BSDD tool has most influenced your economic decisions and development? And if you look at how things were done in the past, how things have changed over time. Thank you.
Dr. Larba Issa Kobyagda: Thank you, Aissata, for giving me the floor. And thank you to all the other panelists for being here today. Thank you for to Professor Latif, for your great overview, which really gave us a good idea of what we can do from a technical point of view with the BSDD. I’m going to answer the question directly for Burkina Faso. Looking at population trends has always been a major priority. But of course, now with the tools that we have this has helped us better develop our strategies and we’ve been working with the CREG to develop our BSDD profile, which we did in 2018. This profile showed us that for the five different dimensions that are measured in this index, Burkina Faso did not achieve more than 50% in any of these different dimensions. And we see that we have a lot of work to be done in order to really capture the demographic dividends and to make more real progress. So this process was conducted looking at budget sensitive demographic dividends. And we were looking at how we could take economic shocks into account in our budgeting processes. And as we looked at the BSDD, we were looking at the country’s profile and so the BSD, the advantage is that it gives us more opportunities to look at expenditures and to see how we can better invest our public, our public funds into improving the wellbeing of our population.
It also helps us to analyze our budget from a functional point of view and also looking at the impacts of productivity of expenditures by different departments and sectors. And it also looks at efficiency issues and which expenditures have greater impact.
So these types of analysis have been difficult to do with the classic with the traditional budgets but when we look at the traditional budget up from 2017 up to 2020, when we look at the demographics, we see that efforts were done by countries. But these efforts didn’t necessarily take into account the different economic shocks that we sell in the various countries, and we saw that the proportions were relatively low in terms of investments in education and health. But there was a clear improvement in terms of the health investment from year to year.
And from 2.5 from 212, we tremendously increased from 2021 to 2023. And these, you know, are weak compared to what is really expected. So the country told itself, given its current, security crisis, it is good to intensify the use of BSDD, so that budget allocations in the favor of human capital may lead to better health. Now, when we examined budgetary flexibility in terms of the BSD process, we had effects. We saw different effects of these allocations in terms of health or education. Nevertheless, this means that the country has done a lot of effort to work for youth and the female population in agreement with the African Union efforts. So this means that we have been able to undertake a political dialog with the Directorate of Budget Institution, the National Assembly, etc. to take BSDD into account in the 2025 budget. So we look at these strategic choices that were documented in the multi-year budget document for 2024-2026. This BSDD is important and has been brought to the attention of the government. And so. We have had comments about the taking into account of BSDD. So the 2025 circular has taken into account BSDD as an innovation in the creation of the budget to implement in a progressive manner. So we’re talking about demographic transition and how to take advantage of the demographic dividend by 2025. And this is what we are working on to ensure that this instrument brings us a better solution to the things that concern young people and women.
Aïssata Fall: Thank you very much, Doctor Larba. Interesting. When you were talking about how the process made it so that you could highlight the efforts and broaden the political dialog so that for you, even within the government, this really enables you to do better advocacy work.
Miss Astou Diouf from Senegal, if you could talk to us about your opinion about how the process, the BSDD process had changed the national digitization culture within Senegal. We have participated in multiple sessions together. So we’ve talked about this. I would like to know, what do you think about this process and how it has changed the budget budgeting process in three minutes, please.
Astou Diouf: Thank you so much. Miss Fall and members of the panel. Yes. My mic is on. You can hear me.
Aïssata: Yes. Yes, we can hear you.
Astou Diof: Yeah and thank you to the CREG for your presentation. And then thank you for Burkina Faso there is moving in the right direction. And Senegal is working on establishing the means and ways to implement BSDD. And we want to see the methods of application for BSDD. Now in terms of structuration as a function of the budget we have. We are aware of the study published by CREG recently, Senegal. You know, if you look at the various functions human capital, economy, governance, etc.. There is a single dimension that is at 52% for us, it’s the human capital where we talk about the main levers of the demographic dividend for education and health, where 22%. So the figures that have to do with these various dimensions are important for us. And we were able to note an interesting trend between 2011 and 2019 in terms of performance. But given the things that have happened on the past few years with political tensions we are not certain that this trend has been confirmed. Um, the situation has led us to open dialog with various actors. Beyond the studies, we are communicating with this key sectors and we are also undertaking a series of advocacy efforts with the sectorial ministries, the parliament, civil society. And so these will be cooperation sessions that are going to be ongoing. Now in terms of budgetization, we feel this is a good opportunity to address indeed this this issue of the BSDD by and also in adhering to what is of most interest to us now in analyzing DDMI for Senegal, we saw that it remained very weak among women 35.4% among women in like 47% among men. So we have a lot to do, to catch up. And we are one of the countries that joined up with SWEDD project and so we want to pursue the ongoing objectives to really undertake BSDD. So this means that we must raise awareness among policymakers and also we must increase capacity build among the various actors. And this is where the CREG does a lot of work with to enable us to put in place BSDD and to really reduce inequalities between the genders.
Thank you.
Aïssata Fall: What’s interesting is, once again, we are hearing that BSDD is an interesting objective to really improve and optimize public expenditure. It is a reading of budget programing. It is a different reading of budget programing in terms of DDMI and this other dimension that enables us to look at what’s going on in our countries in a different way. And it’s really, it’s been a new way of thinking about things and the ability to do this internal advocacy for it to have more effective public expenditure.
Um, Miss Mariama from Gambia. Can you hear me? Your camera is off. But thank you. I would like to know. So. Gambia. The Gambia undertook the first steps the NTA profiles. I know you are undertaking a study, an investigation on the use of time in order to create an NTTA profile, and I would like to know your opinion as to why The Gambia is undertaking this process. And you know what do you think of it in terms of the you in comparison to the usual practices? And what are you hoping to achieve from this? What are your expectations? Thank you.
Mariama Fanneh: Thank you very much. Thank you to CREG and PRB for the opportunity to attend this. Um, I don’t know whether I’m.
Aïssata Fall: The sound is very very weak.
Mariama Fanneh: Is it still very weak or is it okay?
Aïssata Fall: Is it okay for translation interpreters? Okay. Go ahead Mariama.
Mariama Fanneh: Okay. Thank you very much. Thank you very much CREG and PRB for the opportunity to attend this important webinar, which is key for building the capacity of technicians and getting the support of policymakers. I hope this is something that you’ll be organizing often. Regarding, why we want to apply the BSDD process and why we want to continue ensuring that the Gambia harness the demographic dividend. The reason for wanting to apply the BSD process is because the Gambia now stands the pivotal moment when it comes to harnessing the demographic dividend. Uh, because when the demographic dividend profile of The Gambia was updated, we realized that we have a steep increase in our potential for harnessing the demographic dividend. And also following the updating of our BSDD profile, we also developed the demographic dividend monitoring tools. And this we did with technical support from CREG through the World Bank project, which is the SWEDD Plus. So we develop the BSDD like Professor Dramani, he was explaining. And these are tied to the four pillars of the AU for harnessing the demographic dividend. We have the profile ready and we also have the DDMI, which is the diagnostic tool. But it was very unfortunate that at the time of developing the NTA, we couldn’t develop the NTTA because we didn’t have the data on time use but we are currently working on that because we know women contribute a lot when it comes to the GDP, but it goes undocumented. And we want to know how much women are contributing when it comes to the GDP.
Currently in the Gambia, Aïssata, it’s very difficult for us to be able to harness the demographic dividend because of the budgeting system that we have, which is the traditional budget. And we know that for the traditional budgeting approach, it’s mostly about maintaining fiscal balance and allocate funds based on past spending. And it’s also addresses immediate needs without considering long term demographic trends. For instance, when Professor Dramani was explaining, my mind went to, um, you know, um, what happened last year with the budget and that is how I’m sure a lot of countries that are budgeting based on the traditional, system of budgeting, that is how they budget, because for last year’s budget when it comes to education and health for education, it was 37.3%. And for health, it was 17.1%. And when it comes to youth empowerment and employment, it was 0.01%. And we know that for a country to harness the demographic dividend, especially for a country like the Gambia, where you have 79.2% of the population below the age of 35, and we’ve also have had a decline in child dependency between 2013 to 2022. Our child share dependency declined by 10%. And we know that that is one of the prerequisites for the opening of the window of opportunity for addressing the demographic dividend. Going back to the numbers that I just mentioned, 37.3% and 17%. Yes, that is the percentage of the budget that goes to health and education. What are they going into service provision? No. Most of our budget goes to recurrent expenditure. So in having a DD sensitive budgeting we’ll be able to know what is going well, what is going to service provision and also what is going to a recurrent budget, because we know that we recurrent with most of our funding going to recurrent budget might be impossible for us to harness the demographic dividend, knowing that the current opportunity will not last forever. It’s expected to peak in 2035 and close by 2050, depending on the DD profile.
The demographic dividend is also not automatic, and we know that is the potential that must be harnessed for economic growth and development. Therefore, I think it’s very, very important for us not only to also go ahead and do a time use survey and develop the entity profile for the country to know women’s contribution to the GDP. But it’s also a very, very important for us to have a budget that is really responsive to the demographic dividend, a budget that is conducive to harnessing the demographic dividend, and that is the DD sensitive budgeting. And we’re looking forward to really getting the support we able to transform our budget into our budget that is sensitive to the demographic dividend. Thank you all very much for your kind attention.
Aïssata Fall: Thank you very much, Miss Fanneh. It’s very interesting to hear what you were explaining about the classical manner of establishing a budget, and to into relying on recurring expenses last year’s budget, without wondering how does this contribute to the various dimensions and the objectives that are necessary in order to take to benefit from the demographic dividend, without also wondering whether these expenses contribute or make use of the demographic dividend? You know, and having zero invested in youth when you have such a young population is very striking. So I would like to speak a little bit about how this process started and how the countries integrated the various questions and challenges in their budget.
And now I’ll talk to Pr. Germaine Anate, Togo, so you are in the National Assembly, which he has not necessarily been involved in this work in the beginning because it’s a very technical type of work. But the tools are here, and in the end, it is the National Assembly that must approve the budgets, that must support policies that will strengthen efforts to take advantage of the demographic dividend. So for you, what are the specific roles of the gender dimensions and what role do they play in your budgeting process and your decision making process at the National Assembly? And how can BSDD help us to help you to deal with this, these issues of gender equity. You have the court, you have the floor.
Germaine Anate: Thank you for having inviting me to participate. You spoke about the fact that the process has been very long. And forTogo, we must say that the opportunity we had is that in Togo we had a gender sensitive policy. We also had a budget program that included pretty early on the gender issue and this has improved over time. And so the current version that is being finalized, it includes this. So this has been mainstreamed throughout all the various ministries and institutions. And it has taken into account in the 2025 budget, which is being finalized. And so Togo, you know, is taking advantage of the fact this mainstreaming of this issue in its budgeting and to take advantage of the demographic dividend. And really, this is something that’s been accomplished because the draft budgets are currently being created and this dimension has been included in it you know and and I mean, so in term we’re going to allocate amounts to every action activities and taking into account gender and demographics.
Next, I would say that the gender dimension has an essential role in the budgeting process in Togo, especially given the National Gender policy that has been put forth, and that establishes gender units within each ministry. And Togo is also working on gender equity and the empowerment of women. So in terms of strategy, this gender dimension is already taken into account. And to really enable all levels of the population to participate and benefit from development. This effort was undertaken in 2020, integrating gender into the budgeting process. I am not going too long on the budgeting issue, but we must recognize that, you know, during the budget cycle, yes. We have included the gender dimension you know, in terms of the budget, audit, etc.. And but we must say also that BSDD data is taken into account in the improving of budgeting that is sensitive to gender and in terms of the specific role of the gender dimension. For me, it’s really a function of facilitation and a translation of public policy, because it is particularly about facilitating and making sure that the budgeting process is inclusive throughout all its steps, and to ensure that women are direct beneficiaries of budget allocations that have been justified by supported by these criteria. And, you know, in my position when we, we look at the line item that is dedicated to gender to make sure that the allocation is there and that it is what it should be and that it is not actually used for something else. So there’s this role of facilitation, and we need to also monitor the governmental policy.
[The interpreter apologizes. She cannot hear the speaker anymore.]
So for a parliamentarian, this is very important because we monitor government activities. So we, you know, taking this into account to have a more aware review of what’s going on when we are asked to review the state’s budget. So in Togo, the BSDD is really going to enable us to strengthen this gender issues to reduce inequalities, and particularly in terms of investments for young people and for young women, young girls, and also for health care. And let’s recall that Togo joined the project for the Empowerment of Women and for the demographic dividend in sub-Saharan Africa and one of the results of this study is BSDD. So this is what I have to say.
Aïsatta Fall: Thank you so much, one certain women must be the beneficiaries of allocations for which they serve as a pretext and this is a very important topic, you know, because to budget for gender is one thing. Budgeting for women. Yes. But what is the impact and how do you monitor the efficiency, the effectiveness of the allocations, the effectiveness of the policies. So this is a tool that enables us to do this progressively. But also to analyze these policies in a different way. Uh, thank you very much Honorable Anate.
Moussa Sidibe from Mali, you are next. Could you talk to us about what are the assets, what are the challenges associated with BSDD at this current time, especially for the improvement of social sector planning? You know, this has to do with finance, budgets, taxation, etc. You know, we have had research in economics, demographics which and then tying this to planning needs. So budgeting is not just within the Ministry of Finance. You know the ministry; it the ministry must understand how the social sectors function. And so for you, what are the advantages and disadvantages of BSDD?
Moussa Sidibe: Thank you very much, Miss Fall. Um, hello to everyone and I want to specify that in Mali and this exercise was made possible in Mali thanks to certain number of advantages we have. The first advantage is an observatory for the demographic dividend. And it is a sustainable observatory in Mali. And it is able to continue to studying and research work in terms of the economy specifically, the analysis of budget of BSDD in order to improve budget allocations to very basic sectors and to improve health, education, etc. Our second advantage is the existence of a national multidisciplinary team that is a part of a network. And so we people who are working at the national level and they’re working on overall statistic systems and they support the observatory’s work. Um, and this multidisciplinary team is really an advantage for the creation of reports on BSDD, and they contribute to the strengthening of national expertise in BSDD.
So there is also a center of this means that we have um, a ministerial and parliamentary system that is well informed and that enables us to have an optimal distribution of the state budget to achieve sustainable growth.
So first I will note the budget general Directorate, the uh Directorate for planning And the National Council for transition. So all these structures are key actors in budgeting in Mali. And they were all trained and informed about the importance of BSDD. A lot of the directors of these entities have visited, uh, Senegal with the CREG to undergo training on these issues, and this has enabled us to get things started and to make it so that they could be advocates on this issue. And the last advantage is really taking into account the results of BSDD in the formulation in terms of human capital as stated by CREG. So this is really a document that was created to federate all the bring together all the policies in Mali and we are participating in the monitoring of this as well as working on the promotion of BSDD. So these are really the advantages, the, the assets that we have within Mali. Of course, there are challenges that are present. I can talk about five of them. First, the need to have reliable data, up to date data, the regular production of statistics is essential. And then the strengthening of national capacities to ensure the creation of regular reports on BSDD. The lack of a strategic plan for communication on BSDD. The strengthening of the partnership with the research institutions, the technical partners, the financial partners, etc. to mobilize financing to sustain the research needed on BSDD and the improvement of the security situation within the country. Um, you know it. We know that the issue of security, especially in the states of the Sahel, means that there are elements that are detrimental to human capital, especially when we’re talking about health and education. And even if we are able to maintain certain rates, the movements of the local populations, unfortunately, can sort of cancel out a lot of the efforts undertaken by the government. So this is a summary of what I wanted to say in response to your question.
Aïsatta Fall: Thank you so much. Thank you for that very good summary. And I think it’s very interesting that you talked about your assets, but also the challenges, but you also highlighted some of your assets that are helping you having the observatory, for example, for demographic dividends, that was created by law by a decree, and that this then provides a sustainable structure. And this is in fact a very useful in giving you the favorable environment, the necessary environment you need to do conduct these studies and analysis. I think it might be difficult to be able to really use the data on a regular basis, long term basis for these analyses. If you didn’t have these types of structures in place, and the fact that you have a lot of stakeholders that are engaged in the process and it’s a true collaboration amongst the various government bodies, decision makers and analysts. This is also one of the advantages and the fact that you’re working in such a collaborative manner with decision makers and analysts. I feel that this is really essential in order to bring about sustainable change.
Talking now still about collaboration and participation. Participatory processes. I’d like to come back to Dr. Larba from Burkina Faso and I’d like to ask you, because you’ve been doing this process for some time now, if you could talk about some of the challenges you’ve had in integrating these tools in your national budgeting processes. And you were saying earlier you were talking a little bit about how this knowledge and these techniques are also impacting other people who are involved in budgeting decisions and at various levels in various spheres.
Doctor Larba, can you hear me? Uh, okay. If not, I will come back to Dr. Larba. And so maybe I’ll go back to Miss Diouf and so Miss Diouf, can you hear me? Can I come back to you?
Atou Diouf: Yes, I can hear you.
Aïssata Fall: Okay, great. Miss Diouf, can you quickly share a few words about some concrete examples of how you’re using the BSDD and how this could, in your opinion, approve the planning and implementation of public policies in your country and particularly for gender equity, and I say could improve because I know that you have been making efforts and you’re and I know that you work specifically on gender equity. So how do you see this tool helping you to achieve your objectives for gender equity?
Astou Diouf: Thank you very much. That’s a question I think we could ask all the questions or all the countries rather, because the most vulnerable population in Senegal is the youth population, as we’ve seen in our recent census. And Senegal, like other countries, also has a demographic dividend National Observatory. And we also have a focus on gender equity. This observatory is also a multidisciplinary multisectoral and it does bring together all the different decision makers from the various sectors. So I think what we need to do more, though, is we’ve started with these studies, but it’s been a bit of a slow start and I think that we need to continue conducting more studies and perhaps more thematic, specific studies. But for those of us who are working on gender equity issues at the national level, we’re now in our third edition. We’ve been doing this for two years of what we call our forum of dialog forum. And this is a forum really looks at the challenges and addresses the obstacles of for integrating these techniques and whether it’s the BSDD or the gender sensitive budgeting.
And whether it’s at the dialog forum or the national Observatory we have been trying to identify our priorities And I think that looking at the biggest issue or the biggest aspect of demographic dividends is human capital, and we need to look at how we can better understand this through our analyzes and studies. But we’ve also been drawing a link between gender sensitive budgeting and demographic dividend budgeting. I say that because in 2016, we started initiated, we started initiating more gender sensitive budgeting. And we observed that some parliamentarians, those who deal specifically with the budgeting process are now more willing to use these instruments and these tools. But another key element that I think has helped us to make improvements is that we were talking to decision makers before we even before they even undertake the budgeting process to show them what some of the weaknesses are, but also some of the key points that policies need to focus on and the impacts that we can have. And I think it’s important that we’re promoting these issues.
And then when we look at gender equity and investments because obviously economists know these issues better than we do but we have to look at these different dynamics and some of these criteria that are related or aligned with international standards and norms. For example, we need to be talking more and more about the issue of what the stakes will be at the international level. At the national level, when we look at these different dimensions that we can we have to see how we can really implement, bold and gender sensitive budgeting in our countries. And I think that this is going to be an essential issue for all of our countries.
Aïsatta Fall: Thank you very much. I’d like to go back now to Mariama, Miss Fanneh, and I’d like to ask you, how do you envision the future evolution of demographic dividend sensitive budgeting in your country, and what additional support would be needed to strengthen the BSDD approach? We’ve seen that this is a very long process, and if we want it to be inclusive and have a holistic approach, and if we want it to be supported by the community of decision makers and politicians and you might need different supports when you start up, because you have to look at all the different fractures in the budgeting process. So over to you, Mariama, to answer that question.
Mariama Fanneh: I thank you very much Aïssata for again giving me the floor. Uh, the demographic dividend sensitive budgeting, if implemented like we already know where to implement it in the Gambia, will represent a strategic shift from traditional budgeting to a more dynamic and data driven approach. A responsive to demographic dynamics and allocating resources to sectors that maximize the harnessing of the demographic dividend. Currently in the Gambia, not only in the Gambia, but across Africa. We are at a crossroads. We have seen and we need to empower our Marimar.
Aïsatta Fall: Apologize. I think it’s quite low. Mariama. Your sound is really low.
Mariama Fanneh: Let me. Let me move it closer to my mouth. I’m saying it’s okay. Can you hear me now?
Aïsatta Fall: Yes. It’s better. Yeah, better.
Mariama Fanneh: Sensitive budgeting, if implemented in the Gambia, will represent a strategic shift from traditional budgeting to a more dynamic and data driven approach, responsive to demographic dynamics and allocating resources to sectors that maximize the demographic dividend and that is what we want in Africa. Because if you look at Africa currently with its very young population, all the countries stand at critical crossroads. We have seen what happened in Kenya, and we have also seen what happened in Ghana lately and in the Gambia. Anticipate a Gambia with a budgeting system, if implemented, that relies on a comprehensive analysis of its budget utilizing demographic data to inform policies and investments anchored on proactive planning for population change to ensure that long term benefits of the demographic dividend foster a robust and adaptable economy. When it comes to the additional support that might be needed. We know that transitioning to a demographic dividend sensitive budgeting might encounter resistance from those accustomed to traditional budgeting. We all know that change is not something easy, and every sector would see their structural budget as being very, very important. So if we want to overcome this challenge, it necessitates capacity building for government officials and policymakers through targeted trainings like the ones that we are currently having.
The Gambia, like many other nations, also faces economic pressure due to the Russia-Ukraine war and high debt levels. And the BSDD can help prioritize spending and accelerate the country’s transformative agenda to fully realize the BSDDs potential ,The Gambia will require increased financial resources, technical assistance, and a robust data infrastructure. Gaining public trust is also very, very important. The public needs to be needs to be aware of the importance of this very sensitive budgeting and here to transparent communication, public awareness campaign and feedback mechanism will be very, very important for building support for BSDD and aligning it with citizens needs and aspiration. By prioritizing these areas, The Gambia can effectively harness its demographic dividend, attaining sustainable development and a prosperous future through BSDD. Thank you very much for your kind attention.
Aïssata Fall: Thank you, Mariama. That’s very interesting and as I heard you say, it represents a big change, a shift for something that to something that’s going to be more dynamic and more in line with the reality of your of your objectives.
In the interest of time, I’m going to have to just pass out my questions a little bit more. So I’d like to go back to Mr. Sidibe from Mali and ask you, generally speaking, with the experience that you’ve had. What needs to be done, not necessarily in Mali, but also with your experience with SWEDD project that’s been done in many countries in the region. And knowing what’s happening in other countries that are at different levels of budget execution, in your opinion, what needs to be done to ensure the effective dissemination of this new tool, in that it involves a more active and targeted knowledge sharing process to create a measurable impact. We see that in Mali you’ve been reaching out to decision makers and you’ve been working with many stakeholders. So it has this enabled you to bring about this change in budgeting culture in all sectors? And looking at one of the questions in the chat, specifically looking at the social sector, have you seen this change, change of culture?
Moussa Sidibe: Thank you, Miss Fall. Yes, it’s true that there have been advantages, but we have not yet achieved all of our objectives and we need to still work more on communication. I think that first of all, it’s important to strengthen our communication capacities for the decision makers and policy makers. We need to be able to continue developing more communication tools, such as policy briefs, that we can disseminate to Parliamentarians decision makers to help create a more measurable impact. I think it is also important to hold advocacy sessions or educational sessions to be able to get this information disseminated out to the various regional levels and the different sectors that work with women or youth, etc. and to do this throughout the entire country even at the community council level, because not everything is decided at the national level, but even at the community level, the local level, there are very decisive actors who do have an impact on how these the budget is allocated and used.
We also have to involve civil society organizations more, and we need to work more with the media so that they are more educated about these budgeting issues. We need to have more citizen focused budgeting, if you will. And we need to be able to create allies to help us with this advocacy work with members of Parliament and decision makers. We need to see how we can mobilize civil society actors, the media and by holding educational workshops about the budgeting process and to see how civil society organizations can maybe organize meetings or educational sessions to talk about what we can do to advocate for this and I think we need to also encourage, um greater publication or more wider publication of the results of these analyzes and studies. I think those are the key points that I would like to offer. Thank you very much.
Aïssata Fall: Thank you very much. So to briefly, Honorable Anate, if you could, you spoke about the importance you minorities spoke about my question during your first response. So I would more ask, I’m going to ask a concluding question instead, as a parliamentarian who knew this type of information, we met in Togo during presentations on exactly this type of information. And, and I’m grateful for this meeting because it was really interesting to be with this network of former and current women parliamentarians. So a decision was made to work on advocacy towards the Prime Minister to not improve things for civil society, but to make it so that the various sectorial departments would be involved directly into what was just said.
Now, as a parliamentarian what is your advice or what are your ideas in order to improve the use of this type of information that is provided by the BSDD? Because it is the BSDD it’s a process, it’s a tool. So it’s really about it’s new way of looking at things, these tools that it provides, this information, it provides. So as a decision maker and we don’t have enough I think in this type of session, what would you say?
Germaine Anate: So yes, as to sum up, essentially, I think the data provided by the BSDD is contributes to improving budget allocations to meet the development challenges in the country. But we know that the budget is developed on the executive side and then the parliament is called upon to approve it. So it is really having this data for the parliamentarians in order to vote on laws that are appropriate to meet the needs of the populations. You know, this is essential. And I wanted to come back to this question of national work on BSDD. I think, you know, desperately provides the opportunity to really seize upon all this, to capture this work at the national level and especially for women. And because we know that women are in this informal work sector and they are they’re numerous within this sector of the informal work. So I think we can have a really have a better understanding of BSDD on work in the household, you know, the work of young women of women. And with this data, we could develop strategies and policies that could sort of perhaps reduce this informal sector so that we have a greater formal sector. And this will be more advantages in terms of the empowerment of women. And we had recently the opportunity thanks to the PRB and the CREG initiative on awareness raising among parliamentarian, women and Ministers but this enabled women to better understand the topic, to take a greater ownership of this topic. Because one of the big challenges is the taking ownership and the understanding of this topic.
And someone talked about, you know, training on communication. And I think this is something I really want to emphasize. We must have more awareness raising including at the parliamentarian level. So I would ask PRB and CREG to continue this work, but I think we also need to make it so that the state institutions in charge of these issues share this information. Because, you know, what I realized during this is that those who hold who have information within our institutions they don’t disseminate. So we must have a better dissemination of information and this will really help parliamentarians in this process. And the other challenge I want to note in the Parliament Arena, is we must, like the Togolese Parliament, must really invest in research and investigation issues to provide to get the data that we need to carry out our functions. And we’re also called upon to question the government and, and we must do it in a way that is well informed.
And so you know, and of course, in connection with gender and demographic policies and for the development. You know, we talk here about the government’s roadmap and if a parliamentarian is well trained and is well aware of the topics, this really helps. So we have a commission that is responsible for these social issues. And so we must make it so that this commission is better trained and better informed. So there are a lot of challenges, but we can’t, you know save money on communication etc.. It is really essential to have this.
Aïssata Fall: Thank you so much. Thank you for what you said. We’re talking about, you know, the dissemination, the provision of information as well as the resources, the tools, so that they can be used in an effective manner. So it’s not just a question of providing information. Um, you know, it’s really we want to see how this can be adapted to those who are going to use this communication. I’ll ask one last question of Dr. Larba, if you are back with us?
Dr. Larba Issa Kobyagda: Uh, well. Uh.
Aïssata Fall: So one last question rather quickly because we need to finish. But given your experience I’ll ask the same question I asked the other participants to documents are created reports, sectorial reports there are conversations. Is that sufficient? And it’s not just about Burkina Faso, but you know what? What would you say? What would you advise to improve this national cooperation and to take advantage of this demographic dividend. You know, this is really we’re not just talking about a five-year plan. We’re talking about a whole change in governance. So in two minutes, what would be your the essential points that you would advise to take into account. Thank you.
Dr. Larba Issa Kobyagda: I think very quickly, I think we have to talk about the, the obvious really. Um, so the state budget is voted on by the various parliaments. So it’s only evidence that is going to prove to governments that they must use this type of budgeting. So the results and, and the results that have been shown by the scientific research that show us that BSDD can really benefit us in, in taking advantage of the demographic dividend. So the planning that is done within our various governments, it already takes into account this issue of populations, youth, empowering women. But what we noted in Burkina Faso is like despite the fact that we had all these programing documents you know, so all these documents were there and, and it stated that there would be a very important role. But from there, um, there was not a you know, that something that made it possible for this youth to bring a added value. So the policymakers, etc. members of the government must be fully aware of what is important, and then we must work so that the results of this research do not remain disconnected from policies, from politics. So say we find very interesting results, but we have problems contextualizing things. So if you look, for example, at the Sahel context currently with the security challenges, it is very difficult to ask a country that is just really trying to survive, to ask them to attribute a huge part of their budget to a particular sector when they really need this money to just survive. Um, so, you know, we must look at research, we must look how in these the findings of research can have a result can achieve results depending on the context. Then we have Civil society can disseminate results of research through the research centers. I saw that, the University of Berkeley provides data in this area, but you know this data is perhaps not so relevant to a farmer in Burkina Faso, etc. So what makes it possible to use this is the state local authorities. So we must continue this awareness raising effort. So the research institutes must provide the finding but we must continue also to disseminate these results.
Aïssata Fall: Thank you so much, Dr. Larba. Um, when you talk about, you know, the involvement of the population, civil society and to keep research connected to reality and to day-to-day practices. I wanted to note something that Mr. Sidibe spoke about the fact that and when he talked about decentralized authorities, budgeting is not something that just exists at the national level. The integration of, you know, the gender dimension and demographic change. It’s not just a theoretical thing. It’s something that happens in real life. So having an approach that informs reality but takes context into account and to have, you know, an understanding from the population so that they don’t necessarily understand the technical aspects, but how this can be useful. You know, so having a dialog at a decentralized level in every space where you can have a budget discussion, where citizens can talk to those who are elected, you know, this is a very beginning. It’s not an end product. You know, this is a continuing process, under many, you know, and there will be other dimensions that will be refined. But this provides us a very solid base to start talking about how our economies operate in terms of money, the flow of money, and in terms of time. Um, so when you can illustrate the links between, you know, this, this way of thinking and the budgetization etc. it’s so we need to understand how research can, um, have an impact at the various levels of decision making. So we hope to be able to continue what we just started and with you and other countries to conclude and thank you for having remained so late with us.
Now I’m going to give the floor to Professor Dramani. You started over ten years ago, an adventure that has created tools that are used in many countries. BSDD is a performance indicator for countries that are taking part in this web project. So you’re a researcher, but you regularly talk to decision makers. So this process was a collaboration that was undertaken in a holistic manner to meet the needs of decision makers, policy makers, to answer their questions. So very briefly, could you tell me what is the risk in terms of future development that doesn’t take into account demographics and gender? And how do we speed this up? You know, demographic transition, the demographic dividend. We talked about it 20 years ago, but now the windows are opening up where we need to speed up. We need to accelerate this work.
Prof. Latif Dramani: Thank you. Yes, thank you Aissata and thank you to all the panelists; Dr. Larba, Mr. Sidibé, Professor Anate, Ms. Diouf. Oh, I almost forgot Miss Fanneh from Gambia. But thank you to all of our panelists and to everybody who has stayed online till now. When we started this work. It has been it was it has been a long process, It’s been a long road and I would like to thank all the foundations that have enabled us to do this work. I think that our dean is on the line and I’d like to thank him and all everybody that we’ve been working with for the past ten years to develop this tool, UNECA, Hewlett Foundation and all the many partners. Uh, and I think that really the fundamental issue that we have to grapple with now is that today we no longer have the choice, African countries no longer have a choice. They have to review their budgets and rethink them, because it’s not just private funds or donations that are going to develop our countries. It’s our national budgets. And so the collective well-being of our populations is something that’s going to be ensured by our investments and investments to increase our productivity and our growth. So these are investments that we have to make in health and education and so forth, and infrastructure In order to enable our economies to create the jobs that we need and to be able to spur growth. So this issue is fundamental if we don’t take this into account the economy.
If we look at the history of economics over the past centuries of study on the problem of poverty we cannot resolve issues of poverty, you cannot resolve issues of an aging population unless you take these issues into account. You have to be able to use these windows of opportunity and when you have an aging poor population, that’s a catastrophe for anybody. So you have to use these windows of opportunity that are opening for everybody because you can’t just think about this and without realizing that the best thing for all of us, for our decision makers and our and our continents, our countries, is to invest in our youth and to be able to really profit or to really capture all the dividends from this youth, this energy and their productivity. This is something that’s going to be beneficial for everybody, for future generations, and as part of this work, what we observe Dr. Larba talked about this and others is that it’s the research is not always easy because we work a lot. We spend a lot of time to obtain these results, but sometimes our politicians or decision makers don’t have the time to sit down and discuss this with researchers. So what we really need to do is to make sure that people understand that research is extremely important, and it’s going to play a crucial role in decision making in our countries. And that we also need to be able to duplicate these successes. When we see their successes, we need to achieve a critical mass. We need to be able to have a critical mass of people who are dedicated to working on these issues. And we have to create centers of excellence, centers of excellence, rather, where we can train people to continue this research and where we can also continue implementing good best practices and monitor what we’re doing. We need to control or monitor the quality of data that we’re obtaining. And we have to really look at the fact that our continent is one of the youngest right now. And other countries, other continents are not facing this issue. Asia, Europe, they have a more aging population. They’re not dealing with this issue, they have an aging population, not a youth population, youthful population. So we need to look at how we can apply best practices and continue this work. Thank you very much and back to you, Miss Fall.
Aïssata Fall: Thank you very much, Professor Dramani. That was very encouraging and very convincing. I think that indeed we know what we can do and we need to do it. The work that we’ve been doing, the collaboration with CREG and the various countries that are partners in this project with and funded by the Hewlett Foundation. This collaboration has enabled us to see just how far we can really use our technical assistance to work with different actors and of course, in this process, which is highly based on analysis and research, we can see how we are, how we can continue to define our priorities and to look at finding the most effective solutions. And I come back to what Dr. Larba was saying earlier,there’s not necessarily just a standardized solution. There’s a lot of common research, but we have to adapt it to our different contexts, and we have to do this work of looking at contexts and how we can continue refining the research and the techniques and the language that we’re using the approaches. And this all has to be based on the context and I think that in our various presentations and in the answers and responses we have, we see that it’s important to look at productivity and we have to of course, we think about this at a high level, international level. But we also have to look at it at a decentralized level as well. And we have to see how the data and the BSDD process can help us continue with advocacy, advocating for change, the changes that will be implemented in countries based on context. But this is a huge change in mentality where we’re setting aside our traditional budgeting Processes of whether it’s programmatic based and then looking at how we can adopt these new budgeting processes. And this is something that is going to enable us to also promote our goals of having more transparent governments.
I would like to thank everybody who was part of our panel today, and thank you for everybody who stayed online a little bit longer than planned. Uh, I know we had these technical issues, but of course this happens from time to time. There’s nothing we can do about it. And we hope to continue this discussion. As many people have said, we do need to continue this discussion and dialog because these are areas that are not always as discussed as we should in our various African countries. Uh, we need to be able to translate these tools and use them. And as I said at the beginning, all the questions that were asked will be answered. We will also share the presentations and the recording of the webinar, not right away, but because we are trying to think about the best way to share all this information.
We don’t want to just send out the presentations because there were things that were said today during this webinar that are extremely interesting and could be the topic for a further a future meeting. And somebody, many of the questions that came in and writing were also very interesting. And we’ve had a lot of people in this discussion talking about the youth potential, the demographics of the dividends and so we will be looking at how we can incorporate all this and so that people can understand what we’re talking about today. We need to include not just technicians and analysts and politicians in the debate. It’s important to also bring in many other stakeholders in different countries to talk about all these different issues along the whole decision-making chain.
And so we will, of course, have to think about how we can involve the young people themselves. The youth who are working at various levels every day to improve their futures. So how can we also include them more in this dialogue? It’s not something that we can just talk about at a theoretical level that has no interest. We need to talk about how we can change our political cultures and how we can really have a more effective dialog, including youth. So we will have future webinars where we can have discussions focus more, maybe on the policy side of things. We’ve been talking a lot about the technical side today, but we will also be talking about how we can use all these processes, this data, and how it can be better integrated into your role as a decision maker or a policymaker.
Thank you very much for being with us today. I hope you all have a wonderful rest of your day and I hope to see you soon. Thank you.

Date
January 15, 2025
English Publication

PRB created The KIDS COUNT Data Resource Guide to facilitate the use of population data from the U.S. federal statistical system. Originally designed for the KIDS COUNT program on child well-being, the guide offers practical advice on how to use major data sources—from the Decennial U.S. Census to the National Vital Statistics System—that could be helpful to anyone who works with U.S. population data.
The guide includes an overview of each major data source, including what data are available, how to access that data, and some best practices for using each source. These sources provide up-to-date and reliable information that is comparable across all 50 states, the District of Columbia, and, where available, Puerto Rico and the U.S. Virgin Islands.
Data sources covered by the guide include:
- Decennial Census
- U.S. Census Bureau Population Estimates Program
- American Community Survey
- Current Population Survey
- National Vital Statistics System
- National Survey of Children’s Health
- Small Area Income and Poverty Estimates
- Small Area Health Insurance Estimates
- National Center for Education Statistics
- And more
The KIDS COUNT Data Resource Guide also includes a brief overview of best practices that apply across data sources, such as assessing reliability, making comparisons, and disaggregating by race and ethnicity.

Research Technical Assistance Center
Date
December 30, 2024
English Publication
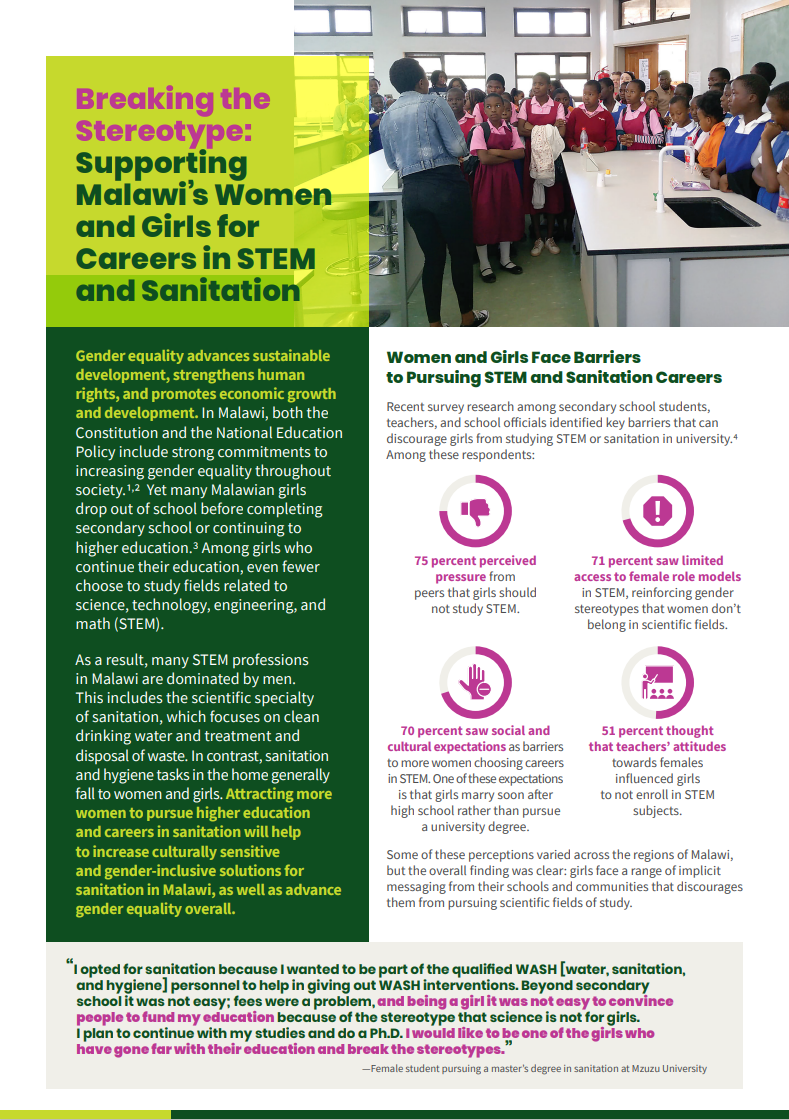
Gender equality advances sustainable development, strengthens human rights, and promotes economic growth and development. Even with commitments made by the Government of Malawi to increase gender equality throughout society, many Malawian girls drop out of school before completing secondary school or continuing to higher education. Among those who remain, even fewer chose to study in fields related to STEM and sanitation. As a result, many STEM and sanitation professions in Malawi are dominated by men, even though sanitation and hygiene tasks in the home general fall to the women and girls. This factsheet shares recent survey research from Mzuzu University and explains how attracting more women to pursue higher education and careers in sanitation will help to increase culturally sensitive and gender-inclusive solutions for sanitation in Malawi, as well as advance gender equality overall.
Research Technical Assistance Center
Date
December 30, 2024
English Publication
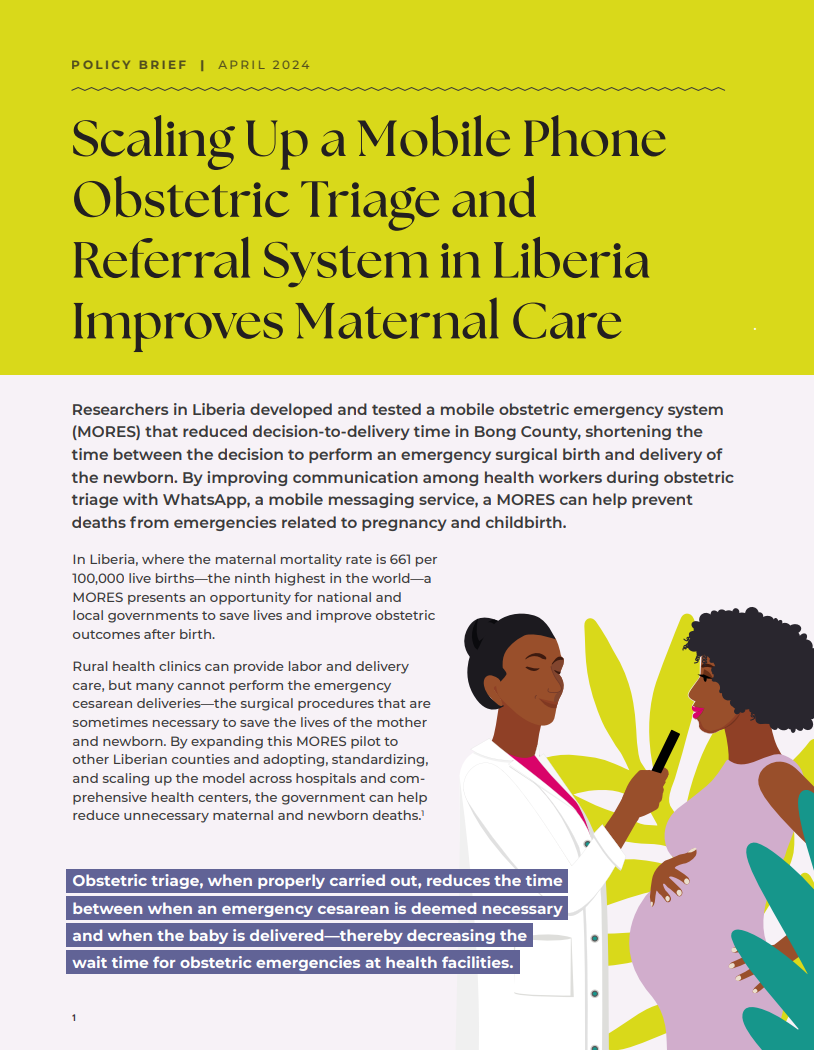
Researchers from the University of Liberia College of Health Sciences, in partnership with the University of Michigan School of Nursing and the Kwame Nkrumah University of Science and Technology, developed and tested a mobile obstetric emergency system (MORES) that reduced decision-to-delivery time in Bong County, Liberia, shortening the time between the decision to perform an emergency surgical birth and delivery of the newborn. By improving communication among health workers during obstetric triage with WhatsApp, a mobile messaging service, a MORES can help prevent deaths from emergencies related to pregnancy and childbirth.
This brief provides additional information on cesareans and triage and how better communication can be lifesaving for mothers and newborns. In addition to sharing details of the research and an example of closed-loop communication system at work, the brief provides two recommendations for the Liberian Ministry of Health to reduce decision-to-delivery times and improve perinatal outcomes, thereby saving lives.
Research Technical Assistance Center
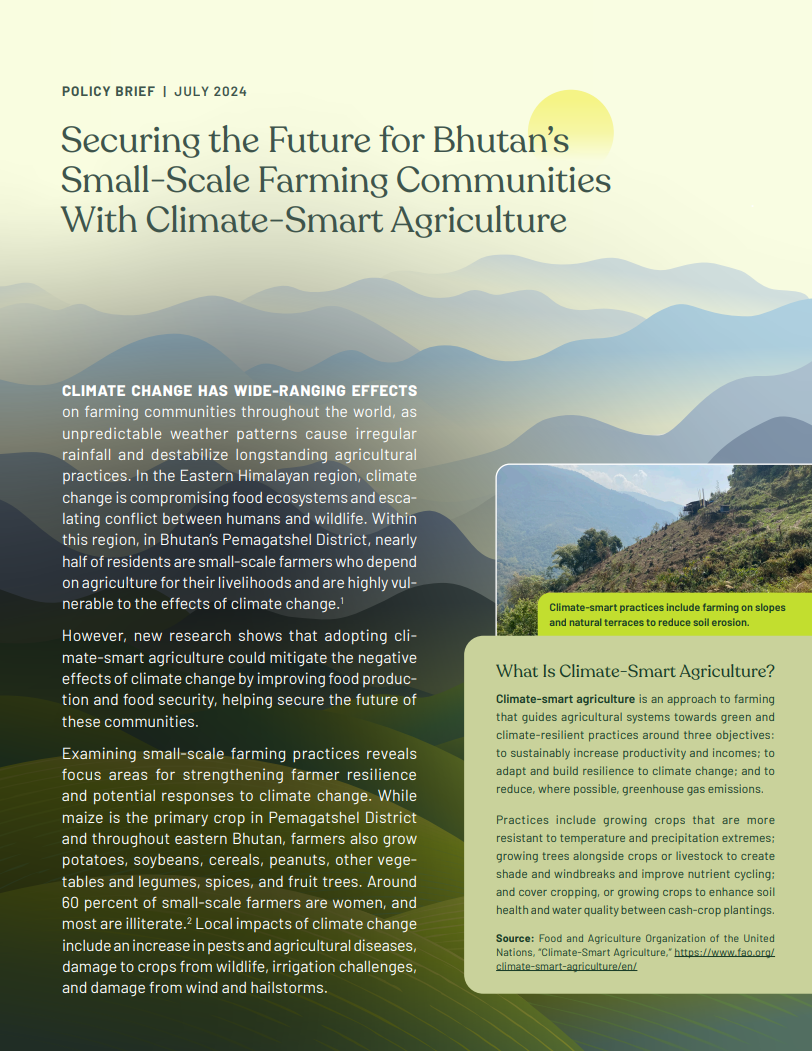

Climate change has wide-ranging effects on farming communities throughout the world, as unpredictable weather patterns cause irregular rainfall and destabilize longstanding agricultural practices. In Bhutan’s Pemagatshel District, climate change is compromising food ecosystems and escalating conflict between humans and wildlife. Nearly half of the district’s residents are small-scale farmers who depend on agriculture for their livelihoods and are highly vulnerable to the effects of climate change.
To help address these affects, new research from Royal University of Bhutan and the University of Montana examined how adopting climate-smart agriculture in small-scale farming practices can help mitigate the negative effects by improving food production and food security. This brief shares provides additional background on Pemagatshel’s farming practices and climate-smart agriculture and shares how the key research findings reveal promising opportunities. The brief concludes with three recommended actions to protect Bhutan’s small-scale farmers from climate change.
This brief is available in English and Dzongkha.
Webinar: How State Contexts Impact Population Health
Date
December 2, 2024
In this Nov. 14, 2024 webinar, two distinguished researchers discussed how U.S. state policies and systems can affect racial and regional inequities in health and longevity.
- Tyson H. Brown (Duke University) focused on innovative and best practices for measuring and modeling state-level structural racism to advance aging health research.
- Jennifer Karas Montez (Syracuse University) summarized findings from recent studies that have connected the dots between changes in states’ policy contexts in recent decades and changes in population health.
This webinar was hosted by PRB and the Coordinating Center for the Centers on the Demography and Economics of Aging and Alzheimer’s Disease and Related Dementias, with funding from the National Institute on Aging.
Transcript
Mark Mather, PRB: Hi everyone, thank you for joining today’s webinar on how state contexts impact Population Health. I am Mark Mather. I’m with the Population Reference Bureau, or PRB, and I work in collaboration with the Coordinating Center for the Demography and Economics of Aging and Alzheimer’s Disease and Related Dementias at the University of Michigan. And our goal is to help publicize research on health and well-being, especially among older adults. I also want to acknowledge the National Institute on Aging for making this webinar possible, and my PRB colleague, Toshiko Kaneda, for helping us to organize this event.
I’m excited to introduce our two speakers today. We have Dr. Tyson Brown, who’s a Professor of Sociology, Associate Professor in medicine, and Associate Scientific Director of social sciences of the Duke Aging Center at Duke University and Dr. Jennifer Montez, who is a Professor of Sociology, Gerald B Kramer faculty scholar in aging studies, Director of the center for Aging and Policy Studies, and Co-director of the Policy, Place and Population Health Lab at Syracuse University.
We’re also going to put two links in the chat, I’m not going to read their long bios, but if you’re interested in learning more about the speakers and their research, we will be putting links in the chat where you can get more information. And finally, just a couple of housekeeping notes; we’re going to hold the Q&A until the end. But if you do have a question, you can type it into the Q&A box at any time during the webinar. And finally, this webinar is being recorded, we will send you a link to that recording after the event, probably within a day or two. And with that, I will go ahead and turn it over to you, Tyson.
Dr. Tyson Brown, Duke University: Well, thank you so much. I look forward to hearing your feedback during our presentation. I will go ahead and just start sharing my screen. Again, thank you so much for inviting me to present my work, and I’m really excited to talk with you all today about how we can operationalize state level structural racism and its impact on population, health and aging. And as a race scholar, gerontologist, and population health scientist, you know, the primary focus of my research is on quantifying and mapping structural racism, as well as estimating its impact on aging and health equity. And so today, I’ll be giving an overview discussing what I see as important theoretical and methodological issues, as well as promising avenues to address them, and in doing so, advance the scientific study of structural racism and health.
So, before discussing the role of states, I think it’s really useful to zoom out to highlight how various frameworks can help us better understand how social context influence health. So, the social ecological model emphasizes that population health is shaped by complex interplay of social factors across multiple levels, from individual behaviors to broader societal forces. And this model highlights how health outcomes are not solely a product of individual choices, but are influenced by interpersonal relationships, community structures, institutional policies, and broader sociopolitical contexts. And by analyzing each of these, we gain insights into how policies, societal norms, and community structures can either benefit or harm population health. And this is true for many social forces, including structural racism.
And so, most of the research on links between structural racism and health have focused on structural racism at the neighborhood or the county level, which are really important context and really sort of the micro-level, or rather the more proximate contextual sources or determinants of health. However, other special units and policies such as states have received comparatively less attention. And this is a really major limitation in literature, because U.S. states obviously are important legal, administrative and political units and states have always provided an important context for racial stratification, including the roles that they most obviously played with respect to chattal slavery, Jim Crow and anti-miscegenation laws. So importantly, states continue to have a great deal of autonomy, and they’re heterogeneous in terms of the racialized policies and practices. This is evident with respect to things like disenfranchisement laws, aggressive policing practices, punitive sentencing, as well as the expansion or contraction of safety net resources.
And so, as a result, my research focuses on conceptualizing states as racialized institutional actors that influence population health.
So, in several recent studies, my research team scopes the literature on social racism to really identify the central tenets of structural racism theories and draw upon them to study state level structural racism. We highlight how the analytical crux for measuring structural racism, which is a complex, interconnected and dynamic network, really lies in examining its features and mechanics that undergird racial inequalities.
And so, failure to align measurement tools with these core features compromises the validity of research. Because measures that are incongruent with salient aspects of structural racism can distort findings. So, to address this issue, we draw on interdisciplinary theories and evidence to really dissect core features of social racism, with a focus on their implications for measurement and modeling.
And so, our studies on and the broader literature really underscore the importance of measuring modeling core features of structural racism, including things like the fact that it’s a distributional system, involves relational power dynamics, manifestations of racial inequities, that it’s a multi-level phenomenon operating at macro and micro level contexts, that it’s multifaceted and interconnected in nature. And this plays out across societal domains, that there are specific racial actors implicated, that it’s an institutionalized phenomenon that it involves racial schemas, logics, as well as socio historical context and intersections with other systems of oppression. And so structural racism is embedded in major political, economic, medical, criminal, legal and numerous other social institutions and aspects of society. So, in these forthcoming articles that are listed here, we offer concrete recommendations for conceptualizing, measuring, and modeling structural racism in ways aligned with theory. And so, the aims of these studies is to provide field guides for rigorous, theory driven measurement approaches, proposing best practices for the scientific study of structural racism in health research.
And to provide a couple concrete examples of ways to measure structural racism, as well as its effects on health, I’ll briefly describe several recent studies in this vein. And so, the first one addresses two main research questions. The first is, does state level structural racism across societal remains reflect an underlying latent construct? And latent constructs are phenomena that are not directly observable but can be estimated through statistical approaches that really capture manifestations of the phenomena. And then secondly, the question is structural racism associated with worse health outcomes among Blacks and whites in the U.S.
So, to examine variability in state level structural racism and its relationship with health among Black and white adults, we combined indicators of structural racism from several sources of publicly available data. And then we link these to geo coded individual health and demographic data from the Health and Retirement Study, as well as CDC data on COVID mortality, as well as the Behavioral Risk Factor Surveillance study. And so, this table shows each of the domains and indicators of structural racism that we examine. We use publicly available data to examine structural racism for the year circa 2010, spanning several domains including the criminal legal system, education, economic resources, political participation, as well as residential segregation.
And so, I should mention that this measurement approach is informed by theoretical perspectives as well as previously validated measures of state level structural racism.
So, the next step is to test whether state level structural racism reflects this underlying latent construct. And so, we’re especially interested in measuring structural racism in ways that are in line with structural theories, as I mentioned. And a latent variable approach is well suited for minimizing measurement error and capturing conceptual properties of a complex system that’s difficult to quantify or directly measure, such as structural racism. And so along those lines, the nine indicators of structural racism that I mentioned were used to develop a latent measure of structural racism. And we used confirmatory factor analysis to measure the extent to which structural racism across these domains are reflective of an underlying construct of structural racism and doing so we systematically evaluated model fit using varying model specifications related to correlated errors and also dimensionality. This figure here illustrates the factor structure of the latent construct. These correlated errors are all intended to address common sources of variation that are independent of the effects of structural racism on the various indicators. And so all consider the measurement model that allows for other common sources of variance in the indicators that are largely conceptually motivated, has a good fit with the data, and it generates reasonable parameter estimates. Furthermore, this measurement approach is largely consistent with many of the theoretical tenets that I outlined above. And I should note that we made this measure publicly available from the journals website in case you’re interested in exploring. So now we’ll turn to addressing the second research question, which is how does structural racism shape health among Black and white adults? Eco social theory has become a leading framework for understanding how macro level discriminatory environments impact health, and the theory suggests that structural racism has deleterious effects on Black people’s health. That part’s pretty much straight forward. We would anticipate that from the theory. And there are competing hypotheses about how structural racism may influence the health of whites, with some suggesting that whites benefit from sexual racism, while others are positing that they’re harmed by it, and others suggesting that their health may be unaffected by structural racism. I’m glad to talk more about these competing hypotheses during in more detail during the Q&A, if you’d like.
But let’s go ahead and jump into the results. What’s going on here? I’ll explain it in just a second. But one of the things I want to mention is that, you know, since replication is a hallmark of good science, we examine the relationship between structural racism and six different health outcomes in both the Health and Retirement Study and the Behavioral Risk Factor Surveillance study. For a little bit of context, the HRS is considered one of the premier data sources for studying health among adults over the age of 50 in the U.S. is nationally representative over samples of Black adults and the birth. This is the largest health survey in the in the United States. So, you have over 300 respondents. So, you’ve got tremendous statistical power. And so, we found remarkably consistent results across health outcomes and across the two data sets. And six out of the six cases, you can see that there are that higher levels of structural racism are predictive of worse health among Black people, remarkably consistent. But we see a very different story for whites. And one instance, structural racism exposure at the state level is predictive of better health for whites and in five out of six cases, there is no statistically significant relationship between structural racism and whites’ health. So, you find, you know, shockingly consistent results and just, you know, these health outcomes are some of the most commonly used, especially when studying older adults. And so, I think that there’s this, you know, there’s a real signal that we’re picking up. And we had much more confidence in our findings because it was so consistent across these health outcomes and across these health studies. So, in a recent study, we also examined the relationship between a latent measure of structural racism and Black-white inequities in Covid 19 mortality rates. Right.
So, the regression estimates indicate that the relationship between social racism and Black, white inequality in Covid 19 mortality is positive and statistically significant, both in the bivariate model and net of covariates. And so, this again is a state level measure and collectively the findings you know, I would argue that the collectively our findings across these studies suggest that our latent variable approach has really strong predictive validity and we actually did measure it against benchmarked it against other metrics such as sort of a summative index that assumed equal weighting of the indicators and did not take into account correlations between their errors when we found that the latent measure actually explained more variation in health outcomes and also explained significantly more variation of any of the individual level indicators. And so that again, provides some evidence that there’s really there are some real benefits to taking a latent measurement approach. So, I think it’s also essential to measure and map cultural forms of racism that reflect racial schemas, logics and practices.
So broadly you know, we really need to be considering the roles of things like racialized violence, animus, resentment, hate speech, and biases, all of which have been shown to vary by place including across states. And so, in addition to well-established survey data resources, we should also be utilizing data and methods to capture utilizing, you know, more innovative data measures to capture anti-Blackness through geo coded data from things like internet search engines and computational approaches, scraping websites and even experiments. So, this map shows the spatial distribution of a latent measure that Reid DeAngelis and I are developing using these types of data and measures. And preliminary results show that it’s predictive of population health inequities. And so, we’re really encouraged about the possibility of combining these latent measures of racial schemas and logics, sort of cultural measures with the more institutional measures and looking at how the interplay between them and their relative contributions to population health inequities.
I should also mention that in a recent study published in the Journal of Health and Social Behavior, Patricia Home and Brittany King and I, we introduced a state level structural intersectionality approach to population health. And what it does is it really demonstrates an application of social intersectionality using administrative data sources similar to the ones that I discussed in the previous studies. To examine the relationship between macro level structural racism as well as structural sexism and economic inequality and looking at how they interplay between them, as well as their joint and individual contributions to health inequities across U.S. states. Right. And so, this study, I think, can really serve as a springboard and a data source for similar studies that are aiming to extend this research, in studying how state level structural, intersectional oppressions differentially shape health outcomes for various demographic groups. I should also note that numerous studies also really highlight the dynamic role that policies and politics play in shaping health inequities.
Obviously, Jennifer Montez is a new data set, is an excellent resource for studying the role of states in this regard. There are also some studies by biomedical engineer Jackie John and other colleagues that used novel, a novel database on racism related laws which has been shown to predict health. So, these and other data sources on racial policies such as three strikes laws, welfare reform, banning critical race theory and racialized disenfranchisement can really serve as important resources for research on health inequities. And, you know, the history of structural racism in the U.S. has really important implications for how we should really be approaching the measurement of it and quantifying its effects on these inequities. And there is suggest that historical racism directs, constructs and continues to mold contemporary structural racism as well as health outcomes. And so, in that vein you know, there have been several empirical studies that have shown that polities that had larger enslaved populations in 1860, have greater present-day inequities and poverty and economic mobility and also higher levels of contemporary pro-white bias, and that these can be linked to contemporary health outcomes as well, and that historical redlining practices underlie contemporary residential segregation patterns. This is becoming a well-documented social fact, as well as the fact that New Deal policies expanded the white middle class and are directly implicated in modern Black-white inequities and wealth. And so, it really shows the long arm of history in shaping contemporary health outcomes and moving forward. I think a couple of examples of measures to consider include variation and exposure to things like slavery, Jim Crow, lynchings, anti-miscegenation laws, stunned downtowns, the number of folks who are doing really good work in that space. We can think about exclusion from the economic benefits of the New Deal and GI bills, as well as racialized voter suppression.
And so, in many respects, I think what this literature is showing is that what’s past is prologue. And we’re seeing this with new laws, for example, the disproportionately disenfranchised Black and brown Americans. And in closing, I’d just like to highlight a couple, what I see as exciting opportunities for future research that I think will really advance our understanding of the links between racism and aging, health inequities, which I think can be used to inform ultimately efficacious racial equity solutions. So, for example, future studies should really better utilize longitudinal data to better understand the temporal dimensions of the relationships between structural racism and health such as the potential impacts of things like sensitive periods, durations of exposure, as well as causal effects. Right.
And moving forward, you know, I plan to use system dynamics modeling to explicitly model interdependence between forms of structural racism as well as feedback loops and lagged effects. I think that’s a really exciting area that we can start to really overlay temporal dimensions and a life force perspective with our understanding of the processes that ultimately lead to these wide health inequities that get larger and larger throughout the life course.
And also, multilevel research are really needed in this space in order to better understand the cross level structural races and linkages and the joint effects on racial stratification. So obviously, my talk here has been highlighting the role and really funny evidence of the role of states, which are really key. I hope that made that is clear, but of course, other levels also matter, right? and ultimately, you know, this is multifactorial and we should really be thinking about how structural racism across different levels, including state level influence, health.
And then, you know, as the data ecosystem is rapidly expanding, scholars are increasingly calling for a wider use of new sort of big data sources and social science research. And so, I’d just like to echo and expand upon these calls by recommending the use of these new approaches to address salient new research questions about how structural oppression shapes racial inequality.
And so harnessing digital trace data is especially useful as traditional data sources become increasingly costly, increasingly logistically complex and are becoming less representative of the target populations due to declining response rates as well as other selective forces. Also, moving forward, you know, I’d recommend testing the extent to which structural oppression affects inequality indirectly through intermediary social pathways such as unequal access to resources, things like education, income, health care, autonomy, and also exposure to risks, things like toxins, housing instability, victimization, as well as involvement in the criminal legal system and other pathogenic social conditions.
And so ultimately, this is really important. And to do this, we really need to address the and build upon really strengthen the data infrastructure on linking structural racism to health and the current data landscape for structural racism is rather confusing and scattershot.
As I alluded to at the beginning of the talk, you know, we’re willing to build a publicly available data infrastructure on structural racism to catalyze future research on its effects. And creating a data hub will reduce inefficiencies by increasing data sharing, coordination and innovation and so it’s essential that the data include contextual information at multiple spatial and temporal scales, obviously, including the state level. And I see a number of challenges and opportunities to really build a user-friendly data resource like this.
And currently, the process of linking existing data sets to contextual data can be cumbersome, but there are some wonderful opportunities and some recent examples of innovations that reduce these barriers and make it a lot easier, which Professor Montez will be discussing with us. So, I look forward to the Q&A.
Mark Mather, PRB: Great. Thanks so much, Tyson and as a reminder, if you do have a question, we have a Q&A box. So, I encourage you to type your questions into that box at any time. We’re going to take all of those questions at the end of the webinar. So, I will now turn it over to you, Jennifer.
Jennifer Karas Montez, Syracuse University: Great. Thank you. Tyson, I really appreciate your presentation. I love the historical perspective. It’s so important. And I can’t wait to read the 2025 annual review piece.
So, what I’m going to do with my time is give a high-level summary of some of the work that’s been going on using U.S. states to understand why U.S. life expectancy has not been keeping pace with other high-income countries over the last several decades. I don’t know if you can see this thing here where I’m going to try to hide it. Okay, great.
So, this work I’ve been involved in for several years now with this wonderful team. And I want to acknowledge also the funding that we received from NIA to do this work. So, I want to start off by just talking about why we’re focusing on states and state policies. If our goal is to understand what’s going on for the U.S. overall. Um, Just touch on some of the key learnings that we’ve uncovered over the last 5 or 6 years. Talk about how did we get here? Like, how did state policies end up being so important in explaining U.S. population health? And then where do we go from here? So, why are we focusing on states to understand U.S. Life expectancy. Well, this figure you’re looking at here has a line, a wiggly line for all 50 states. It shows their life expectancy trends from 1959 to 2019. And I pointed out Connecticut and Oklahoma, and I’ll do that a lot during the presentation because there are really interesting case study pretty illustrative of what’s happening. So, you can see these two states that we think of today is wildly different in so many ways, they weren’t always that different. So in1959, these two states had the exact same life expectancy. But you can see they’ve taken very different trajectories over this time period. And you’ll notice that, you know, there are some states, like Connecticut who, you know, are approaching, you know, 80, 81, 82 in terms of life expectancy. But there’s a lot of states that have kind of flatlined, if you will, since the mid-80s. And our thinking, our team’s thinking is that if we can explain why we have this divergence in life expectancy across states and why we have so many states that just really haven’t made progress in decades, then that gives us another piece to the puzzle in terms of why U.S. life expectancy is not doing what we’d like it to do.
So, I want to give you one other view of the same data, and in this view, instead of plotting all 50 states, I’m just going to plot the range in life expectancy across the states for every year. And this is what it looks like. And this data runs from 1970 to 2014. Because the study that I’m using this from examine those years. But what I want you to see here is that until 1984, states were actually becoming more alike in terms of their life expectancy. The range was shrinking. And in 1984, something happens and the range and life expectancy just keeps getting bigger and bigger and bigger. And if I were to continue this chart out through present day, you would see that range just grow year after year after year. So, you know, there are a number of explanations, a number of hypotheses for what might be happening here.
Our team has been focusing on the possibility that this divergence in life expectancy across states might be partly explained by the divergence in policies across states. So let me give you a couple of visuals of how states have diverged in their policies. So, this chart, it’s a little messy at first. It has 50 arrows. There’s an arrow here for every state. It’s not very important to figure out which state is which arrow. What these arrows indicate is how each state overall policy context has changed between 1970 and 2014. So, Jake Greenbank is a wonderful political scientist, created this overall measure of state’s policy context. And so, what I’m showing you here is where each state started on that measure in 1970. That’s the beginning of every arrow. And then where each state ended up in 2014 on that measure. And that’s the arrowhead. And so, what I want you to see is that we’ve got most states moving away from the center in terms of their overall policy context. Okay. So, they’re diverging just like states life expectancies are diverging. And again, I picked out Connecticut and Oklahoma so that you can see, you know, in the 70s, these states weren’t that different in terms of their policy context, but they sure are today. So, you might be thinking, well, give me some examples of how are these policies changed over time. So, I’m going to give you just four examples. This summary measure you’re looking at here has over 120 policies all wrapped in it. I’m just going to pull out four of those, four that we know are important for population health. So, let’s take minimum wage and earned income tax credit. Again, two policies that have pretty good evidence that these are important for population health. You can see in 1990, there’s effectively no difference between these two states. In in 1999, neither state offered an ITC. So, there’s absolutely no difference between these two states in these two very important economic policies. But by 2019, you can see these two states are wildly different in these two core economic policies. Let me give you one more example. I’m going to show you how these states have differed in terms of two very important health behavior policies. So, in 1990, these two states had almost identical taxes on a pack of cigarettes and pretty similar number of laws meant to increase the safety of firearms. But by 2019, these states, again wildly different. And it’s not just that a state like Connecticut in blue is moving in one direction in states like Oklahoma or just stuck. But you can see as states like Oklahoma are actually rolling back some of these policies that we know are good for population health. And you can see this most clearly in the firearm safety laws here, where the number of those laws has been rolled back in Oklahoma. So, let’s go back to this chart then. Now what I want to do is give you one more view of how state policy context have changed during this time period. So, what I’m going to do is I’m going to again take this overall summary measure of states policy context, and I’m going to plot the range across the states for every year in that measure. And this is what it looks like. So again, in 1970 until 1981, states were becoming more alike in terms of their overall policy contexts. I mean, it’s almost unimaginable today. But then after 1981, they become increasingly different, increasingly polarized, increasingly divergent. Whatever term you want to use in terms of their overall policy context. And so, if you were here five minutes ago, you’re thinking, I have seen a pattern similar to this before, and you have in fact. So, what I have here is now overlaying the two charts that show how the range in states policy has changed over time.
And the range and states life expectancy has changed over time. So bottom line, as states policy contexts are becoming more similar so were states. Life expectancies three years after states becoming start becoming more dissimilar in their policy environment, states start becoming more dissimilar in their life expectancy. So, at this point in our team’s journey, we thought we had developed some pretty compelling descriptive evidence that there’s a relationship here now. Is it causal? That’s what we wanted to find out. So, I’m going to walk you through some pretty high-level summaries of what we have. Think we’ve learned so far about whether that relationship is more than just a correlation.
So, we’ve found that actually U.S. life expectancy trends would have been significantly steeper if state policies hadn’t changed the way that they did. And that if we were to change all state policy, so all 50 states, if we were to change them all, to have either a very liberal or a very conservative policy context, we could alter us life expectancy by about 2 to 3 years, which is huge. That would put the U.S. about average among its peer countries, as opposed to being very securely at the bottom right now.
Changing state policies in this way would also alter the number of working age deaths each year by about 220,000, again, a very substantial number. So, in more recent work, we’ve been trying to put a more a finer understanding of where are these effects taking place for which causes of death are these effects happening and can we better understand the time lags under which these policies might have an effect? Do we see that policies have an immediate effect on working age mortality? Do we see that it takes a year or two years? How many years does it take? And so, I’m just going to summarize a piece of those findings. So, what you’re looking at here is how much the mortality rate of working age women would change if a state policy changed. And this is specifically CVD mortality among working age women. So, a lot of dots here. So let me walk you through what’s going on. So, look at the far left under the criminal justice policies. So, our analysis suggests that if we were to examine what would happen to working age women, CVD mortality during the very same year that a state’s criminal justice policies went from very conservative to very liberal. That was a lot of words. Let me say it again. So again, this is what we estimate.
What happened to working age women’s CVD mortality, If a state changed its criminal justice policies from conservative to liberal. So, we find that if we were to examine that in the very same year that that that policy was made, we would get a non-significant change in women’s CVD mortality. A year later, we start to see an effect, and within three years later, we start to see a significant reduction in women’s CVD mortality.
So, what this is saying is that if you believe these counterfactual analyses that it takes a while to see the benefits, the mortality benefits of moving from a conservative to a liberal criminal justice policy environment in the States. I’ll just walk you through a couple of other policies, gun safety policy. We find that we see almost an immediate effect in the reduction of women, CVD mortality when gun policies go from conservative to liberal.
And that effect seems to be stronger with each passing year. But there are other policies like health and welfare where we see an immediate effect, but over time that effect attenuates. So, what we take away from an analysis like this is that. The timing matters in our studies. And we don’t often do a very good job of taking timing into account. But imagine the implications. If I were to have only done this study examining no lag or a one-year lag, I would have walked away saying some policies don’t matter when they actually do or saying some do when they actually don’t matter after a given period of time.
And the other thing to take away from this is that not only do we need to pay more attention to it these lag times, but the appropriate lag time might depend on the specific policy that some policies just may take a longer time period to see a population health effect than others.
Another high level finding from our work is that the policies that have changed and polarized the most since the 80s happened to be the same policies that have the strongest associations with life expectancy and working age mortality, and those policies are mainly around labor and firearms.
And then the last finding I want to highlight, and this is not from our group, but it’s important. And I and I’m anticipating some of your questions later on, is that the growing disparities in working age mortality across states do not appear to be due to the changing socio-economic composition of a state’s populations.
So that’s, again, a very high level, a very selective set of what we’ve learned so far. So, what I want to do now is talk about how did we get here. And I want to do this because I want to make sure you, you leave this session realizing that the changes in these state’s policies, these are not exogenous changes, right? There are forces behind the scenes turning the knobs. So, if we want to move our analysis, you know, up the causal chain we need to be looking at who’s changing the knobs and why are they changing them. So, I’m going to point out, maybe my thing. It’s not moving. Okay.
So, I’m going to point out four interlocking forces. And I’ve got several citations down here. Really great in-depth books that you can read on this by sociologists, political scientists and others, a historian. And if you want just the quick and dirty that the very last article in the Milbank Quarterly covers these, these four issues.
So how did we get here? Four things really come together. One is the devolution of federal authority to the states, where states have gained increasing policymaking authority, especially since the Reagan administration. The other thing that has been happening that has given states this increasing power is there has been a proliferation of states enacting preemption laws to take away local authority, to do any number of things from raise the minimum wage, to mandate paid leave, to banning fracking. And so not only have states been given this additional authority by the federal government, they’ve been taking away authority from the states at the same time. Now, those two trends are not in and of themselves problematic but as a result of that, states have made very different decisions about their policies’ environments.
Some of those decisions have been unduly influenced by corporations, their interest groups and wealthy donors and some of the influences coming from the nationalization of political parties. And what I mean by that is, you know, we used to have a Republican version of Oklahoma and a different Republican version of Texas. But now there’s increasingly a Republican version across the U.S., just like there is an increasing Democrat version of policy context across the U.S. And I’m just highlighting this very quickly and again, I’ve given you some citations if you’re interested in digging into that further.
So, I want to conclude with talking about where do we go from here? And some of these recommendations are going to echo what Tyson presented earlier. I think my mouse is acting up here and I’m just pulling these ten ideas from editorial in the Milbank Quarterly this year on ten ways to better understand how shifting state policy contexts affect Americans health.
I’m not going to go through all ten, but I’m going to talk about some that keep me up at night. One of the things that we have got to do a better job with is giving more attention to policy bundles or indices. There is a very strong correlation across policies within any given state. If you were to tell me a state’s minimum wage, I can tell you almost everything else about that state. I can tell you can give you a good idea of what its tobacco taxes are, or whether it has an earned income tax credit, whether they’re right to work laws. Policies are becoming increasingly bundled. And so, the tendency in a lot of our work is to create summary indices or other kinds of indices, which I think is the right direction to go. But at the same time, I think we need some general guidance on how to use these indices responsibly. And there was a really great commentary by Harper and Andy last year around their concerns of using these kinds of indices. I don’t want to persuade anyone not to use indices, particularly because there is no single policy that can explain the difference between states. We wouldn’t choose a single policy to try to describe why U.S. life expectancy is different than that in Sweden, for example, because they’re just two completely different policy context and the same is true across states.
The other thing that I want to draw attention to, and this is going to echo what Tyson said, is that going forward, we need to pay more attention to lag times. We need to understand how these state level exposures accumulate across the life course. You know, by the time people are, you know, in the 30s, 40s and 50s, they have likely experience multiple different state policy context. They might have moved and so they experienced different context, or they might have stayed in their own state of residence. But, you know, as you saw earlier, states policy contexts are very dynamic and they’re changing.
So how do we capture this cumulative exposure to different contexts over people’s life course? And at the same time, how do we understand how the health effects of those exposures also evolve over time? So, I think, you know, version 2.0 of this work is has got to get just into this messy detail about how these dynamics, how to capture the dynamic interplay across the life course. And then the last point I want to draw on here is that I think, you know, as a group of researchers interested in this topic.
We need to develop an easy to implement method for accounting for inter-state migration. It is the question that comes up any time that those of us who are doing this work present it, and there’s no agreed upon way to account for it, it’s very, very difficult to account for it. In most surveys. You just don’t have the information. But can we not come up with some sort of agreed upon way, you know, baseline way to take this into account so that we can better isolate the effects of state policies on people’s health.
That is all I have. I’m going to stop here and say thank you so much. And I look forward to your questions.
Mark Mather, PRB: Thank you so much, Jennifer. We are now going to move to the Q&A. And so, as I mentioned before, if you have a question, we have a Q&A box. You’re welcome to put your questions into the box at the bottom of the screen.
And I will start with you, Dr. Tyson. There’s a question that came in through the chat asking if you could say a bit more about why different types of structural injustice vary in their geographic distribution. This person would have expected them to align more than they do.
Dr. Tyson Brown, Duke University: Yeah, that’s a great question. So, I’ll start by just noting that, you know, in my research, I argue that because racism is dynamic, flexible and really adaptive to socio historical context, that there are likely distinct contemporary racialized regimes, and that these regimes are characterized by different manifestations and modalities of racism across place. And so, whereas contemporary discrimination, discriminatory, legal and cultural forms of racism are especially pronounced in states in Southern and Appalachian regions. Findings from my research really illustrates how contemporary structural racism that’s manifest in discriminatory institutional contexts and racial inequities, that this is particularly severe in states and Midwestern and Northeastern regions.
And so, although the historical and modern roots of place-based differences in social races have not fully understood, you know, scholars have posited that that really the extreme degrees of contemporary structural racism reflected by racial inequality and institutional contexts in many northern states, them in part from institutionalized policies and practices of social control, racialized social control through exclusion and subordination. So, you can think about examples of resource hoarding, of redlining, of racial covenants and discriminatory policing and that these white supremacist tactics were increasingly deployed after the Great Migration because northern whites perceived the increasing Black population as a threat. Right, and so, given the fluid, shapeshifting nature of structural racism, it’s really important that future research investigate the etiology and consequences of these distinct contemporary racialized regimes across time and place. But that’s a really astute observation and frankly, we don’t know and so this is a really exciting time to be doing this research and I think it’s a really important time as well.
Mark Mather, PRB: For you, Jennifer, there’s a question in the chat, to what extent do changes in interstate migration due to increasing political polarization?
I think they’re talking about people moving because of the policy context. Perhaps, would that lead to a select group of unhealthier people in more conservative states and conversely, healthier people in in liberal states? Thinking about the change in interstate migration over time.
Jennifer Karas Montez, Syracuse University: That is a great question. So, I will say that in the ways that we have tried to account for interstate migration and also the study that I mentioned in the talk, we’ve not found that it is a major contributor. So that being said, I am not sure that that will those kind of null findings will hold up post 2020 due to both increasing polarization and people potentially moving to places that are more aligned with their political values, and the fact that, you know, we’re seeing a lot of people moving to red states, to Texas, to Florida, I mean, even Oklahoma. So, I don’t know, you know, on the whole how that’s all going to play out. But my working hypothesis at this time is that what we know about who moves and who doesn’t move might be different pre versus post 2020.
Mark Mather, PRB: Thank you. This question is I guess mainly for you, Tyson. But Jennifer, you’re welcome to respond in your future directions. You mentioned digital trace data, Tyson, could you expand a little bit more on what that type of data looks like, why it may be a future direction?
Dr. Tyson Brown, Duke University: I’d be glad to. So just a level set. Digital trace data includes things like social media activity, web browsing histories, search engine queries, e-commerce transactions, text messages, emails all where we live our lives today, right? And digitally and so there’s a lot of data out there and in my work, I argue that harnessing the data revolution, which is the rapid, you know, growth in data generation and storage analysis that’s driven by technological advances big data and digitization and transforming how information is used in decision making you know in research and everyday life. Right.
So, I think this is a really important and, and it’s especially critical, to use digital trace data to really capture what we termed as backstage cultural dimensions of racism. Right. And so, you don’t have to rely upon what people responses that they give in surveys because there’s social desirability. There’s a number of reasons that we may be getting not we may not be getting the full picture from survey data, which is still really important and even administrative, that can be really important. But there’s something unique about how we live our lives online that you know, they’re basically receipts. You know your digital life doesn’t lie, right? and we have a lot of digital traces, and so I see it as really, a really valuable way to complement more traditional data sources that many of us as demographers have used.
Mark Mather, PRB: In place and again, for you at this person, notice that there’s not a lot of overlap in the map to measures of structural racism with high values in the Midwest and West, and cultural racism with high values in the southeast and on the state level similar, I guess, to the other question, but how do you envision these measures potentially capturing different pathways for racism to impact population health?
Dr. Tyson Brown, Duke University: Yeah. Well, I guess see my previous response. You know, again, getting back to these contemporary racializing regimes, I would refer to the person who asked the question to the recent study. So, there’s a 2024 article in the Journal of Health and Social Paper. Between this author by myself and Patricia Home and also a couple forthcoming in your articles and your view of sociology and review of public health will be really digging deep with some of these issues and so I think this is really important. You know, the latter part of the question was, you know, what do I see as there, you know, sort of unique or joint pathways in shaping health. Right? So, whether you have sort of the institutional manifestations and you’ve got the more ideological, cultural dimensions and that is an empirical question that we really don’t know, but many of us are working on that. And so, you know, I hope that in a year we’ll have better answer and especially five years from now. But I think that really is one of the frontiers for understanding population health in general and more broadly, and then more specifically thinking about racial inequities in health including at the state level.
Mark Mather, PRB: Your question for either or both of you, is there an agreed upon way to incorporate different races living under alternative government structure like Native Americans or tribal lands, into measures of structural racism and population health when they might not be present in our standard data resources.
Dr. Tyson Brown, Duke University: I didn’t fully understand the question, but I will just note that I think it began by is there an agreement? and I would say no. You know, these are debate, you know, like any fields of science, there are contested debates. There are new revelations, there’s discoveries, we’re always innovating and I think that we’re always learning more about these sorts of racialized practices and processes and certainly I would note that, you know, really there is no one size fits all and that there are real limitations to all the ways in which we measure these things and how folks are coded, whether it’s self-reported, whether it’s by the interviewer, whether it’s, you know, there are other ways of getting at sort of trying to triangulate to figure out someone’s racial identity or status. But, none of them are perfect. And so, this is part of the job of trying to advance the field and do so in responsible manner. So, I appreciate the question.
Mark Mather, PRB: Do you want to say anything to that, Jennifer?
Jennifer Karas Montez, Syracuse University: Sure. I’ll just add that, I mean what the question reminds me of is just, you know, the need to examine heterogeneity more carefully and, you know, the need to go below the state level to understand some of these processes. You know, there the states are just super interesting unit of analysis. I mean, you know, we call them institutional actors. And, you know, I mean, Tyson made a great pitch for why states are important, but they’re not the only thing that matters. And so, I think to get at the kinds of detailed analyses that that question would require going below the state level.
I would also say that what it seems like is that, you know, states and probably also local environments too, seem to matter most for the health of people who are marginalized. We have this term colleges of firewall, right? So that if you have a college degree or higher, it almost doesn’t matter where you live, you’re going to have good health. But with each, you know, lower level of education, that the place that you live matters more and more for shaping your health. And so, but again I mean that those kinds of analyses are going to benefit from going below the state level.
Mark Mather, PRB: Great. And I just had one question for you, Tyson. You had mentioned things like hate speech and racial animus. And I am curious about how do we measure those types of structures, partly because they might be reported differently in different local jurisdictions or not reported at all in certain places. So, I’m wondering, is that where the social media comes in to capture some of those things, or is it a combination of social media and some of the criminal justice data?
Dr. Tyson Brown, Duke University: Yeah. Great question. I think that it’s like you mentioned, you know, I think it is really important to triangulate and use a variety of data sources. They all have their strengths and limitations and certainly reporting on official Bureau of Justice statistics on hate crimes as well. It’s got its limitations, to say the least. And there’s certainly variation across place about how and when they report if they report and so that data you know, it’s got major limitations but I think that we can get at things by looking at the proportion of hate groups and indexing it to the population size. Right?
So, I think that’s really revealing, you know, when we map that data, I think that, as you mentioned also that using things like social media data really can get at some of these sorts of things by whether it’s Google searches or people’s activity on other social media platforms and there’s also experiments that folks have done, including things like the AIT that get at sort of underlying logics and subconscious biases as well as survey data. I think that, you know, there survey data on racial resentment. If you map it, it’s in a rather predictable way, it varies across states in a predictable way and it’s highly correlated with other measures of racial essentialism and norms and things along those lines. So, I think that all of the above, frankly, you know, they all have their relative advantages and disadvantages.
Mark Mather, PRB: Well, we are at time, so I think we need to close here. But Tyson and Jennifer, thank you so much for joining this discussion. It’s an important and timely topic and for those who stuck around, thanks for joining. As I mentioned, this is being recorded. We will send you a link to that recording in the next few days. So, thanks everyone.