Linda A. Jacobsen
Senior Fellow

December 6, 2011
Senior Fellow
Associate Vice President, U.S. Programs
This Population Bulletin Update is a follow-up to PRB’s 2010 Population Bulletin, “U.S. Economic and Social Trends Since 2000,” and provides new data and analysis on the ongoing impact of the Great Recession on unemployment, poverty, housing, education, the status of young adults, and the birth rate in the United States.
(December 2011) The Great Recession in the United States began in December 2007 and officially ended in June of 2009, resulting in a broad-based decline in America’s economic well-being and security.1 The job and housing markets have still not recovered, and the number of people in poverty increased more between 2009 and 2010 than in the year following any other recession since 1962.2 This update focuses on the period since 2008 to assess the ongoing impact of the recession in the United States.
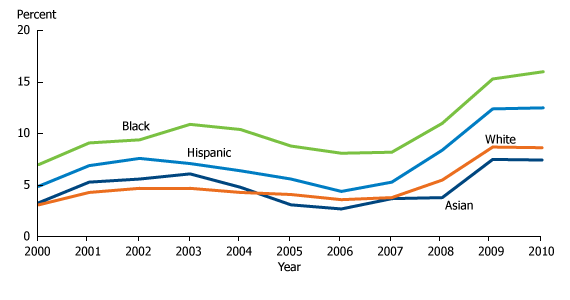
Between November 2009 and November 2011, the seasonally adjusted unemployment rate in the United States dropped from 9.9 percent to 8.6 percent. Rates remain high among all major racial and ethnic groups, although they have declined from the peak levels of 2009 (see Figure 1).
Figure 1
U.S. Unemployment Rates by Race/Ethnicity, 2000-2011
Note: Unadjusted rates as of October of each year. Estimates are based on a survey of the population and are subject to both sampling and nonsampling error.
Source: U.S. Bureau of Labor Statistics.
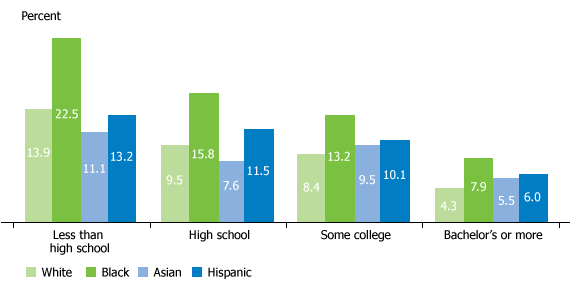
Yet, sizeable gaps remain between the unemployment levels for blacks and Hispanics and those for whites and Asian Americans. At 14 percent, the unemployment rate for blacks in 2011 is almost double the rate for whites. Differences in educational attainment can partially explain racial and ethnic disparities in unemployment rates (see Figure 2).
Figure 2
U.S. Unemployment Rates by Race/Ethnicity and Education, 2010
Note: Annual averages. Estimates are based on a survey of the population and are subject to both sampling and nonsampling error.
Source: U.S. Bureau of Labor Statistics.
Unemployment rates decline among all racial and ethnic groups as education levels increase. However, blacks have higher unemployment rates at all education levels than other groups, even among those with a bachelor’s degree or higher. The unemployment rate is especially high among blacks without a high school diploma—23 percent. Although the recession has affected workers of all ages, the unemployment rate is highest among 16-to-24-year-olds—16 percent, compared with 7 percent for those ages 35 and older (see “More Young Adults in U.S. Postponing Marriage, Living at Home, Disconnected From Work and School” for more on the impact of the recession on young adults).
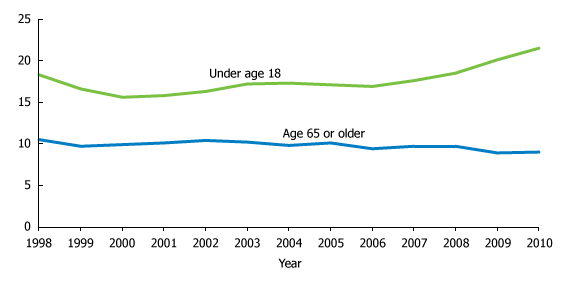
The poverty rate is the most widely used indicator of family economic security and determines eligibility for programs to assist needy families. In 2010, a family with two adults and two children was considered poor if its income fell below $22,113. Official poverty estimates released in September 2011 by the Census Bureau show that in 2010, the total poverty rate rose to 15.1 percent, up from 13.2 percent in 2008.3 The United States has not seen poverty this high since 1993. While poverty rates among the population ages 65 and older declined between 2008 and 2010, poverty rates among children continued to rise from 19 percent to 22 percent—a level more than double that of the elderly (see Figure 3).
Figure 3
U.S. Poverty Rates Among Children and the Elderly, 1998-2010
Note: Estimates are based on a survey of the population and are subject to both sampling and nonsampling error.
Source: U.S. Census Bureau, Current Population Survey, 1999-2011.
This poverty gap between children and the elderly is not new—it began in 1974—but the gap has been widening since the onset of the recession. While 12 percent of non-Hispanic white children were poor in 2010, almost 40 percent of black children and 36 percent of Latino children were living in poverty. The recent census showed that non-Hispanic whites made up only 54 percent of the child population in 2010, while Hispanics accounted for almost one-quarter.4 Since 2000, growth rates for minority children have far outstripped those for non-Hispanic whites, and these differences are projected to continue. Poverty in early childhood often carries over into adulthood and negatively affects health and earnings later in life.5 If high child poverty rates and racial/ethnic differentials persist, then the United States may face significant economic costs down the road when these children reach adulthood. Children under age 5 today will become young adults just as the last of the large baby-boom cohorts reach retirement age. Poorer health and lower productivity and earnings may prevent these young adults from contributing as much to Social Security as the country will need to support retiring baby boomers.
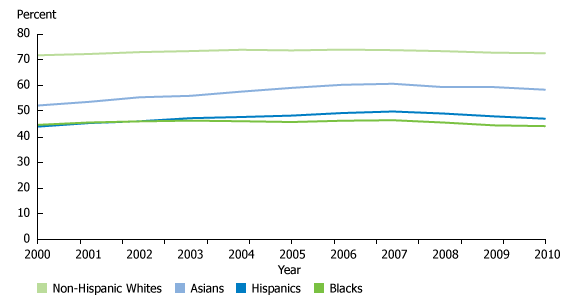
Levels of homeownership in the United States continued to decline—from 67 percent in 2008 to 65 percent in 2010. These declines occurred in all racial and ethnic groups as high rates of foreclosure persisted and job losses and income declines prevented new buyers from entering the market (see Figure 4).
Figure 4
Percent of U.S. Housing Units That Are Owner-Occupied, by Race/Ethnicity
of Householder, 2000-2010
Note: Estimates are based on a survey of the population and are subject to both sampling and nonsampling error.
Source: U.S. Census Bureau, 2000 Decennial Census and American Community Survey 2001-2010.
Blacks and Latinos—who have been disproportionately affected by foreclosures—experienced larger decreases in homeownership than non-Hispanic whites. During the previous two decades, racial gaps in homeownership narrowed, due in part to the increasing number of mortgage loans made to low-income minority households. However, the differential impact of the recession on blacks and Latinos has caused these gaps to widen again between 2008 and 2010. In 2010, about 73 percent of non-Hispanic whites were homeowners, compared with 47 percent of Latinos and only 44 percent of blacks.
Homeownership has traditionally been a major source of wealth accumulation in the United States. But since the burst of the housing bubble and onset of the recession, owning a home has become a liability for many Americans. As property values have plummeted, many homeowners find their mortgages “under water”—they owe more on their mortgage than their house is worth. Between 2008 and 2010, Americans continued to see their wealth decline as median home value dropped from $197,500 to $179,900. Although median home values decreased for all groups, they fell most among Hispanics—a decline of 21 percent between 2008 and 2010 (see Figure 5).
Figure 5
U.S. Median Home Value by Race/Ethnicity of Homeowner, 2000, 2008, and 2010
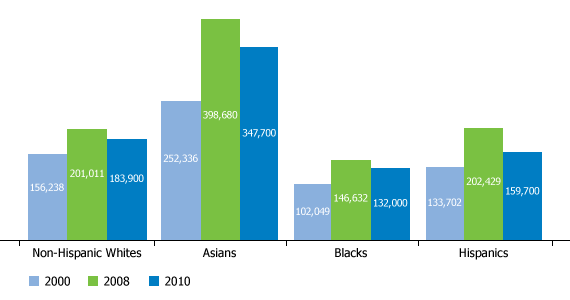
Note: Inflation-adjusted median home value in 2010 dollars. Estimates are based on a survey of the population and are subject to both sampling and nonsampling error. Limited to owner-occupied units and, in 2000, to specified owner-occupied units.
Source: U.S. Census Bureau, 2000 Decennial Census and American Community Survey 2008 and 2010.
Of course, declines in home values continued to vary across the United States. Twenty-one states experienced a significant decline in median home value between 2009 and 2010; Nevada led the pack with a decrease of 17 percent, followed by Arizona with a drop of 12 percent and Florida with an 11 percent decline. However, seven states saw their median home value rise in 2010: Alabama, Alaska, Arkansas, Kentucky, Nebraska, North Dakota, and Oklahoma.6
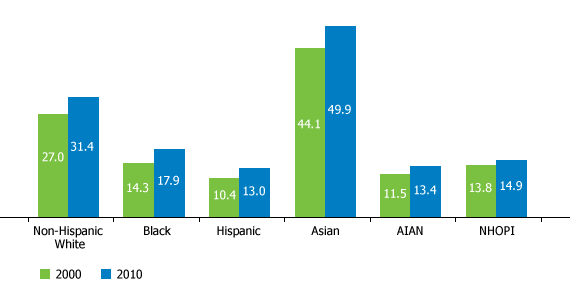
Higher levels of education have helped to minimize job losses for some Americans during the recession, and the share with a college degree increased between 2000 and 2010 among all groups (see Figure 6).
Figure 6
Percent of U.S. Adults Ages 25 and Older Who Have Completed a Bachelor’s Degree or Higher, by Race/Ethnicity, 2000 and 2010
Note: Estimates are based on a survey of the population and are subject to both sampling and nonsampling error.
Source: U.S. Census Bureau, 2000 Decennial Census and 2010 American Community Survey.
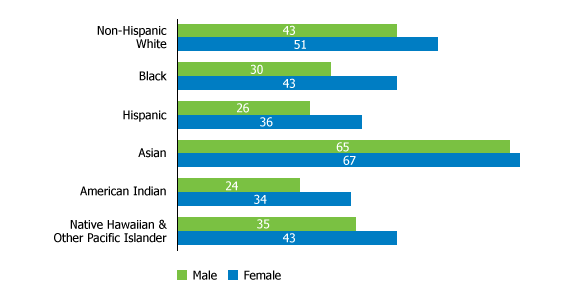
However, racial and ethnic gaps in educational attainment persisted in 2010, with only 13 percent of Latinos and 18 percent of blacks completing college, compared with 31 percent of non-Hispanic whites and 50 percent of Asian Americans. Despite rising tuition costs and an increasing debt load, college enrollment rates among 18-to-24-year-olds held steady or increased slightly between 2008 and 2010. Although enrollment rates among Latinos and blacks have increased since 2008, they still lag behind those of Asian Americans and non-Hispanic whites (see Figure 7).
Figure 7
Percent of Persons Ages 18 to 24 Enrolled in College or Graduate School in the U.S., by Race/Ethnicity, 2010
Note: Estimates are based on a survey of the population and are subject to both sampling and nonsampling error.
Source: U.S. Census Bureau, 2010 American Community Survey.
If these education differences persist as minorities become a larger share of the adult population, then fewer may be insulated from job losses in future economic downturns.
Despite officially ending in 2009, the recession in the United States is still affecting the economic well-being and security of many Americans. Real median household income continued to decline between 2009 and 2010, as did homeownership and home values. Although unemployment rates have begun to fall, the pace of job growth is slower than in previous recoveries, and poverty rates continue to rise. Racial and ethnic disparities in the impact of the recession persist, with blacks and Latinos being hardest hit. If these lingering effects of the recession continue, then the United States may suffer long-term negative consequences.
Next page:
More Young Adults in U.S. Postponing Marriage, Living at Home, Disconnected From Work and School
Linda A. Jacobsen is vice president of Domestic Programs at the Population Reference Bureau. Mark Mather is associate vice president of Domestic Programs at PRB.
