Appalachia’s Digital Gap in Rural Areas Leaves Some Communities Behind

As Schools Close in Response to the Coronavirus, Children in Rural Appalachia May Have Less Access to Tools for Remote Learning.
Data suggest that Appalachia faces a digital divide—not just between the Region’s households and the rest of the nation but also between the Region’s rural and more urban areas, say the authors of a Population Reference Bureau (PRB) report for the Appalachian Regional Commission.
“Now that computer devices are commonly used for school work, entertainment, online banking, health care access, and connecting with friends and family, our report suggests that many Appalachian residents are at a disadvantage,” says Kelvin Pollard, PRB senior demographer and co-author of The Appalachian Region: A Data Overview From the 2013-2017 American Community Survey.
The report, co-authored with Linda A. Jacobsen, PRB vice president for U.S. Programs, examines trends and population characteristics at the regional, subregional, state, and county levels using American Community Survey data and the Census Bureau’s population estimates.
The share of Appalachian households with a computer device (desktop, laptop, smartphone, tablet, or other device) in 2013-2017 was five percentage points below the national average (82 percent compared with 87 percent), the report shows. Device ownership in many of the Region’s urban counties was near or above the national average, but levels in many rural counties were far lower. In 127 of Appalachia’s 420 counties less than 75 percent of households had a computer device, with the vast majority concentrated outside metropolitan areas and a sizeable share in Central Appalachia (eastern Kentucky, plus adjacent counties in West Virginia, Virginia, and Tennessee).
The Appalachian Region encompasses 205,000 square miles along the Appalachian Mountains from southern New York to northern Mississippi, including portions of 12 states and all of West Virginia. The Region includes Pittsburgh, Birmingham, and parts of metropolitan Atlanta and Cincinnati.
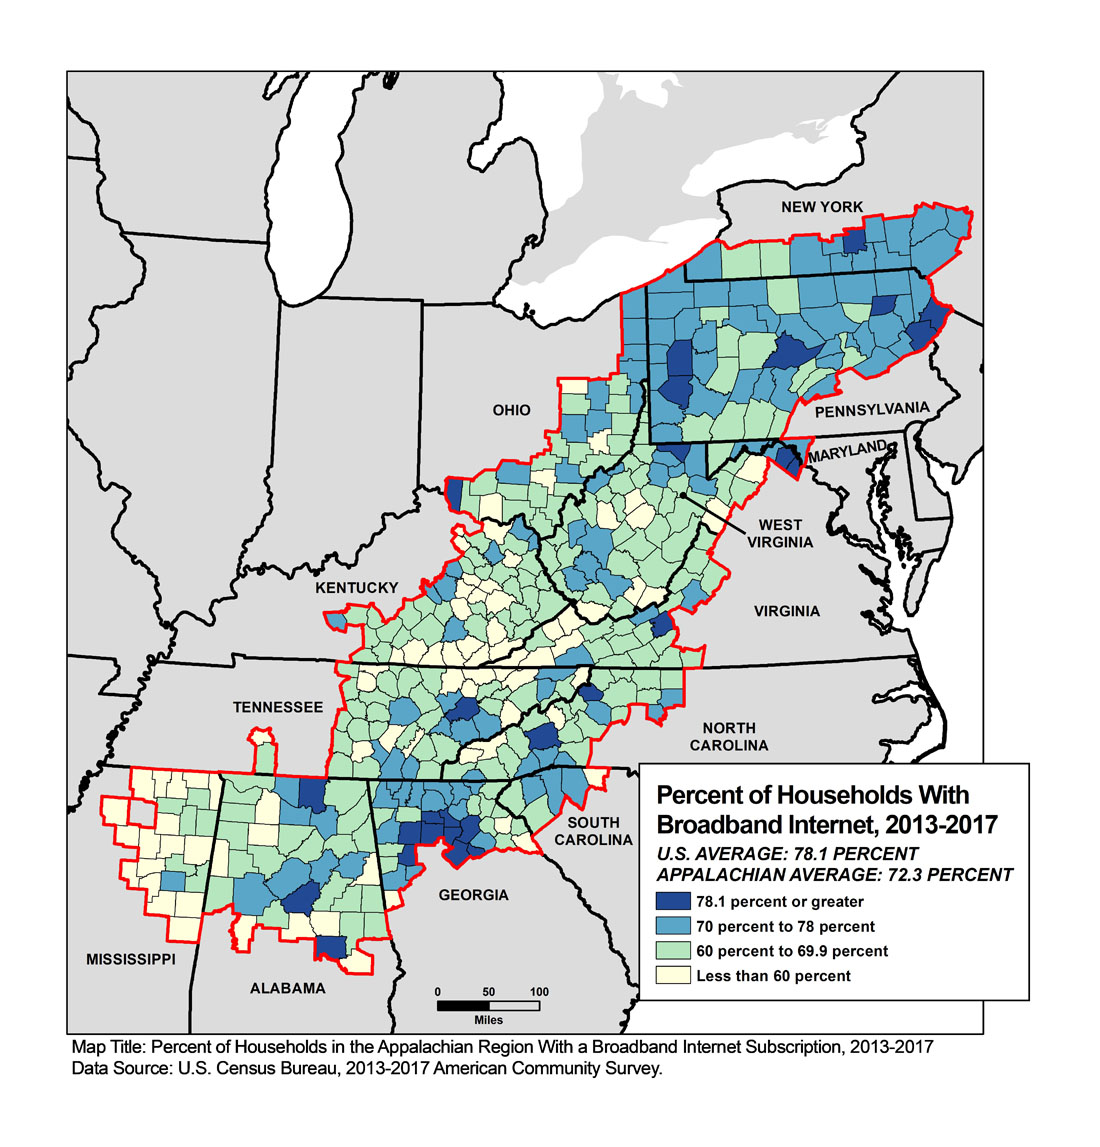
During the 2013-2017 period, 72 percent of Appalachian households had a broadband internet subscription, roughly six percentage points below the national average. But in 80 of the Region’s counties, the share was less than 60 percent (see Figure).
“Given that high-speed internet access is credited with enhancing economic growth and development, these are signs that many communities in the Region may be at risk of being left behind,” Pollard warns.
The Share of Households With Broadband Internet Subscriptions Was Below the National Average in Most Appalachian Counties in 2013-2017
Higher Education Levels Linked to More Employment, Higher Incomes
The report shows that while working-age adults in Appalachia are nearly as likely to have completed high school as Americans in general, they are significantly less likely to have completed at least four years of college. Just over 25 percent of Appalachia’s working-age population had a four-year degree or more in 2013-2017—seven percentage points lower than the U.S. average of 32 percent. And the rate was less than 20 percent in both Central Appalachia and the Region’s most rural counties.
Nearly three-fourths (73 percent) of Appalachia’s prime working-age adults were in the labor force in 2013-2017, which is almost five percentage points lower than in the United States as a whole. But this share was much lower in 53 counties (38 of which were in Central Appalachia) where less than 60 percent of adults ages 25 to 64 were in the labor force.
“Not surprisingly, those counties with lower labor force participation rates also had lower levels of educational attainment,” Jacobsen says.
Although labor force participation rates were slightly lower in the Region, the unemployment rate matched the national average of 5.4 percent. Yet 17 counties—down from 37 in 2012-2016—had unemployment rates of 10 percent or higher. All of these counties were outside metropolitan areas, and roughly half were in Central Appalachia where the unemployment rate was 7.3 percent. “These unemployment levels also appear to be connected to educational attainment,” suggests Jacobsen.
The report identified some good news: Median household income (adjusted for inflation) increased 2.5 percent in Appalachia between 2008-2012 and 2013-2017, more than the national increase of only 1.6 percent. In fact, median household income rose faster than the national average in more than half of the Region’s counties, and it increased by 5 percent or more in 140 counties scattered throughout the Region. However, there were still 154 Appalachian counties where median household income fell between 2008-2012 and 2013-2017. And even with the increase, median income in Appalachia was still nearly $10,000 lower than the national median of $57,652. Moreover, the share of Appalachian residents living below the poverty level ($24,858 for a family of two adults and two children) exceeded the national average for every age group except those ages 65 and older.
“These uneven patterns suggest that the pace of economic recovery since the Great Recession has varied across the Region, but the counties that saw increases in median household income are also those with higher levels of education and labor force participation, and lower levels of unemployment,” Jacobsen reports.
Other Key Findings
- The Region’s overall population growth was just over 1.4 percent between 2010 and 2017, roughly one-fourth the national average of 5.3 percent. Two out of three Appalachian counties experienced a net loss of population during this period.
- People ages 65 and older make up nearly 18 percent of Appalachia’s population—about two percentage points above the national average. But older people represent one in five residents in 184 of Appalachia’s 420 counties.
- A bright spot in Appalachia is the fact that residents of the Region are less likely to be without health insurance at almost all ages than those in the nation as a whole. The only exception is among young adults ages 26 to 34, where the share without insurance is higher in Appalachia, potentially reflecting this age group’s lower rates of employment and low levels of income.
- Among all age groups, the share of Appalachian residents who reported a disability (difficulty with hearing, vision, cognition, walking or climbing, self-care, or independent living) in 2013-2017 was above the national average. The gap was largest—over four percentage points—for middle-aged adults ages 35 to 64 (17.3 percent in Appalachia versus 12.9 percent nationwide). Disability levels were highest for all age groups in Central Appalachia, where nearly half of adults ages 65 and over reported a disability in 2013-2017, compared with only 36 percent nationally.
- Although the share of Appalachian households with no vehicle available was slightly below the national average, the share in 54 counties, primarily located in New York, Pennsylvania, West Virginia, and Kentucky, reached 10 percent or more.
- Nearly one-third of Appalachian workers ages 16 and older commuted to jobs outside their county of residence, four percentage points above the national average. This share was even higher across much of the Region—at least half in 125 of Appalachia’s 420 counties.
The full Appalachian Regional Commission report includes detailed tables and county-level maps covering state- and county-level data on population, age, race and ethnicity, housing occupancy and tenure, housing type, education, computer ownership and internet access, labor force, employment and unemployment, transportation and commuting, income and poverty, health insurance coverage, disability status, migration patterns, and veteran status.
Related Posts
Webinar: Bridging Research and Policies: Enhancing Budgeting Processes for Africa's Demographic Dividend
PRB hosted a high-level webinar with budget experts, parliamentarians, and national directors to discuss the importance of the Demographic Dividend Sensitive Budgeting approach in enhancing budgeting processes across Africa.

Webinar: Where Is the Workforce? Understanding the U.S. Labor Shortage and Working Toward Solutions
PRB, the Critical Labor Coalition, and special guest former U.S.

American Community Survey Resources, Shortcuts, and Tools Workshop
Expert data users from PRB, the U.S.

Research Identifies New Strategies to Reduce Undercount of Young Children in U.S. 2020 Census
PRB identifies factors predicting where children under age 5 are more likely to be missed in the 2020 Census and develops a new undercount risk measure for young children.