Mark Mather
Associate Vice President, U.S. Programs

The U.S. population is undergoing rapid racial and ethnic change, led by growth of the Hispanic/Latino and Asian American populations. For policymakers and others, keeping track of these changes is important because some racial and ethnic groups are faring worse than others. In particular, African Americans, Latinos, and American Indians are lagging behind whites and Asian Americans across a broad range of social, economic, housing, and health measures.
Reducing these disparities among groups requires access to accurate and consistent data on the racial and ethnic composition of the U.S. population and how it has changed over time. The decennial census is America’s best and only source of detailed and consistent racial/ethnic data for small population subgroups and geographic areas.
As in 2010, respondents to the 2020 Census questionnaire will find two separate questions, one on race and one on Hispanic ethnicity. For race, they will be able to choose from among 14 racial categories, are allowed to mark more than one, and can write in specific races not listed. New for 2020 is space to write in an additional detailed racial category or origin (such as Irish, Haitian, or Pakistani). For Hispanic ethnicity, respondents will be asked to indicate whether they are or are not of Hispanic origin. The form will emphasize that Hispanics may identify with any race, reflecting government-wide definitions established by the Office of Management and Budget.
Data from the 2020 Census will show a nation that has become more racially and ethnically diverse. Many news stories have focused on the growth of the Hispanic/Latino population, which surpassed 50 million in 2010 and is projected to increase to 62.3 million by 2020 (see Table). The Latino population is projected to experience the largest numeric gain during this decade (11.8 million). However, the population identifying with two or more races is projected to be the fastest-growing racial/ethnic group between 2010 and 2020, with a 36 percent increase. The Asian American population is projected to increase by 32 percent, followed by the Latino population (23 percent). The non-Hispanic white population is projected to increase by just 1 percent, with a net gain of 1.3 million people.
The latest Census Bureau projections indicate that non-Hispanic whites will no longer account for the majority of the U.S. population by 2045.1 However, with the rapid growth of people who identify themselves as multiracial and multiethnic, the dividing lines among groups are becoming less distinct. If we include multiracial people who identify as white and at least one other race—then whites would not drop below 50 percent of the population until 2056. By 2060, about 6 percent of the total population—and 11 percent of children under age 18—are projected to be multiracial.
| wdt_ID | Ethnicity | Population (thousands) April 1, 2010 | Population (thousands) July 1, 2020 (projected) | Percent Change |
|---|---|---|---|---|
| 1 | Total | 308,746 | 332,639 | 8 |
| 2 | White | 197,319 | 198,571 | 1 |
| 3 | Black or African American | 37,923 | 41,702 | 10 |
| 4 | Asian | 14,662 | 19,393 | 32 |
| 5 | Two or more races | 5,604 | 7,616 | 36 |
| 6 | American Indian and Alaska Native | 2,263 | 2,445 | 8 |
| 7 | Native Hawaiian and Other Pacific Islander | 497 | 599 | 20 |
| 8 | Hispanic or Latino | 50,478 | 62,313 | 23 |
Historically, immigration has been a driving force behind racial/ethnic change in the United States because immigrants often have different racial and ethnic characteristics than the U.S.-born population. Since 1965, U.S. immigration laws have been based on a skill- and family-based system, which has attracted a mix of immigrants, primarily from Latin America and Asia.
Increasingly, however, growing racial/ethnic diversity in the United States is driven by natural increase—the number of births relative to deaths in a population. Natural increase is projected to contribute to a net gain of about 13.8 million people between 2010 and 2020, most of it among the Hispanic, African American, and multiracial populations. For these populations, natural increase is a major driver of population growth, but it is negative for the non-Hispanic white population (see Figure 1). In fact, the white population is the only major racial/ethnic group projected to experience natural (more deaths than births) during the decade.
Projected Racial/Ethnic Distribution of U.S. Population Change (thousands), 2010 to 2020
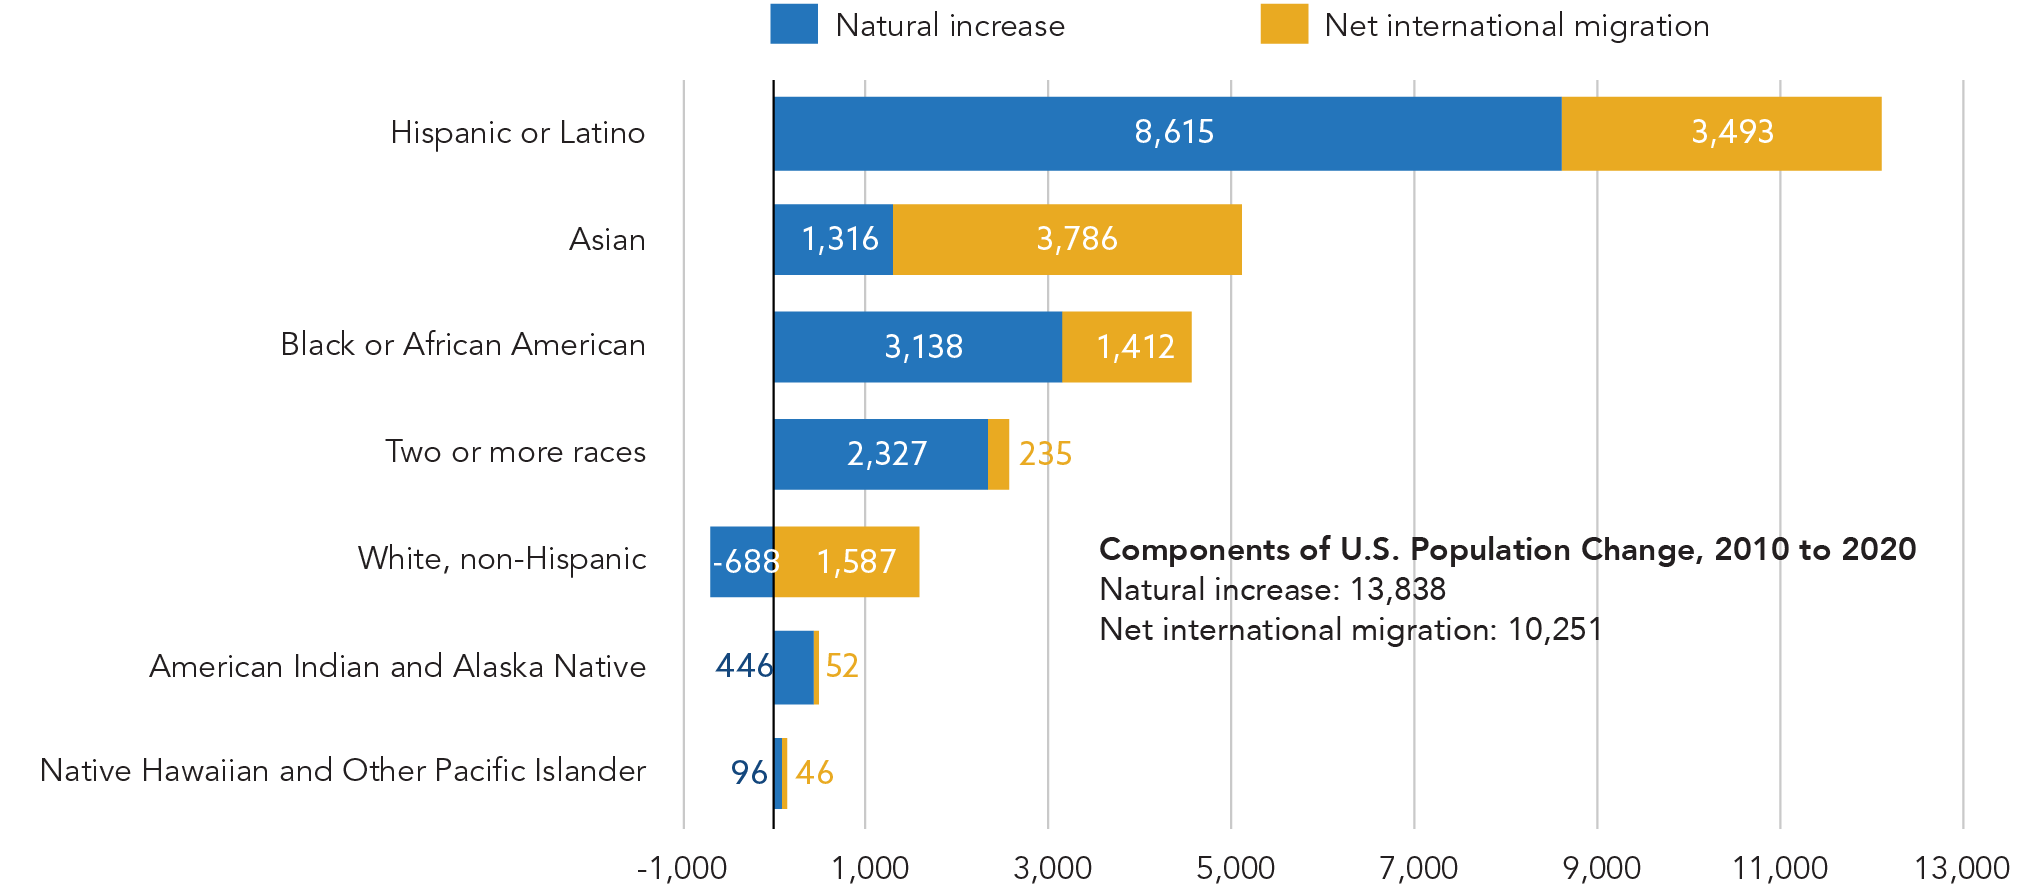
Note: Hispanics/Latinos may be of any race. Natural increase is the number of births minus the number of deaths. Net international migration is the number of immigrants minus the number of emigrants.
Source: PRB analysis of U.S. Census Bureau population estimates and projections.
The Census Bureau projects that 71 percent of Hispanic/Latino population growth from 2010 to 2020 will result from natural increase. In contrast, during this same time period, most population growth among Asian Americans and non-Hispanic whites will be driven by net international migration.
The rapid growth of the Hispanic/Latino population can be attributed to two main factors. First, relatively high levels of immigration from Latin America—primarily from Mexico—has contributed to a large number of Latinos in their prime childbearing years, compared with other racial and ethnic groups. Even if U.S. borders were closed to all new immigrants, the Latino population would continue to increase because of the young age structure of this population.2
Second, although the TFR among Latinas has fallen sharply in recent years, from 2.4 births per woman in 2010 to 2.0 births per woman in 2017, the Latina TFR remains higher than the rate among African American women (1.8) and white women (1.7).3 In the United States, the overall replacement-level fertility, or the rate needed for a generation to replace itself, is around 2.1 births per woman.
The multiracial population in the United States—those who identify with two or more races—is also increasing with the rise in interracial couples. The children of these interracial unions are forming a new generation that is much more likely to identify with multiple racial groups. In the period from 2012 to 2016, about 10 percent of married-couple households were interracial or interethnic, up from 7 percent in 2000.4 Among newly married couples, about one in six included spouses who identified with different racial or ethnic groups in 2015.5
With the rise in multiracial and multiethnic couples and children, a growing number of Americans are finding it difficult to select a single racial or ethnic group on the census form. We can only speculate what the census will look like in the future, but the racial/ethnic categories will likely be very different than those on the 2020 Census questionnaire.
Children are at the forefront of racial/ethnic change in the United States, creating a diversity gap among generations. The Census Bureau projects that only half of the population under age 18 will be non-Hispanic white by 2020, compared with three-fourths (76 percent) of those ages 65 and older (see Figure 2). Racial/ethnic diversity among America’s youth is partly a result of past immigration trends and the relatively large share of children living in immigrant families: In 2017, one-fourth of U.S. children were foreign-born or lived with one or more parents who were born outside of the United States.6
Projected Racial/Ethnic Distribution of the U.S. Population by Single Year of Age, 2020
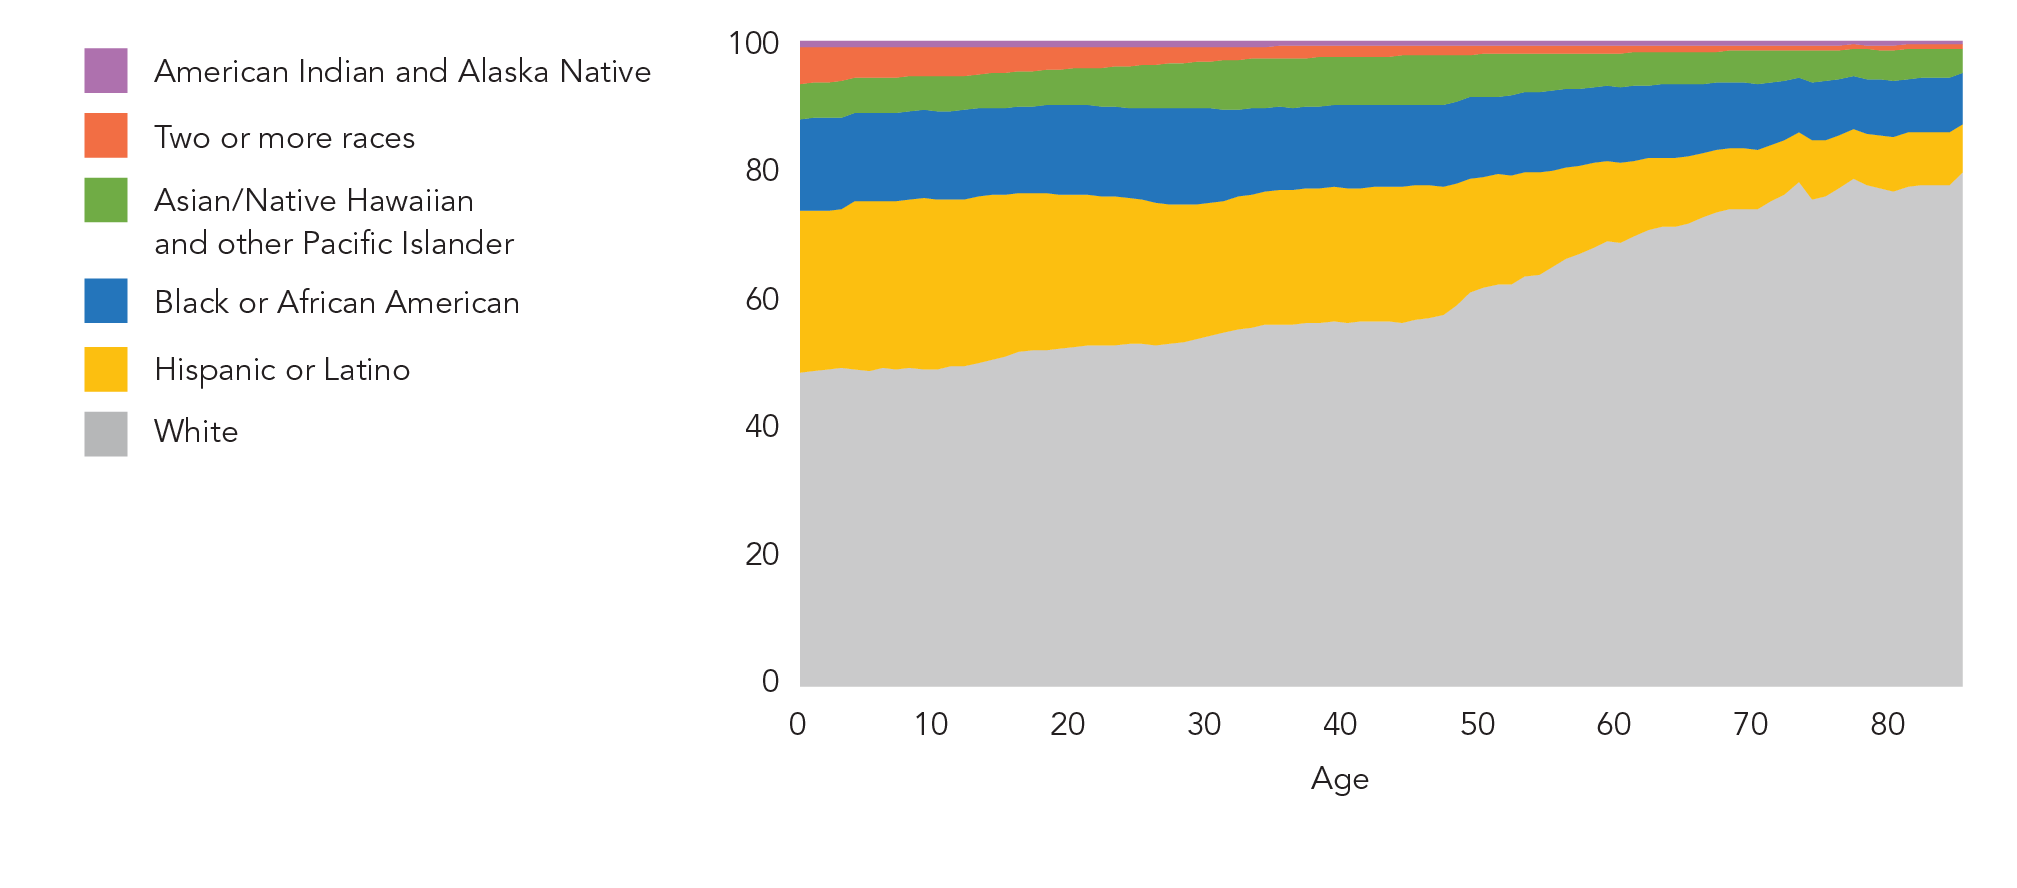
Note: Individual racial groups include only single-race non-Hispanics. Hispanics/Latinos may be of any race.
Source: U.S. Census Bureau, vintage 2017 population projections.
The racial/ethnic divide between generations may contribute to a growing economic gap across different racial/ethnic groups—with a mostly white older population eligible for Social Security benefits that help keep them above the official poverty line, and a racially diverse child population that is more likely to be struggling financially. In 2017, about 17 percent of children under age 18 were living in poverty, compared with 11 percent of working-age adults (18 to 64) and 9 percent of adults ages 65 and older.7
The generational divide among age groups, however, will shrink somewhat during the coming decades as America’s older population becomes more diverse. Between 2020 and 2060, the share of the population ages 65 and older that is non-Hispanic white is projected to drop by 21 percentage points (from 76 percent to 55 percent), and the share that is Hispanic/Latino could more than double from 9 percent to 21 percent (see Figure 3).
U.S. Child and Older Adult Population by Racial/Ethnic Composition (%), 2020 and 2060
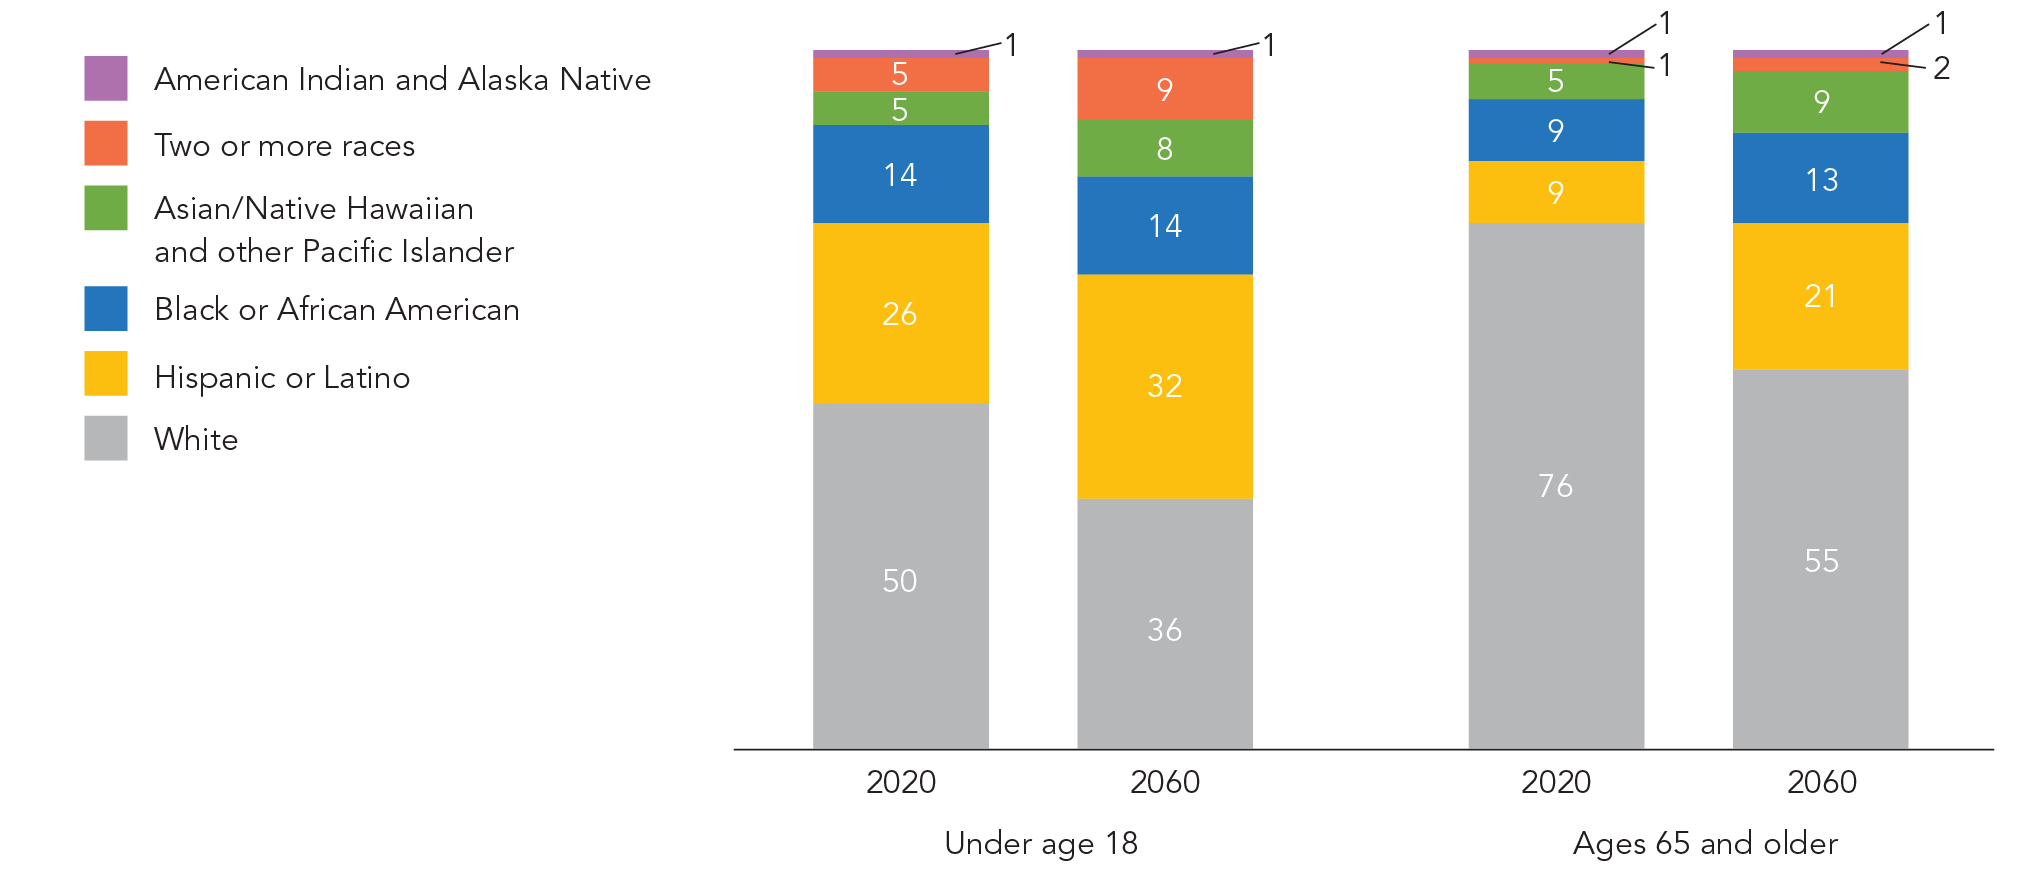
Note: Individual racial groups include only single-race non-Hispanics. Hispanics/Latinos may be of any race.
Source: U.S. Census Bureau, vintage 2017 population projections.
This article is excerpted from Mark Mather et al., “What the 2020 Census Will Tell Us About a Changing America,” Population Bulletin 74, no. 1 (2019).
 ">
">