Citizenship Question Risks a 2020 Census Undercount in Every State, Especially Among Children

The addition of a citizenship question to the 2020 Census may put almost one in 10 U.S. households and nearly 45 million people at greater risk of not being counted―the question has been shown to reduce response rates. Undercount risk is particularly high among young children.
In April 2020, a census questionnaire will be provided by internet or mail to every housing unit in the country. A citizenship status question, which has not been included in a full decennial census enumeration since 1950, is planned for the 2020 Census.1 The question has raised concerns among elected officials, census experts, and community groups, and in the summer of 2018, dozens of states, cities, and other organizations filed lawsuits challenging the question’s addition to the census form.2
Each census question—how it is worded, how many and which categories are included—is usually carefully considered and pretested. The Commerce Department, however, added the citizenship question for the 2020 Census very late in the process. While the question text will be the same as the citizenship question that now appears on the annual American Community Survey (ACS), it was not included in the crucial 2018 Census Test, which served as the final dress rehearsal before the 2020 count.
In a memorandum to the secretary of Commerce in January 2018, the Census Bureau’s chief scientist reported that adding a citizenship question to the decennial census would be “very costly,” “harm the quality of the census count,” and would result in “substantially less accurate citizenship status data than are available from administrative sources.”3
Research Suggests a Citizenship Question Would Add Costs, Decrease Response, and Reduce Quality
Census Bureau research strongly suggests that “adding a citizenship question to the 2020 Census would lead to lower self-response rates in households potentially containing noncitizens, resulting in higher fieldwork costs and a lower-quality population count.”4 In short, adding a citizenship question increases the likelihood that people living with noncitizen(s) will be missed in the census count. When people are not counted in the census it is called an undercount.
To evaluate the size of the population at greater risk of being undercounted, Population Reference Bureau (PRB) identified households from the 2016 ACS in which at least one resident was a noncitizen. Anyone who is not a citizen of the United States by birth or naturalization is considered a noncitizen, including legal permanent residents and people who are in the United States with a student or work visa.
In 2016, at least 9.8 percent of households contained at least one noncitizen, according to analysis of administrative records and ACS data conducted by the U.S. Census Bureau.5 Because households with noncitizens are slightly larger on average than those without noncitizens, approximately 14 percent of the population (nearly 45 million people) lived in households with at least one noncitizen, putting them at increased risk of not being counted.6
The addition of a citizenship question in the 2020 Census may put children at a double disadvantage.
Children, Minorities, and People in Poverty Are Most at Risk
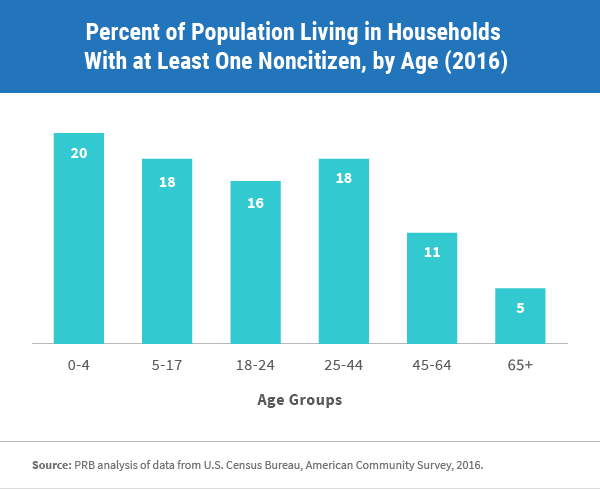
More than 13 million children under age 18 lived with at least one noncitizen in 2016. Across all age groups, children under age 5 were the most likely to live in noncitizen households (20 percent), while the share was lowest for adults ages 65 and older (5 percent) (see figure and table). Given that undercount rates have historically been highest among young children (relative to other age groups), the addition of a citizenship question in the 2020 Census may put children at a double disadvantage.7
TABLE
Estimated Number and Percent of Population Living in Households With at Least One Noncitizen, by Demographic Characteristics, 2016
| Total Population | Population Living in Household With At Least One Noncitizen | ||
| Number | Percent | ||
| Total population | 323,128,000 | 44,824,000 | 14 |
| Age Group | |||
| 0 to 4 | 19,726,000 | 3,943,000 | 20 |
| 5 to 17 | 53,825,000 | 9,438,000 | 18 |
| 18 to 24 | 31,018,000 | 4,813,000 | 16 |
| 25 to 44 | 85,147,000 | 15,103,000 | 18 |
| 45 to 64 | 84,182,000 | 8,860,000 | 11 |
| 65 and older | 49,228,000 | 2,665,000 | 5 |
| Race/Ethnicity | |||
| Hispanic/Latino | 57,390,000 | 25,775,000 | 45 |
| Asian* | 17,362,000 | 7,916,000 | 46 |
| White* | 197,487,000 | 6,772,000 | 3 |
| Black* | 39,809,000 | 3,214,000 | 8 |
| Multiracial* | 7,689,000 | 726,000 | 9 |
| Other* | 741,000 | 226,000 | 30 |
| Native Hawaiian/Pacific Islander* | 533,000 | 153,000 | 29 |
| American Indian/Alaska Native* | 2,117,000 | 42,000 | 2 |
| Citizenship | |||
| Citizen | 300,712,000 | 22,408,000 | 7 |
| Noncitizen | 22,415,000 | 22,415,000 | 100 |
| Housing Tenure | |||
| Renter | 110,685,000 | 24,306,000 | 22 |
| Owner | 204,362,000 | 20,065,000 | 10 |
| Poverty Status | |||
| Income below poverty | 44,208,000 | 9,369,000 | 21 |
| At or above poverty | 270,961,000 | 34,933,000 | 13 |
* Non-Hispanic. Data for American Indian/Alaska Native, Asian, Black, Native Hawaiian/Pacific Islander, Other, and White are for one race alone.
Source: PRB analysis of data from U.S. Census Bureau, American Community Survey, 2016.
People in poverty are also more likely to live in noncitizen households. In 2016, more than one in five people in poverty (21 percent) lived in a household with at least one noncitizen, compared with 13 percent of those above poverty. The share among renters was also high—22 percent of renters lived with at least one noncitizen, more than double the share for homeowners (10 percent).
The Asian population was most likely to live with at least one noncitizen in the household (nearly 46 percent), followed by the Hispanic/Latino population (45 percent). But, due to differences in the relative population size of these two groups, many more Hispanics/Latinos lived with at least one noncitizen (26 million) than Asians (8 million). Among non-Hispanic whites, about 3 percent (7 million) lived with noncitizens. American Indian and Alaska Native people were least likely to live with a noncitizen (2 percent, or 42,000 people).
People in poverty are also more likely to live in noncitizen households.
The Undercount Risk Affects Every State
The state with the largest population―California―had the largest number of people living in noncitizen households (11 million), followed by Texas (6 million). The state with one of the smallest populations―Vermont―had the smallest number of people living in noncitizen households (17,900).
In 21 states and the District of Columbia, 10 percent or more of the population lived in households with at least one noncitizen. In four states―California, Nevada, Texas, and New York―20 percent or more of the population lived in a household with at least one noncitizen (see interactive map).
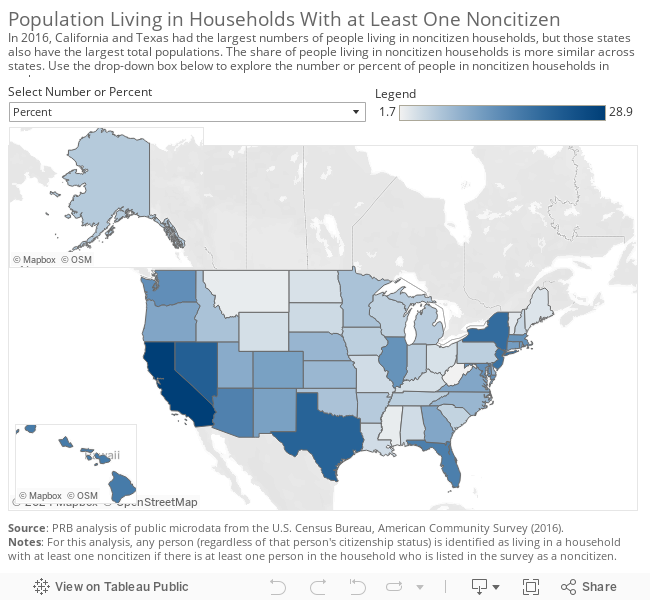
Even states without many international migrants would potentially be affected by a census undercount. In 2016, West Virginia had the smallest share of people living with noncitizens (2 percent), but that still translates to more than 30,000 individuals who could be missed in the 2020 Census count.
An Accurate Count of the Population Is Essential
Article 1, Section 2 of the U.S. Constitution (as amended by the Fourteenth Amendment) states that congressional representation must be based on “counting the whole number of persons in each State.”8 An accurate count of the population is both essential and required for political redistricting, and it plays a vital role in many areas of public life.
The decennial census helps shape important infrastructure investments, such as hospitals, schools, roadways, bridges, and railways. Billions of dollars in federal funding are allocated each year based on census data, with an estimated $675 billion in funds distributed based on census data in fiscal year 2015.9
Accurate census data are also vital for public health. Detailed population information is critical for emergency response in the wake of disasters. First responders and disaster recovery personnel use population data to help identify where and how much help is needed. Similarly, demographic details from the census assist epidemiologists and public health personnel in everything from tracking disease outbreaks, to combating the opioid epidemic, to improving child health.
As these examples suggest, the inclusion of a citizenship question on the 2020 Census could reduce the availability of critical services for some of America’s most vulnerable populations, while also increasing the potential costs to taxpayers and reducing the quality of census data.
- A citizenship question appeared on the decennial census long form, completed by approximately one in six households, in 1980, 1990, and 2000. A citizenship question also appears on the annual American Community Survey.
- Hansi Lo Wang, “Multi-State Lawsuit Against Census Citizenship Question to Move Ahead,” NPR, July 26, 2018, accessed at www.npr.org/2018/07/26/629773825/multi-state-lawsuit-against-census-citizenship-question-to-move-ahead, on Oct. 2, 2018.
- John M. Abowd, “Memorandum: Technical Review of the Department of Justice Request to Add Citizenship Question to the 2020 Census” (Jan. 19, 2018), accessed at www.osec.doc.gov/opog/FOIA/Documents/AR%20-%20FINAL%20FILED%20-%20ALL%20DOCS%20%5bCERTIFICATION-INDEX-DOCUMENTS%5d%206.8.18.pdf#page=1289, on Oct. 2, 2018.
- David Brown et al., “Understanding the Quality of Alternative Citizenship Data Sources for the 2020 Census,” Center for Economic Studies (August 2018), accessed at www2.census.gov/ces/wp/2018/CES-WP-18-38.pdf, on Oct. 2, 2018.
- J. David Brown et al., “Understanding the Quality of Alternative Citizenship Data Sources for the 2020 Census.”
- PRB analysis of data from U.S. Census Bureau, American Community Survey, 2016.
- William P. O’Hare, “Why Are Young Children Missed So Often in the Census?,” The Annie E. Casey Foundation, KIDS COUNT Working Paper (December 2009), accessed at www.aecf.org/m/resourcedoc/aecf-WhyareYoungChildrenMissedInCensus-2009.pdf, on Oct. 2, 2018; and “One Million Missing: Undercount of Young Kids in the 2020 Census Threatens Gains,” The Annie E. Casey Foundation, June 27, 2018, accessed at www.aecf.org/blog/one-million-missing-undercount-of-young-kids-in-2020-census-threatens-gains/, on Oct. 2, 2018.
- “The Constitution: Amendments 11-27,” National Archives, accessed at www.archives.gov/founding-docs/amendments-11-27#14, on Oct. 2, 2018.
Related Posts
American Community Survey Resources, Shortcuts, and Tools Workshop
Expert data users from PRB, the U.S.

Research Identifies New Strategies to Reduce Undercount of Young Children in U.S. 2020 Census
PRB identifies factors predicting where children under age 5 are more likely to be missed in the 2020 Census and develops a new undercount risk measure for young children.