Pyramid Building: How to make a Population Pyramid
This lesson provides students with the background to understand the importance of age structure on population growth. They do this by creating a population pyramid. This process will also help them understand the meaning of different shaped “pyramids” and the impacts of these different growth patterns.
Grade Levels: 7-12
Time Needed: 1-2 days
Learning Objectives:
- Interpret graphic information,
- Create a modified (four-part) population pyramid,
- Interpret and compare modified population pyramids of selected countries, and
- Map identified countries.
Skills To Be Developed:
- Interpreting graphic information
- Preparing graphs
- Identifying locations
Vocabulary To Be Developed: population pyramid, age-sex composition
Materials Needed:
- copies of Modified Population Pyramid (PDF: 25KB) outline
- small (1 inch x 2 inch) “Post-It” notes
- world wall map
- overhead transparency of chart Three Patterns of Population Change (PDF: 52KB)
- overhead transparency of “Modified Population Pyramid” outline
Lesson Procedure
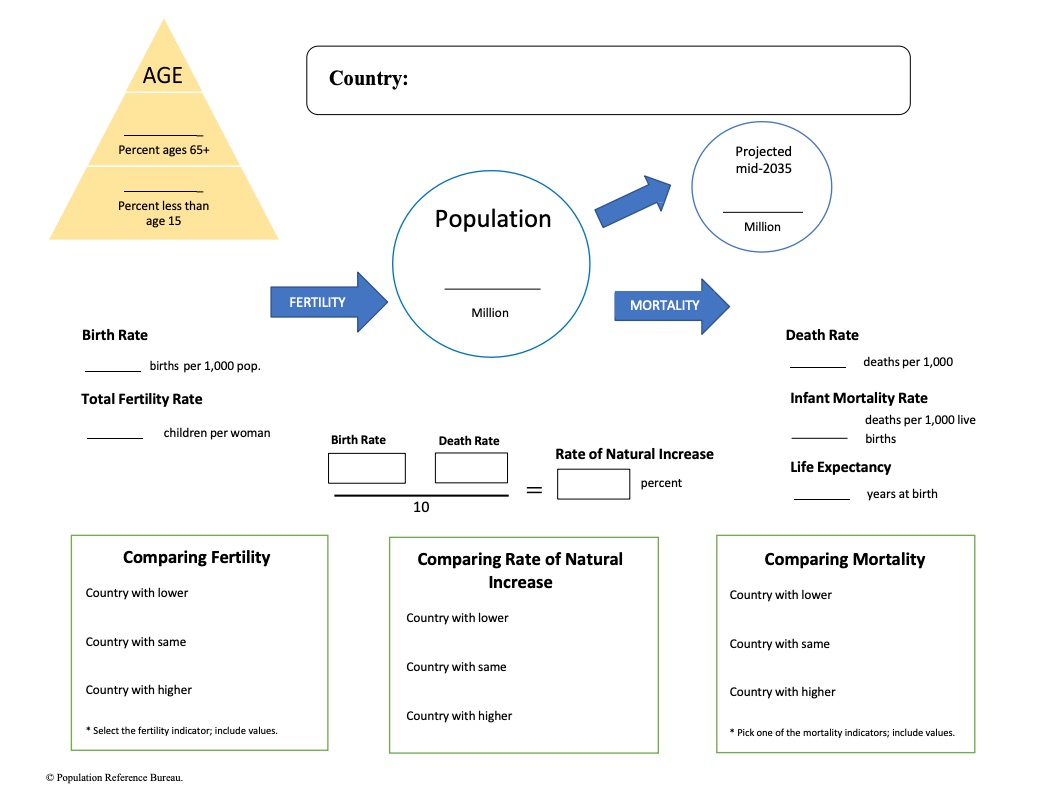
- Show the chart, “Three Patterns of Population Change,” on the overhead. If you use the figure with the Democratic Republic of Congo and Germany pyramids, cover these up for the first part of the lesson. Explain that a population pyramid shows the age and sex structure of a population. Point to the horizontal bars, which show the percentage (or the absolute number) of males and females in each age group.
- Have students interpret the chart. Which age group has the greatest proportion of people? (35-39) Which bar includes the students in this classroom? (10-14 or 15-19) Are there more people in your age group or in the age group below yours? Explain that a pyramid shows the history of a country’s population growth. In the United States from 1945 to 1965, people had larger families. These people are now between the ages of 30 and 50 and are called baby boomers. Point to this group on the pyramid.
- Now show them pyramids for Congo and Germany. Have them describe Congo’s population structure. How is Congo’s pyramid different from that of the U.S.? (There are more people in the younger age groups.) Which age group in Congo is the largest? (0-4) What proportion of the population is in this age group? (Almost 20 percent; about 9 percent are males and 9 percent females.) Now look at Germany. How is it different? (The age groups are closer to being equal.) How is it different from Congo? (There is a greater proportion of older people.)
- Ask students: Why would a country ‘s leaders want to know the proportion of the population in different age groups? What difference does the age of the people in a country make? (People of different ages have different needs.) What kinds of products do young people use? What kinds of services do they need? (diapers, day care, toys, health care, schools, etc.) What about older people? (different kinds of health care, different foods, different products) Is it important for a government leader or planner to know the age of the population they are serving?
- Explain that each student is going to draw a population pyramid for a specific country. However, the class will practice first with the U.S. Explain that the pyramid will have only four age categories instead of 16 like the ones shown.
- Pass out copies of a blank Modified Population Pyramid outline. Put the corresponding transparency on the overhead. Point out that males are on the left, females on the right and they are measured as a percentage of the population. Read off the age categories. Tell students that 14 percent of females are ages 0-19. Have them draw a line from the bottom of the box at 14 percent up to the next line. Demonstrate. Do the same for the males and continue in the same manner for the other age groups.
US Population by Age 2000 (percent)
| AGES | MALES | FEMALES |
|---|---|---|
| 0-19 | 15% | 14% |
| 20-39 | 15% | 14% |
| 40-59 | 13% | 13% |
| 60+ | 7% | 9% |
Source: U.S. Census 2000.
- Next, distribute copies of the Population Pyramid Data Table and another copy of the blank Modified Population Pyramid outline. Organize the class into groups of four to six students each. Then assign students to graph the pyramids of particular countries, identified by numbers. (Assign the countries in numerical order. Each group will then be graphing a variety of pyramid styles.)
- Have students share their pyramids with the other students in their group. They should discuss similarities and differences in the shapes of their pyramids. What might be some of the reasons for different shapes? For example, Country #12 has many more males than females in the 20-39 age group (male workers migrating from other countries).
- Now have students group themselves by pyramid shape. (You may wish to post large copies of the different styles of pyramids and then say, “Everyone with a pyramid that looks like Congo come to the front of the room…”) Students should then line up by pyramid type, with broad based, narrow-topped pyramids (rapid growth) on the left side of the room, slow-growth pyramids in the center, and negative growth on the right side.
- Students should look at the list of possible countries and guess which country they represent. After students have made their guesses, the teacher (using the Population Pyramid Data Table Teacher’s Key) should identify each of the pyramids graphed by the students.
- Students should seek patterns among the graphs within the regions.
Extension: Create a population pyramid with 16 or 17 age groups. Obtain data from the United Nations Demographic Yearbook or write to the Population Reference Bureau for more information.
View dynamic pyramids from the Census Bureau’s International Data Base: www.census.gov/ipc/www/idbpyr.html.
Guide to Making Pyramids with Excel: Create a population pyramid using an Excel spreadsheet and graphing function. Download instructions: May 1999 Population Today (PDF: 864KB).