Understanding and Comparing Population Projections in Sub-Saharan Africa

The release of a new set of population projections by the Institute for Health Metrics and Evaluation (IHME) in July 2020 was greeted with extensive coverage in the media and stimulated fresh debate among demographers about calculation and communication of projections. Sound population projections serve a critical purpose. They enable policymakers, researchers, and planners to accurately estimate future service demands (for example, health care and schools) and develop policies and programs informed by predicted trends. But population projections are generated using assumptions about the future, so they always include an element of uncertainty and variability that should inform their interpretation.
IHME’s projections join an established field, with other leading demographic projections produced regularly by the United Nations Population Division (UN), one of the most longstanding and widely used sources; and the International Institute for Applied Systems Analysis (IIASA). The three sets of projections apply different assumptions about future trends in fertility. The UN assumptions are largely based on historical observations from other countries, as well as countries’ own trends. In contrast, the models of fertility developed by IHME and IIASA incorporate women’s educational attainment, and in the case of IHME, also consider met need for family planning—the percentage of women of reproductive age who wish to stop or delay childbearing and are using a modern contraceptive method. The assumptions and methods used to generate each set of projections are summarized in the webinar, “What to Expect When You’re Projecting? Interrogating Population Projections and Their Fertility Assumptions,” organized by the Health Policy Plus Project. 1
PRB reviewed these three organizations’ population and fertility projections and their underlying assumptions in sub-Saharan Africa (SSA) to see how they differ. SSA is home to countries with some of the world’s highest fertility rates, and trends in fertility and population across the region will have large implications for the future global population. Figure 1 shows wide variations in these three organizations’ projections. Even though they all have the same 2020 population of 1.1 billion, the differences in their assumptions create increasingly greater gaps in projections over time. Projections by the UN and IHME are similar until around 2060, when the organizations’ different underlying assumptions gradually begin to produce significantly different projections: The gap between the two reaches 0.4 billion people by 2085 and 0.7 billion by 2100. Projections by the UN and IIASA are also similar until around 2040, but the gap grows to 0.9 billion people by 2085, and as many as 1.2 billion by 2100. These differences have implications for policy decisionmaking and risk management related to key aspects of the global economy, environmental protection, and resource distribution.
By 2100, the UN projects the population in SSA will reach 3.8 billion, IHME projects 3.1 billion, and IIASA is the lowest at 2.6 billion. 2 These very different projections beg the question: What is the source of these differences and how can we, as consumers, assess which projection may be most realistic?
FIGURE 1. Population Projections for Sub-Saharan Africa in 2100 Vary Greatly
Source: IHME, Population Forecasting | VizHub; UN DESA, World Population Prospects: The 2019 Revision; and Wittgenstein Centre for Demography and Global Human Capital, Wittgenstein Centre Human Capital Data Explorer.
Fertility Is Projected to Decline, but How Much and How Fast?
The ingredients of any population projection are the starting, or baseline, population combined with assumptions about future trends in fertility, mortality, and migration. Demographers generally agree that in countries where fertility is high, the total fertility rate (TFR) will gradually decrease to around what is known as replacement level (2.1 children per woman) or below. The TFR is the average number of children a woman would have assuming current age-specific birth rates remain constant throughout her childbearing years (usually considered to be ages 15 to 49).
But demographers disagree on when, by exactly how much, and how fast fertility will decrease. Assumptions for these variables make a big difference in resulting population projections. To develop their projections, demographers apply statistical methods, expert insight, the latest data and evidence or, typically, a combination of the above. Of the future trends that influence population projections, fertility is the most relevant for countries in SSA, where women have an average of 4.8 children over their lifetimes.3
Neither the starting population nor the 2018 TFR estimates are likely driving the large variations in the resulting population projections for SSA. The projections from UN, IIASA, and IHME each use a similar estimate of approximately 1.1 billion in 2020 for the starting population size. Across the region, the 2018 TFR estimates that each organization uses for countries in SSA vary, but with no evidence of a specific bias: The 2018 TFRs used by one organization are not consistently higher or lower than those used by the other organizations (figure not presented here but is available upon request).
Figure 2 shows the 2100 TFRs projected by each organization for all SSA countries, sorted by the UN’s estimates (in orange). All three organizations project that TFRs across SSA will largely be below the replacement level of 2.1 children per woman by 2100. However, the organizations differ on the degree to which they project the TFRs to decline across countries. The UN projects that nearly one-third of countries in SSA will not reach replacement-level fertility by 2100. This projection includes sizable, high-fertility countries like Tanzania, Niger, and Nigeria. In contrast, IIASA’s TFR projections for all countries in SSA are below replacement level in 2100, and are typically in between the levels projected by the UN and IHME. In IHME’s projections, TFRs in all but four countries are expected to fall below replacement level, and generally to levels substantially lower than the other two projections.
FIGURE 2. IHME and IIASA Project Lower Fertility in Sub-Saharan Africa in 2100 Than the UN
Source: IHME, Population Forecasting | Viz Hub; UN DESA, World Population Prospects: The 2019 Revision; and Wittgenstein Centre for Demography and Global Human Capital, Wittgenstein Centre Human Capital Data Explorer.
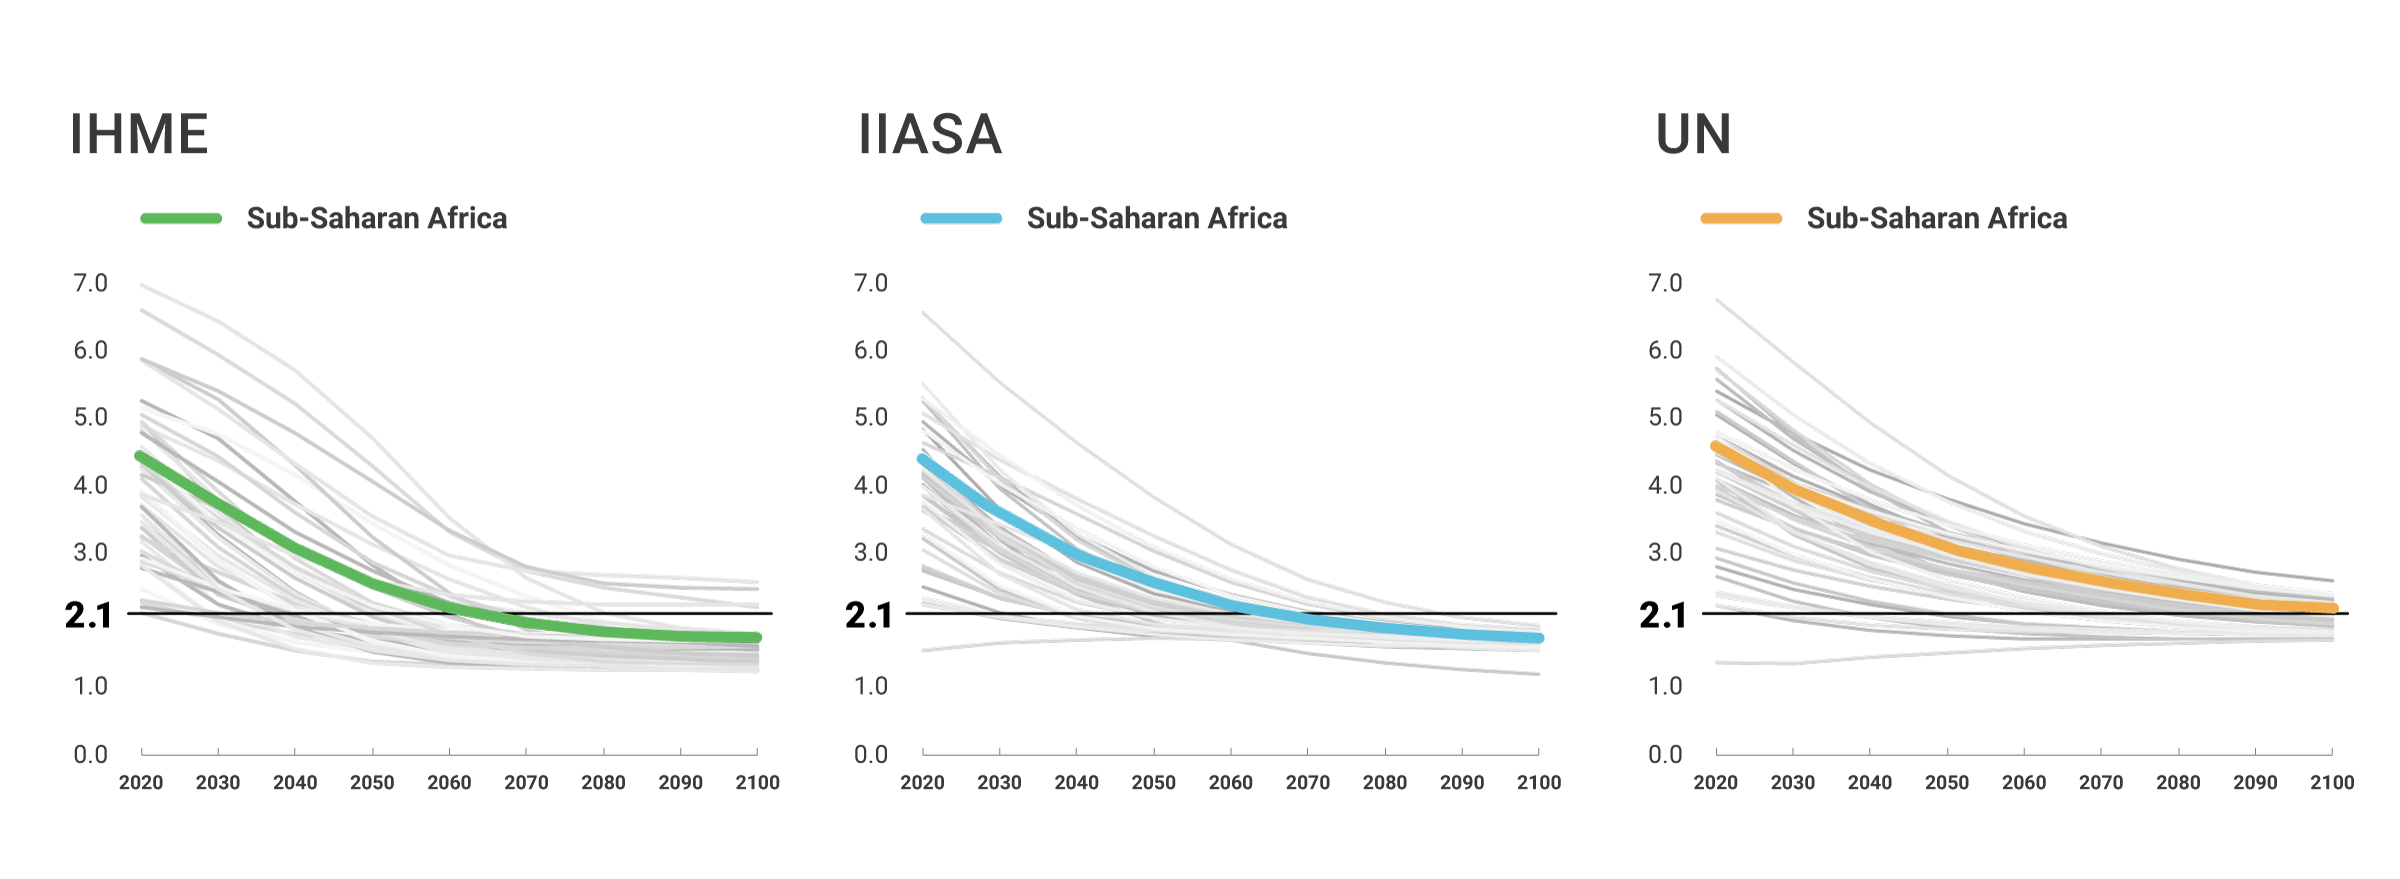
Similar differences exist when we look at the pace at which each organization (UN, IHME, and IIASA) projects TFR to decline between 2020 and 2100. Figure 3 displays three line graphs, one for each set of projections. Each line on each graph shows the trend in TFR for all countries in SSA for which data are available. The thick colored line in each graph shows the average trend of fertility decline for the region. The horizontal black line at TFR of 2.1 indicates replacement-level fertility. In comparing when the average rate of decline dips below replacement-level fertility in each set of projections, we see a much earlier transition to below replacement-level fertility in the IHME and IIASA projections (in the 2050s) compared to the UN projections (2080s).
Figure 3. IHME and IIASA Project Much Faster Declines in Fertility than the UN
Source: IHME, Population Forecasting | Viz Hub; UN DESA, World Population Prospects: The 2019 Revision; and Wittgenstein Centre for Demography and Global Human Capital, Wittgenstein Centre Human Capital Data Explorer.
Each organizations’ fertility projections differ even more significantly for very high fertility countries. Niger currently has the world’s highest TFR at approximately 6.5 to 7.1 children per woman, depending on which estimate is used. IHME and IIASA project that Niger’s TFR will decline to below 2.1 in the 2080s and eventually to 1.8 and 1.9, respectively, by 2100, while the UN projects Niger’s TFR will not reach replacement level before 2100.
Another relevant example is the Democratic Republic of the Congo (DRC). IHME and IIASA project that the DRC’s TFR will decrease to 2.1 in the 2060s and further to 1.8 by 2100, while the UN projects that it will be 2100 before the DRC’s TFR reaches replacement level.
Are IHME’s Fertility Projections Too Low?
These differences become even more striking when evaluating changes in country TFR rankings between 2018 and 2100. If all the countries in the world were sorted by TFR in 2018 and again by projected TFR in 2100, we might expect some general consistency between a country’s relative standing at the two points in time.4Ranking IHME’s projected TFRs shows that, of the 39 countries in SSA on the list of the world’s 50 highest TFRs in 2018, only nine remain on the list in 2100. Even more surprising, IHME projections show that eight countries on the list of 50 highest TFRs in 2018 appear on the list of the world’s 50 lowest TFRs in 2100. This shift is significant and could suggest that IHME, in particular, may be overestimating the extent of fertility decline for these and possibly other countries in the region. Making the same comparison for the UN’s projected TFRs shows that 33 of the 39 countries on the list of the world’s 50 highest TFRs in 2018 remain in 2100. Additionally, none ended up on the list of countries with the lowest TFRs in 2100. IIASA’s results are between the two, with less transition compared to IHME, but more than the UN.
How Well Do Fertility Assumptions Fare Against the Evidence?
As discussed above, IHME and IIASA incorporate women’s educational attainment in their models of fertility, and in the case of IHME, also consider met need for family planning.5The relationships between education and fertility and between family planning use and fertility are considered universal in the IHME and IIASA models, meaning the same relationship between fertility and both girls’ education and family planning is assumed for countries around the world. Is this assumption reasonable given the latest evidence about the drivers of fertility change, particularly drivers unique to countries in SSA?
Data demonstrate that fertility transitions in SSA started later and progressed more slowly compared to what has been observed historically elsewhere, including in Asia and Latin America.6Research also suggests that at a given level of socioeconomic development, countries in SSA tend to have higher levels of fertility and desired family size compared to other regions around the world.7These findings indicate that SSA may have a distinct pattern of fertility transition.
Additionally, research has demonstrated that women’s secondary school attainment is a crucial factor influencing fertility levels in high-fertility countries, and women’s educational attainment progress has been comparatively slow in SSA relative to other regions.8A study released in September 2020 found that the impact of women’s educational attainment on fertility decline is weaker in SSA than in other regions.9Other research suggests that the lower quality of education in SSA relative to other regions may also contribute to the weaker influence of women’s education on fertility decline in the region.10
Studies have likewise indicated a weaker relationship between modern contraceptive use and fertility decline in SSA, relative to that observed in other regions. This weaker association may be partly attributable to a higher proportion of women in many SSA countries using contraception to space births rather than to limit them.11In addition, data indicate a preference for larger families in many SSA countries than in other regions. High ideal family size is a principal factor influencing the slow pace of fertility decline in SSA and may offset the accelerating effects of modern contraceptive use on fertility decline.12
Given this evidence base, IHME and IIASA’s application of universal assumptions about the effects of education and contraception on fertility decline may be unwarranted. If the relationships between education, contraception, and fertility look different across and within SSA relative to other regions, models that assume these relationships to be universal could significantly overestimate the pace and magnitude of fertility decline in SSA.
The expanding pool of population projections is an exciting development for data consumers but reminds us that all projections—including more established forecasts such as the UN’s—must be critically assessed prior to use. The assumptions driving population projections should always be verified using evidence from high-quality research and knowledge of regional contexts to ensure that we are smart consumers and smart sharers of data. The coronavirus pandemic is a reminder of how much uncertainty exists in any of the underlying assumptions regarding future populations. While it is too early to tell what the pandemic’s full impact will be on fertility, mortality, and migration patterns, as well as its potential impact on family planning access and schooling, its long-term impacts add another layer of uncertainty and complexity to projection assumptions in the coming years.
Messages about various projections—and their potential policy implications—must be developed with caution and transparency. Projections not only allow us to plan for the future, but also often inform policy and program priorities and investments and can influence the future course of population trends and people’s well-being. It is our responsibility to be vigilant in our understanding of the projections we choose to use.
- Emil Vollset Stein et al., “Fertility, Mortality, Migration, and Population Scenarios for 195 Countries and Territories From 2017 to 2100: A Forecasting Analysis for the Global Burden of Disease Study,” The Lancet 396, no. 10258 (2020): 1285-306; and Wolfgang Lutz et al. (eds.), Demographic and Human Capital Scenarios for the 21st Century: 2018 Assessment for 201 Countries (Luxembourg: European Union, 2018), http://publications.jrc.ec.europa.eu/repository/bitstream/JRC111148/jrc_cepam_report_demographic_and_hc_scenarios_pdf.pdf
- Institute for Health Metrics and Evaluation (IHME), Population Forecasting | Viz Hub, https://vizhub.healthdata.org/population-forecast/; United Nations Department of Economic and Social Affairs (UN DESA), World Population Prospects: The 2019 Revision, https://population.un.org/wpp/; and Wittgenstein Centre for Demography and Global Human Capital, Wittgenstein Centre Human Capital Data Explorer, http://dataexplorer.wittgensteincentre.org/wcde-v2/.
- Toshiko Kaneda, Charlotte Greenbaum, and Kelley Kline, 2020 World Population Data Sheet, (Washington, DC: Population Reference Bureau, 2020).
- Stuart Gietel-Basten and Tomas Sobotka, “Uncertain Population Futures: Critical Reflections on the IHME Scenarios of Future Fertility, Mortality, Migration and Population Trends From 2017 to 2100” (2020), https://osf.io/preprints/socarxiv/5syef/.
- Emil Vollset Stein et al., “Fertility, Mortality, Migration, and Population Scenarios for 195 Countries and Territories From 2017 to 2100: A Forecasting Analysis for the Global Burden of Disease Study,” The Lancet 396, no. 10258 (2020): 1285-306; and Wolfgang Lutz et al. (eds.), Demographic and Human Capital Scenarios for the 21st Century: 2018 Assessment for 201 Countries (Luxembourg: European Union, 2018), http://publications.jrc.ec.europa.eu/repository/bitstream/JRC111148/jrc_cepam_report_demographic_and_hc_scenarios_pdf.pdf
- John Bongaarts, “Africa’s Unique Fertility Transition,” Population and Development Review 43, S1 (2017): 39-58; and Bongaarts and John Casterline, “Fertility Transition: Is Sub-Saharan Africa Different?” Population and Development Review 38, S1 (2013): 153-68.
- Bongaarts, “Africa’s Unique Fertility Transition;” and Bongaarts and Casterline, “Fertility Transition: Is Sub-Saharan Africa Different?”
- Daphne H. Liu and Adrian E. Raftery, “How Do Education and Family Planning Accelerate Fertility Decline?” Population and Development Review 46, no. 3 (2020): 409-41.
- Liu and Raftery, “How Do Education and Family Planning Accelerate Fertility Decline?”
[10] Monica J. Grant, “The Demographic Promise of Expanded Female Education: Trends in the Age at First Birth in Malawi,” Population and Development Review 41, no. 3 (2015): 409-38. - Kristin Bietsch, The Relationship between Modern Contraceptive Use and Use to Limit: African Exceptionalism (Track20, Avenir Health, 2019), http://www.track20.org/download/pdf/mCPR_spacing_limiting_Memo_100919.pdf.
- Bongaarts and Casterline, “Fertility Transition: Is Sub-Saharan Africa Different?”; and Daphne H. Liu and Adrian E. Raftery, “How Do Education and Family Planning Accelerate Fertility Decline?”
Related Posts
Adolescents and Youth Are Key to Fully Achieving Universal Health Coverage
In 2021, adolescents and youth between ages 10 and 24 are estimated to make up approximately 24% of the world’s population.

Population Age Structure and Pathways to Inclusive, Effective Governance
Among countries with a youthful population, a window of opportunity to achieve key development goals opens across four sectors―health, education, the economy, and governance―as fertility declines and the age structure of the population gets older.

Aging and Health in China: What Can We Learn From the World’s Largest Population of Older People?
The United Nations projects that there will be 366 million older Chinese adults by 2050, which is substantially larger than the current total U.S. population of 331 million.