Oldest Areas May Be Hardest Hit: The Importance of Age Structure in Understanding Mortality During the Coronavirus Pandemic

While we have much to learn yet about the novel coronavirus SARS-CoV2, and the COVID-19 disease it causes, evidence to date suggests that deaths among people who have tested positive for the coronavirus are highest at older ages and near zero for young children. Higher mortality rates at older ages may be associated with the increased prevalence of chronic conditions at older ages, such as cardiovascular diseases, diabetes, and chronic respiratory diseases. These chronic conditions appear to be associated with more severe illness and worse patient outcomes. The age pattern of mortality means that areas with higher proportions of older adults are likely at risk of higher rates of severe illness or death than those with younger populations.
Many factors may affect the intensity of a COVID-19 outbreak in a given country, including underlying health conditions in the population, the effectiveness of government response, and the availability of health care resources. Age structure (the share of the total population in each age group) alone cannot tell us which countries will be hardest hit in the pandemic but can provide important context in understanding and responding to the crisis. If two countries have the same age-specific mortality rates from COVID-19, the country with an older population would have more deaths per 1,000 people—a higher crude death rate—from the disease than the country with the younger population.
For example, social distancing measures in Italy may have helped that country reduce transmission of the disease, but its high proportion of older adults, in combination with high case fatality rates (proportion of the confirmed cases with COVID-19 that were fatal) at older ages has contributed to a large number of COVID-19-related deaths. In 2020, Italy was one of the oldest countries in the world; nearly 30% of Italy’s population is ages 60 and older and nearly 4% is ages 85 and older (see table). In contrast, China—where the virus started and the number infected spiraled until recently—has 17% of population ages 60 and older and less than 1% ages 85 and older. With the death rate from the disease reported to be six times higher among those above age 80 compared with the rate overall, the number of COVID-19-related deaths could have been much higher if China had an older age structure.1
Click on the table and interactive figure to compare age structures across countries.
Table. Comparing Age Structures Across Countries, 2020
| wdt_ID | Country | Ages 60 and Older | Ages 85 and Older |
|---|---|---|---|
| 1 | Argentina | 15,50 | 1,20 |
| 2 | Australia | 21,80 | 2,10 |
| 3 | Brazil | 14,00 | 0,90 |
| 4 | Chile | 17,40 | 1,40 |
| 5 | China | 17,40 | 0,70 |
| 6 | Egypt | 8,20 | 0,30 |
| 7 | France | 26,80 | 3,40 |
| 8 | Germany | 28,60 | 3,10 |
| 9 | Iran | 10,30 | 0,40 |
| 10 | Italy | 29,80 | 3,70 |
| 11 | Japan | 34,30 | 4,80 |
| 12 | Kenya | 4,20 | 0,10 |
| 13 | Nigeria | 4,50 | 0,00 |
| 14 | Peru | 12,50 | 0,70 |
| 15 | South Africa | 8,50 | 0,20 |
| 16 | South Korea | 23,20 | 1,50 |
| 17 | United Kingdom | 24,40 | 2,50 |
| 18 | United States | 22,90 | 2,00 |
Figure. Population by Age Group, 2020
Click on image to view interactive.

Related Posts
Research Identifies New Strategies to Reduce Undercount of Young Children in U.S. 2020 Census
PRB identifies factors predicting where children under age 5 are more likely to be missed in the 2020 Census and develops a new undercount risk measure for young children.

Lesson Plans on Human Population and Demographic Studies
Find out the answers to these questions and more. The sections listed below explore eight elements of population dynamics.

Report. Population Trends and Challenges in the Middle East and North Africa
(2001) The people of the Middle East and North Africa (MENA) have long played an integral, if sometimes volatile, role in the history of human civilization.
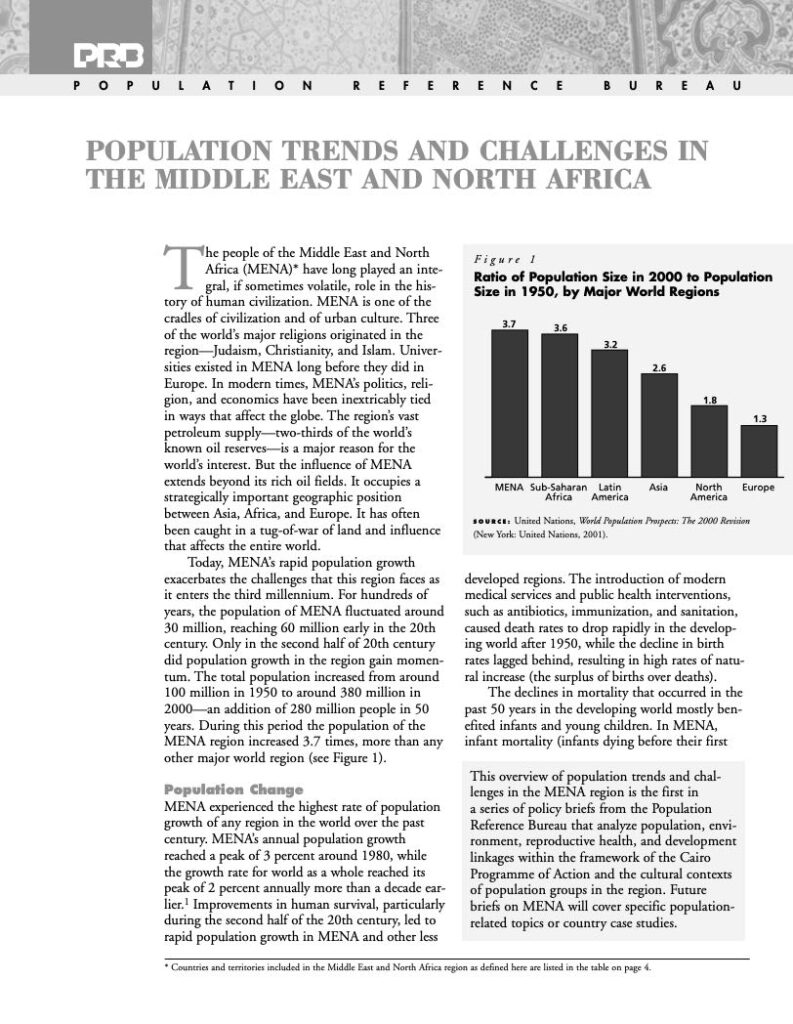
Population Trends and Challenges in the Middle East and North Africa
(2001) The people of the Middle East and North Africa (MENA) have long played an integral, if sometimes volatile, role in the history of human civilization.