 ">
">
This Population Bulletin Update is a follow-up to 2006’s Population Bulletin, “Immigration: Shaping and Reshaping America” by Phil Martin and Elizabeth Midgley, and provides new data and analysis on the economic impacts and policy debates around immigration.
(June 2010) Recent immigration patterns and policies show both continuity and change. Continuity is reflected in the arrival of an average of 104,000 foreigners a day in the United States. This group includes 3,100 who have received immigrant visas that allow them to settle and become naturalized citizens after five years, and 99,200 tourists and business and student visitors (see table). About 2,000 unauthorized foreigners a day settle in the United States. Over half elude apprehension on the Mexico-U.S. border; the others enter legally, but violate the terms of their visitor visas by going to work or not departing.1
Two developments have rekindled the immigration reform debate. The recent recession, the worst since the Great Depression, exacerbated unemployment and reduced the number of unauthorized foreigners entering the country. However, most unauthorized foreigners did not go home even if they lost their jobs, since there were also few jobs in their home countries. The recession resulted in the loss of 8 million jobs; civilian employment fell from 146 million at the end of 2007 to 138 million at the end of 2009. There was also stepped-up enforcement of immigration laws, especially after the failure of the U.S. Senate to approve a comprehensive immigration reform bill in 2007, including the proposal to require employers to fire employees whose names and social security data do not match. Experts agree that the stock of unauthorized foreigners fell in 2008-09 for the first time in two decades, but they disagree over why it fell. Some studies stress the recession, suggesting that the stock of unauthorized foreigners will increase again with economic recovery and job growth. Others stress the effects of federal and state enforcement efforts to keep unauthorized workers out of U.S. jobs.2
Entries In and Out of the United States, 2005-2009
| Category | 2005 | 2006 | 2007 | 2008 | 2009 |
|---|---|---|---|---|---|
| Legal Immigrants | 1,122,373 | 1,266,129 | 1,052,415 | 1,107,126 | 1,130,818 |
| Immediate relatives of U.S. citizens | 436,231 | 580,348 | 494,920 | 488,483 | 535,554 |
| Other family-sponsored immigrants | 212,970 | 222,229 | 194,900 | 227,761 | 211,859 |
| Employment-based | 246,878 | 159,081 | 162,176 | 166,511 | 144,034 |
| Refugees and asylees | 150,677 | 216,454 | 136,125 | 166,392 | 177,368 |
| Diversity and other immigrants | 75,617 | 88,017 | 64,294 | 57,979 | 62,003 |
| Estimated emigration | -312,000 | -316,000 | -320,000 | -324,000 | -328,000 |
| Legal Temporary Migrants | 32,003,435 | 33,667,328 | 37,149,651 | 39,381,925 | 36,231,554 |
| Pleasure/business | 28,510,374 | 29,928,567 | 32,905,061 | 35,045,836 | 32,190,915 |
| Foreign students (F-1) | 621,178 | 693,805 | 787,756 | 859,169 | 895,392 |
| Temporary foreign workers | 882,957 | 985,456 | 1,118,138 | 1,101,938 | 936,272 |
| Illegal Immigration: Apprehensions | 1,291,142 | 1,206,457 | 960,756 | 791,568 | — |
| Removals or deportations | 246,431 | 280,974 | 319,382 | 358,886 | — |
| Change in unauthorized foreigners | 572,000 | 572,000 | 572,000 | -650,000 | — |
— Data not available
Note: The stock of unauthorized rose from 8.4 million in 2000 to 12.4 million in 2007, and in 2009 dipped to 11.1 million.
Sources: DHS; and unauthorized foreigners data from Jeff Passel, Pew Hispanic Center, accessed at http://pewhispanic.org/topics/?TopicID=16, on June 3, 2010.
The second stimulus for a renewed debate is that more states and cities are enacting laws to deal with unauthorized migration, including an Arizona law signed in April 2010 that makes unauthorized presence in the state a crime. Public opinion polls find widespread dissatisfaction with the “broken” immigration system. Congress has debated comprehensive immigration reform for a decade without passing new legislation. The U.S. House of Representatives approved a bill in 2005 and the Senate followed in 2006, but Congress has been unable to agree on a three-pronged package that would toughen enforcement against unauthorized migration, legalize most unauthorized foreigners, and create new guest worker programs and expand current ones. Arizona and a dozen other states require employers to use the federal government’s electronic E-Verify system to check the legal status of new hires; private employers with federal contracts must also use E-Verify.
Immigration and Population
Figure 1
Annual Number of Legal U.S. Immigrants by Decade and Region of Origin, 1960-2009
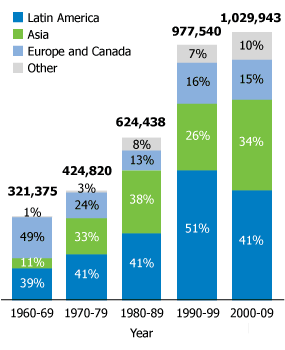
Note: Numbers may not add to 100 percent due to rounding.
Source: Department of Homeland Security (DHS) Immigration Statistics.
Immigration has a major effect on the size, distribution, and composition of the U.S. population. As U.S. fertility fell from a peak of 3.7 children per woman in the late 1950s to 2.0 today, the contribution of immigration to U.S. population growth increased. Between 1990 and 2010, the number of foreign-born U.S. residents almost doubled from 20 million to 40 million, while the U.S. population rose from almost 250 million to 310 million. Thus, immigration directly contributed one-third of U.S. population growth and, with the U.S.-born children and grandchildren of immigrants, immigration contributed half of U.S. population growth.
The United States had 39 million foreign-born residents in 2009; 11 million, almost 30 percent, were in the United States illegally. The United States has the most foreign-born residents of any country, three times more than number-two Russia, and more unauthorized residents than any other country. The United States, with 13 percent foreign-born residents, has a higher share of immigrants among its residents than most European countries, but a lower share than Australia and Canada.3
In recent decades, immigrants have been mostly Asian and Hispanic, changing the composition of the U.S. population (see Figure 1). In 1970, about 83 percent of the 203 million U.S. residents were non-Hispanic whites and 6 percent were Hispanic or Asian. In 2010, the United States had 310 million residents; two-thirds were non-Hispanic white and 20 percent were Hispanic or Asian. If current trends continue, by 2050 the non-Hispanic white share of U.S. residents will decline to about 50 percent while the share of Hispanics and Asians taken together will rise to one-third (see Figure 2).4
Economic Impacts of Immigration
Most immigrants come to the United States for economic opportunity; about 100,000 a year, less than 10 percent, arrive as refugees and asylum seekers fleeing persecution in their own countries. About half of immigrants and U.S.-born persons are in the U.S. labor force—a slightly higher share of foreign-born men and a slightly lower share of foreign-born women. In 2009, about 15 percent of U.S. workers were born outside the United States.
The effects of foreign-born workers on U.S. labor markets are hotly debated. Economic theory predicts that adding foreign workers to the labor force should increase economic output and lower wages, or lower the rate of increase in wages. This theory was confirmed by a National Research Council study that estimated immigration raised U.S. GDP, the value of all goods and services produced, one-tenth of 1 percent in 1996, increasing that year’s GDP of $8 trillion by up to $8 billion.5 U.S. GDP was $15 trillion in 2010, suggesting that immigration contributed up to $15 billion. Average U.S. wages were depressed 3 percent because of immigration.
Figure 2
U.S. Population by Race and Ethnic Group, 1970, 2010, 2050
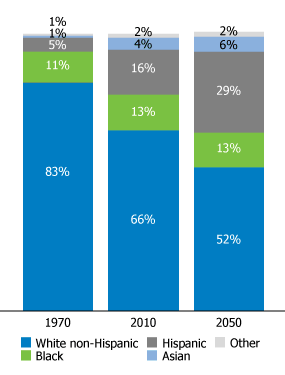
Source: U.S. Census Projections With Constant Net International Migration, accessed at www.census.gov/population/www/projections/2009cnmsSumTabs.html.
However, comparisons of cities with varying proportions of immigrants have not yielded evidence of wage depression linked to immigration. For example, in 1980, over 125,000 Cubans left for the United States via the port of Mariel. Many settled in Miami, increasing the labor force by 8 percent, but the unemployment rate of African Americans in Miami in 1981 was lower than in cities such as Atlanta, which did not receive Cuban immigrants.6 One reason may be that U.S.-born workers who competed with Marielitos moved away from Miami, or did not move to Miami.
Because of internal migration, most economists look for the impacts of immigrants throughout the U.S. labor market rather than in particular cities. Immigrants and U.S.-born workers are often grouped by their age and education in order to determine, for example, how 20-to-25-year-old immigrants with less than a high school education affect similar U.S.-born workers. Economist George Borjas assumed that foreign-born and U.S.-born workers of the same age and with the same levels of education are substitutes, meaning that an employer considers foreign- and U.S.-born workers to be interchangeable.7 However, if foreign-born and U.S.-born workers are complements, meaning that a 30-year-old U.S.-born carpenter with a high-school education is more productive because he has a foreign-born helper, immigrants can raise the wages of similar U.S.-born workers.8 Estimated immigrant impacts depend largely on assumptions, and economic studies have not reached definitive conclusions.9
Immigrants do more than work—they also pay taxes and consume tax-supported services. Almost half of the 12 million U.S. workers without a high-school diploma are immigrants, and most have low earnings. Most taxes from low earners flow to the federal government as Social Security and Medicare taxes, but the major tax-supported services used by immigrants are education and other services provided by state and local governments.10 Because of this, some state and local governments call immigration an unfunded federal mandate and attempt to recover from the federal government the cost of providing services to immigrants.
Next page:
The path to naturalization and policy reactions
References
- The U.S. Department of Homeland Security reported 1.1 million immigrants and 36.2 million nonimmigrants in 2009, excluding Canadian and Mexican border crossers. There were 724,000 apprehensions in 2008, almost all along the Mexico-U.S. border.
- For a review of the debate, see http://migration.ucdavis.edu/mn/more.php?id=3433_0_2_0.
- According to the UN, immigrants make up 11 percent of France’s population and 11 percent in the United Kingdom, while they make up 21 percent of Canada’s population and 22 percent of Australia’s.
- These projections assume that net international migration will be 975,000 a year between 2010 and 2050 (www.census.gov/population/www/projections/2009cnmsSumTabs.html).
- James Smith and Barry Edmonston, eds., The New Americans: Economic, Demographic, and Fiscal Effects of Immigration (Washington, DC: National Academies Press, 1997).
- David Card, “The Impact of the Mariel Boatlift on the Miami Labor Market,” Industrial and Labor Relations Review 43, no. 2 (1990): 245-57.
- George Borjas, “The Labor Demand Curve Is Downward Sloping,” Quarterly Journal of Economics 118, no. 4 (2003): 1335-74.
- Giovanni Peri, “Economic Impacts of Migrants,” in Migration in the 21st Century: Rights, Outcomes, and Policy, ed. Kim Korinek and Thomas Maloney (New York: Routledge, 2010).
- Roger Lowenstein, “The Immigration Equation,” New York Times Magazine, July 9, 2006.
- However, immigrants cannot “save” Social Security unless their number rises each year. Social Security is a pay-as-you-go system, meaning that taxes paid by current workers support retirees. Immigrants earn benefits as they age, increasing the number of retirees who will receive Social Security benefits in the future.