Poverty and Inequality Pervasive in Two-Fifths of U.S. Counties
(November 2016) Over the past two decades, inequality and poverty have both become more pervasive in U.S. counties. Typically, experts treat poverty and inequality as separate indicators of an area’s economic health. But by looking at the intersection of poverty and inequality in local areas—and how this has changed over time—we can produce a more complete picture of U.S. economic health. The official poverty measure is used to identify families that may not have enough money to meet basic needs, while the Gini index measures inequality between households; higher values indicate higher levels of inequality.
The results of a recent Pew Research Center survey showed that the public is relatively unconcerned about high levels of inequality in the United States. In 2013, less than half of the U.S. public (47 percent) thought that the gap between the rich and poor was “a very big problem.”1 But economic data show that the divide in the United States between the haves and the have-nots is growing. In 2014, the Gini index reached its highest level since 1967 and remained essentially unchanged in 2015. And as PRB’s analysis shows, counties are often doubly disadvantaged—experiencing high levels of inequality in combination with high poverty rates.
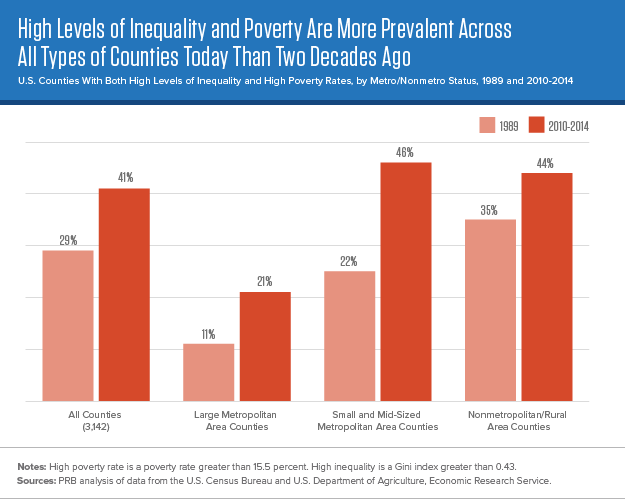
In 1989, only 29 percent all U.S. counties had high levels of inequality combined with high poverty rates.2 Among large metropolitan counties, 11 percent were high-inequality, high-poverty areas, compared with 22 percent of small and mid-sized metropolitan counties and 35 percent of nonmetropolitan counties (see figure)3
In the late 1980s, income inequality and poverty intersected primarily in rural counties in Appalachia, the Deep South, and the Southwest (see map). But over time, the combination of high inequality and high poverty has spread to new areas—particularly in the South.
By 2010-14, 41 percent of counties nationwide had high levels of inequality combined with high poverty rates—a 12 percentage-point increase since 1989. In large metropolitan areas, the share of high-inequality, high-poverty counties nearly doubled during this period, to 21 percent. And by 2010-14, 46 percent of counties in small and mid-sized cities were experiencing high levels of inequality combined with high poverty rates (a 24 percentage-point increase since 1989). Poverty and inequality also increased in rural areas, but at a slower pace compared to counties in metropolitan areas.
Today most of the remaining low-inequality, low-poverty counties are located in the upper Midwest, Mountain, Middle Atlantic, South Atlantic, and New England states.
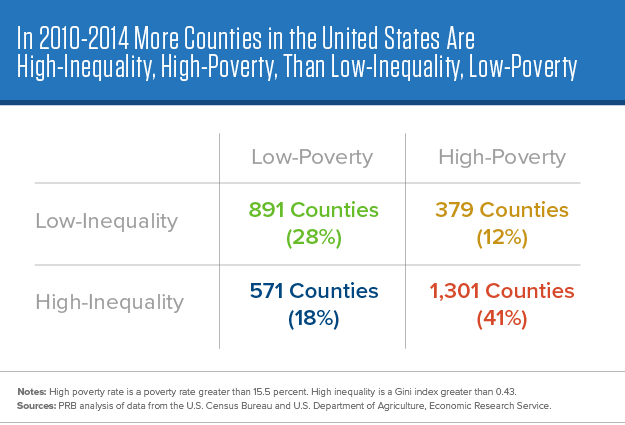
Of the 3,142 counties in the United States, 41 percent were high-inequality, high-poverty areas in 2010-14; 18 percent fell into the high-inequality, low-poverty category; 12 percent were low-inequality, high-poverty areas; and 28 percent were low-inequality, low-poverty areas (see table).
Counties that exemplify each of the four categories are described below.
Orleans Parish, Louisiana (High-Inequality, High-Poverty)
Orleans Parish, Louisiana is an example of a high-inequality, high-poverty county. Orleans Parish has a varied economy that includes the Port of New Orleans, several large company headquarters or regional offices, and a thriving (but relatively low-paying) convention and tourism sector. More than one in six workers in Orleans Parish works in the low-wage leisure sector.4 This mix of industries—some with relatively high wages and year-round work and some with relatively low wages and part-time or seasonal work—results in one of the highest rates of inequality in the country (Gini index 0.56).
Educational attainment in Orleans Parish is above the national average (36 percent of adults ages 25 and older have a bachelor’s degree or higher compared with 31 percent nationwide), but the homeownership rate is low (46 percent compared with a national average of 63 percent), and a whopping 15 percent of households have incomes below $10,000 per year.
Fairfield County, Connecticut (High-Inequality, Low-Poverty)
Inequality is most often discussed in the context of lower-income families, but income disparities also exist in more affluent communities, dividing middle-class and high-income families. An example of a high-inequality, low-poverty county is Fairfield County, Connecticut. Fairfield County is home to several Fortune 500 companies and is within the New York City commuting area. One-fifth of workers in Fairfield County are employed in either finance and insurance or professional, scientific, and technical services, both of which are high-wage sectors. However, some cities in the county have not recovered from historic losses of manufacturing jobs and 18 percent of workers in the county work in the relatively low-wage retail and leisure sectors. The adult population in Fairfield County has a higher level of education than the national average (46 percent of adults ages 25 and older have a bachelor’s degree or higher compared with 31 percent nationwide).
The number of high-inequality, low-poverty counties reached its peak in 1999 during a period of rapid economic expansion and relative economic prosperity. About 21 percent of counties were classified as high-inequality and low-poverty in 1999. By 2008-12, the share of high-inequality, low-poverty counties had dropped to 16 percent, but with the recent decline in the poverty rate, the share rose again to 18 percent by 2010-14. Many of these counties are located in high-cost metropolitan areas on the East and West Coasts, but there has also been a sharp increase in inequality in oil-rich North Dakota, where poverty rates remain relatively low.5
Clayton County, Georgia (Low-Inequality, High-Poverty)
In some counties poverty is widespread but the gap between higher-income and lower-income families is fairly narrow. An example of a low-inequality, high-poverty county is Clayton County, Georgia. Clayton County is home to Atlanta’s Hartsfield-Jackson International Airport. One-third of the county’s workforce is employed in low- to mid-paying retail, transportation and warehousing, and healthcare and social assistance sectors, while only 3 percent of the county’s workers are employed in the high-paying professional, scientific, and technical services sector. The county has an educational attainment level substantially below the national average (only 19 percent of adults ages 25 and older have a bachelor’s degree or higher compared with 31 percent nationwide).
Low-inequality, high-poverty areas made up 12 percent of counties in 2010-14. Counties of this type were almost nonexistent in 1999, but their numbers increased with the job losses associated with the Great Recession, especially in parts of Maine, Michigan, Missouri, and the Pacific Northwest. Also included in this group are many American Indian areas, such as Buffalo County, South Dakota, which has one of the highest poverty rates in the nation (34 percent in 2010-14).
Loudoun County, Virginia (Low-Inequality, Low-Poverty)
Loudoun County, Virginia is an example of a low-inequality, low-poverty county. Loudoun County is home to several Fortune 500 companies as well as the headquarters for the U.S. Department of Homeland Security. More than one-fifth of workers in the county are employed in the relatively high-paying professional, scientific, and technical services sector. Adult residents of the county also have considerably higher levels of educational attainment than the national average—60 percent of adults ages 25 and older have at least a bachelor’s degree, nearly twice the national average (31 percent).
The Challenge for Policymakers
Addressing these disparities is important to improve the lives of families who are struggling to pay their bills and to strengthen the U.S. economy. High levels of inequality have been linked to a greater likelihood of economic boom and bust cycles, deeper recessions, and a slowdown in overall economic growth.6 Evidence from the recent recession suggests that the United States is approaching, and may already have reached, a tipping point where inequality is limiting social mobility, consumer spending, educational attainment, and the ability of the United States to compete in the global labor market.7 Many discouraged workers have left the labor force, and young adults—especially those without college degrees—have a hard time finding secure, full-time work. It’s important to close these gaps to put the next generation of workers and their children on a path to succeed in the labor force and advance the U.S. economy.
1. Bruce Stokes, “The U.S.’s High Income Gap Is Met With Relatively Low Public Concern,” (Washington, DC: Pew Research Center), accessed at www.pewresearch.org/fact-tank/2013/12/06/the-u-s-s-high-income-gap-is-met-with-relatively-low-public-concern/, on Nov. 6, 2016.
2. In this analysis, counties are classified as “high-poverty” if they have poverty rates greater than 15.5 percent—the average poverty rate across all of the counties and years. “High-inequality” counties are those with Gini indices greater than 0.43 (the average Gini index across all counties and years). Data are from the Census Bureau’s 1990 and 2000 Decennial censuses and the 2010-2014 American Community Survey.
3. Counties are classified as urban or rural based on the U.S. Department of Agriculture, Economic Research Services Rural-Urban Continuum Codes (RUCC) (2013 edition). Large urban counties are those defined by RUCC as counties in metropolitan areas of 1,000,000 people or more, accessed at http://www.ers.usda.gov/data-products/rural-urban-continuum-codes/.aspx.
4. The term “leisure sector” refers to employment in arts, entertainment, recreation, accommodation (such as hotels), and food services.
5. Mark Mather and Beth Jarosz, “U.S. Energy Boom Fuels Population Growth in Many Rural Counties” (March 2014), accessed at www.prb.org/Publications/Articles/2014/us-oil-rich-counties.aspx, on Aug. 5, 2016.
6. Andrew G. Berg and Jonathan D. Ostry, “Inequality and Unsustainable Growth: Two Sides of the Same Coin?” accessed at www.imf.org/external/pubs/ft/sdn/2011/sdn1108.pdf, on Nov. 6, 2016.
7. Standard & Poor’s Financial Services LLC, “How Increasing Income Inequality Is Dampening U.S. Economic Growth, And Possible Ways To Change The Tide,” accessed at www.ncsl.org/Portals/1/Documents/forum/Forum_2014/Income_Inequality.pdf, on Nov. 2, 2016.
Related Posts
How Accurate Was the 2020 Census—and Why Should You Care?
Significant undercounts in the 2020 Census could have serious consequences for underrepresented groups and individual states.
The Nation’s Preexisting Condition: How Rising Inequality Exacerbated the Economic Toll of the Coronavirus
In 2019, many economic indicators seemed to be pointing in the right direction. The unemployment rate had fallen to its lowest level since 1969, the poverty rate fell to the lowest level in 60 years, and the Dow Jones Industrial Average reached an all-time high.

How Will We Measure the Accuracy of the 2020 Census?
Getting an accurate 2020 Census count is important because census numbers impact daily life in the United States in many ways.

Why Are They Asking That? What Everyone Needs to Know About 2020 Census Questions
By law, the U.S. government is required to count the number of people living in the United States every 10 years.