Understanding Population Projections: Assumptions Behind the Numbers
Policymakers and program planners rely on population projections to assess future demand for resources such as food, water, and energy, as well as services such as health and education. Projections alert policymakers and planners to major trends that may affect social and economic development and help them craft appropriate policies and programs.
Many governments periodically make population projections for their own countries. In addition, organizations like the United Nations Population Division (UNPD) and the U.S. Census Bureau regularly prepare population projections for the world, regions, and individual countries. To develop these projections, demographers must make assumptions about future trends related to fertility, mortality, and migration. These assumptions, though based on research and expert opinions, are not certain.
Population projections represent the future size of a population and the age and sex distribution if the assumptions used hold true. Many users of projections, however, may not be aware of exactly how they are made and do not consider the assumptions and limitations that underlie them. It is essential that users have a basic understanding of these assumptions and their plausibility before using them.
Uncertainty in projections can result from a variety of sources, such as in the estimate of a current population size that serves as the “starting” population for projections. Time also increases uncertainty: Projections over longer periods are less certain than short-term projections because of the compounding effects of inaccuracies in assumptions over time. This brief aims to improve understanding of population projections by highlighting some of the key assumptions on which they are based. The brief examines and discusses the population projections produced by UNPD (hereafter referred to as UN projections) as an example.1
Components of Population Projections
The population of a country or area grows or declines through the interaction of three demographic factors: fertility, mortality, and migration. To project future population, demographers make assumptions about how the current rates of births, deaths, and immigration and emigration will change in the future. Based on these assumptions, age- and sex-specific population increases or decreases over a future period are calculated and added to census results or an estimate of the population at the beginning of the period.
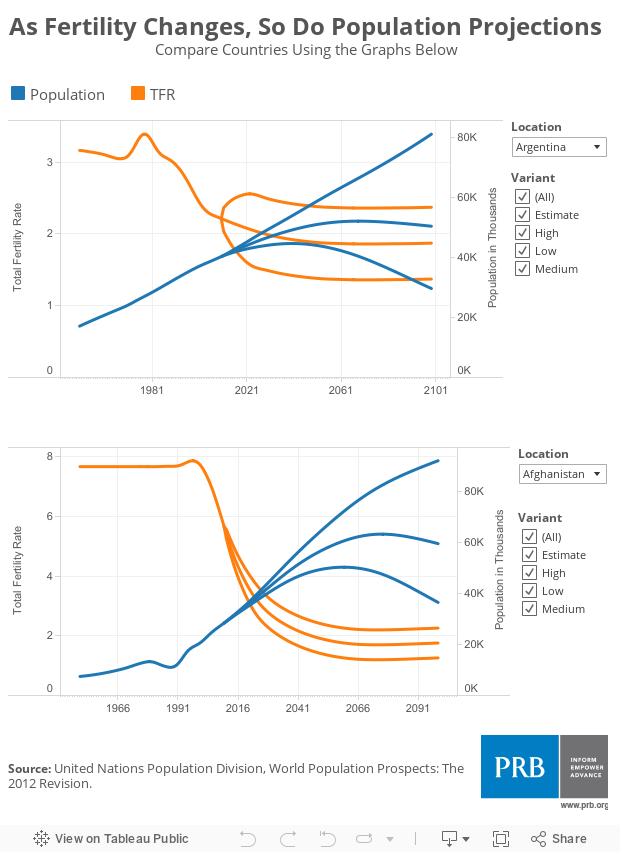
Each set of projections produced by an organization or government is based on its own set of assumptions about fertility, mortality, and migration, and will likely differ from each other. Some groups, most notably the UNPD, identify uncertainty in projections by showing estimates of the likelihood that the future population size will fall within a certain range. The UNPD and others also develop multiple projections to reflect several possible scenarios of future levels of fertility and mortality.
Fertility
Fertility is expressed as the total fertility rate (TFR), a measure of the number of children on average that a woman will have in her lifetime. (More specifically, the TFR is a measure of how many children women would bear in their lives if the rate of childbearing in a given year remained unchanged across their lives.) Of the three components, fertility often has the largest effect on future population size, especially in developing countries with high birth rates.
Globally, fertility fell during the latter half of the 20th century, and though it has not decreased at the same pace everywhere, today the world’s total fertility rate stands at 2.5 children per woman. Where fertility is high, demographers generally assume that fertility will follow a similar pattern of decline and eventually stabilize in every country at about two children per woman. This level of fertility is referred to as “replacement level” fertility (2.1 children per woman) as couples who have two children merely replace themselves without increasing the size of succeeding generations.
One common misunderstanding about population projections is that when fertility declines to replacement level, the population will immediately stop growing. In previously high-fertility countries, however, population will continue to grow for many decades even after fertility reaches replacement level. Years of high fertility result in a young population age structure, which generates momentum for future population growth as the increasing number of young people begin having children of their own. Brazil, for example, had fertility decline to below-replacement level in the mid-2000s, but the UNPD projects its population to continue growing until mid-century. Not only does fertility decline affect population size, it also profoundly affects age distribution. Declines in fertility result in a growing proportion of elderly, now seen in most developed and many developing countries.
In most developed countries, fertility is now below replacement level, often quite far below. The majority of developing countries, however, still have fertility above replacement level. In the least developed countries, women have on average more than four children. Additionally, fertility has remained high in most countries of sub-Saharan Africa, often declining slowly or not at all. As such, the fertility assumptions for this region tend to be less reliable. Future population size and age distribution for a country can vary substantially based on when a fertility decline begins, the pace of the decline, and whether the decline continues all the way to replacement fertility or stalls at a higher level.
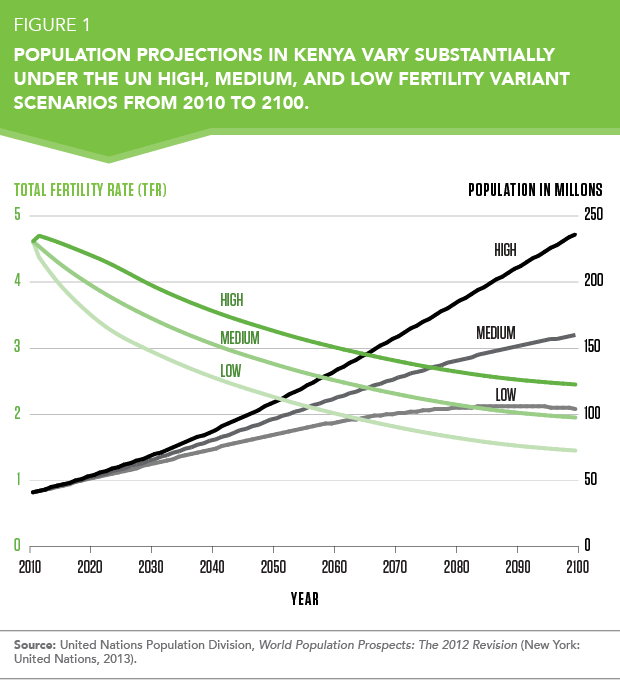
Because of the possible discrepancy between assumptions and actual trends, the UNPD publishes multiple projections every two years with differing fertility assumptions, including Low, Medium, and High Fertility variants. The Medium Variant, most often cited among the series, assumes a growth in the use of family planning that will result in reductions in fertility in patterns similar to what occurred in other countries. The Low Variant simply assumes that in each country the TFR is one-half child less than the Medium Variant at most periods in time, while the High Variant assumes that the TFR is one-half child more than the Medium Variant. Under these three variant scenarios, the assumed fertility in Kenya in 2050, for example, would range from 2.2 to 3.2 children per woman—down from 4.6 in 2010. Kenya’s population totals in 2050 corresponding to these different assumptions about fertility would range from 85 to 110 million (see Figure 1).
Another common misunderstanding is that a path of fertility decline is more or less automatic and is continuous, as projections assume. Declines in fertility, however, often depend on increased investments in family planning services, health, and education—particularly for women and girls. Many countries that have not adequately invested in these areas have not experienced the fertility declines assumed in past projections and have had subsequent projections continuously revised upward. Over one-half of the countries in the Africa region, for example, had their UN population estimates for 2010 revised upward between the 2010 and 2012 revisions, increasing the total population projected for the region under the Medium Variant scenario by 8.8 million. In other cases, countries that have invested adequately have seen fertility decline more rapidly than originally assumed and population projections have been revised downward.
Some users incorrectly assume that population levels stabilize in the final year for which a population is projected. For many years, the UNPD developed projections to the year 2050 and some users incorrectly interpreted the numbers to mean that world population growth under the Medium Variant would slow and stabilize in 2050. More recently the UNPD has developed population projections to 2100, and while the uncertainty in the underlying assumptions grows over time, population growth for the world and in many countries continues well beyond 2050. In fact, in all of the current population projections except the Low Variant, world population continues to grow past 2050.
Mortality
Mortality is incorporated into projections by estimating death rates by age group and sex. Where mortality is relatively high and the resulting life expectancy at birth relatively low, changes in mortality play an important role in future population size. Where mortality is already low and life expectancy has risen, mortality has much less effect. Throughout developing countries, infant mortality has declined substantially over the last several decades; the general assumption underlying population projections for all countries is a continued decline in death rates and an increase in life expectancy.
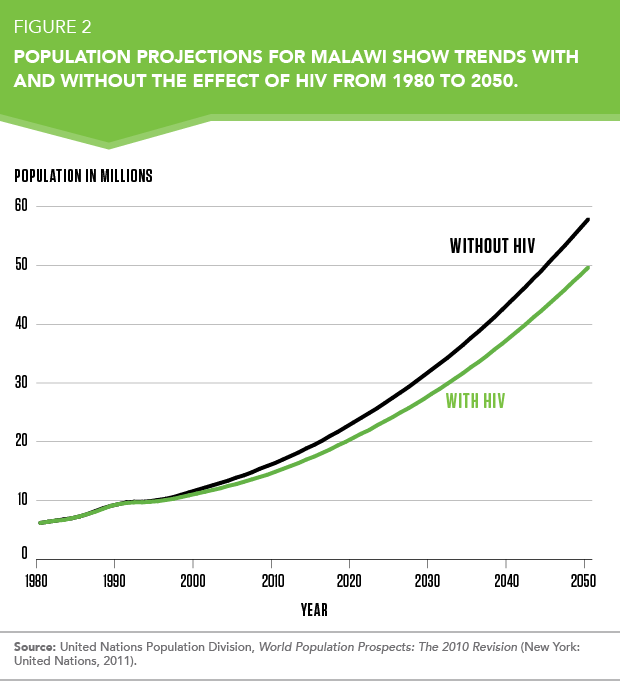
The HIV pandemic and its substantial impact on mortality in countries with high prevalence created the need to consider the future course of HIV infection and its treatment in mortality assumptions and population projections. In those countries with growing HIV epidemics during the 1990s, death rate assumptions were revised upward in population projections. Despite the rise in mortality, population growth continued, albeit at a slower rate due to the impact of HIV. Malawi’s population projection for 2050, for example, is 49.7 million, 8.2 million lower than the projection without the impact of HIV on mortality (see Figure 2). Recently, the UN projections show that life expectancies in the seriously affected countries of southern Africa are beginning to rise as a result of slowing the spread of HIV and improving the chances of survival among people living with HIV. Nonetheless, HIV will have a lasting impact on mortality for several decades: The extent to which HIV affects future mortality will depend on continued investments in both prevention and treatment of the disease. In fact, the UNPD assumes mortality from HIV will continue to decline due to improved access to antiretroviral therapy and fewer new infections.
For many developed countries, low fertility combined with declining mortality among older adults is of considerable interest because of the impact on population aging. For example, the UN projections for many developed countries show the proportion of the population ages 65 and over rising as high as 30 percent to 40 percent by mid-century, an unprecedented development. Over 90 countries are projected to have life expectancy at age 65 reach 20 years or more by mid-century.
Many people often wonder whether demographers incorporate other possible increases in mortality into projections, such as future conflict, natural disasters, or changing lifestyles like increases in obesity and lack of exercise. Because of the uncertainty about where conflict and natural disasters might occur, what the impacts might be, and how mortality rates might be affected, demographers do not incorporate such factors into projections. In the case of changing lifestyles, data on the impact on mortality are still largely unavailable or just emerging in most countries and are not yet included in projection assumptions. In general, demographers have not assumed other changes in mortality beyond declining infant mortality, the continued impact of HIV, and increased longevity.
Migration
International migration can be particularly unpredictable and difficult to incorporate into projection assumptions. Migration flows often result from short-term changes in economic, social, political, or environmental factors that are difficult to anticipate. Moreover, for many countries, reliable information on the number of immigrants and emigrants is not available.
Nonetheless, migration can have a significant effect on population change in specific countries and regions. For many years, the most common pattern of migration has been the movement of people from developing countries to developed countries and from poorer developed countries to wealthier ones. Populations of countries and regions with low fertility, where deaths exceed births, will decline without net migration gains. For example, international migration accounted for over one-half of the population growth in developed countries in the 2000s. The movement of people between developing countries because of economic opportunities, environmental disasters, or political or civil unrest has also altered the demographic landscape.
Migration assumptions often take into account the experience of countries with historically high immigration, such as the United States. Given its unpredictable nature, however, it is usually assumed that current migration levels will persist for a time and slowly decline. For example, the UNPD assumes that the current estimated annual flow of about 2.6 million people from less developed countries to more developed countries will slowly decrease to about 2.1 million by 2050. But national policies on immigration and the future economic appeal of developed countries could certainly change that figure in either direction. UNPD assumes net migration will eventually reach zero by 2100 in all countries. This highly unlikely scenario suggests how difficult it is to predict the levels of migration over such a long period.
How Can Decisionmakers and Program Planners Best Use Projections?
The accuracy of population projections depends primarily on the accuracy of the underlying assumptions. Demographers attempt to make the best assumptions possible based on the existing evidence and revise them as new information becomes available through various sources, such as national censuses, vital registrations, immigration statistics, and demographic surveys. Therefore, it is critical that policymakers and planners understand the assumptions behind different projection series. Understanding the causes of uncertainty in population projections and their implications for plans and policies that span different time horizons is essential
for successful planning.
It is also important that users reject the common misunderstandings about population projections, and instead understand that:
- Countries do not immediately stop growing when fertility reaches replacement level.
- Fertility does not decline automatically, as assumed in projections, without investments in areas such as family planning, health, and education of women and girls.
- Population levels do not necessarily stabilize in the final year for which a population is projected.
Correctly understanding these critical points allows policymakers and planners to have a more realistic assessment of the impact of future population growth.
At the same time, policymakers and planners can contribute to improving the accuracy of population projections by supporting national and international efforts to collect more accurate demographic data that would lead to more accurate assumptions, ultimately improving projections and increasing their value for policy and planning purposes.
- United Nations, Department of Economic and Social Affairs, Population Division, World Population Prospects: The 2012 Revision, Volume I: Comprehensive Tables (New York: United Nations, 2013).
Related Posts
Research Identifies New Strategies to Reduce Undercount of Young Children in U.S. 2020 Census
PRB identifies factors predicting where children under age 5 are more likely to be missed in the 2020 Census and develops a new undercount risk measure for young children.

Lesson Plans on Human Population and Demographic Studies
Find out the answers to these questions and more. The sections listed below explore eight elements of population dynamics.

Health Sector Reform: How It Affects Reproductive Health
(June 2003) Many less developed countries are reforming their health systems in an effort to achieve public health goals more affordably and effectively.
Report. Health Sector Reform: How It Affects Reproductive Health
This report also in French and Spanish. (June 2003) Many less developed countries are reforming their health systems in an effort to achieve public health goals more affordably and effectively.