What's Driving the Decline in U.S. Population Growth?
Between 2010 and 2011, the U.S. population increased by 0.7 percent, after averaging 0.9 percent growth each year from 2000 through 2010.1 The United States added just 2.3 million people from 2010 to 2011, compared with 2.9 million from 2005 to 2006, just five years earlier. The decline in U.S. population growth is likely due to a confluence of factors: lower levels of immigration, population aging, and declining fertility rates.
A drop in net immigration to the United States is a key factor in the country’s declining population growth rate. Around the turn of the millennium, the Census Bureau was estimating net international migration at about 1.4 million per year. By late in the decade, that annual number had been adjusted downward to less than 900,000. Between 2010 and 2011, net migration was estimated at around 700,000. The drop in immigration levels means that a smaller share of U.S. population growth is directly attributable to immigration, as opposed to natural increase (the excess of births over deaths). In the early 2000s, immigration accounted for roughly 40 percent of U.S. population growth, leaving 60 percent from natural increase.2 During the past few years, however, net international migration is estimated to have accounted for only 30 percent of the annual population growth.
The decline in immigration has been linked to job losses in construction, manufacturing, and other occupations that are often filled by recent immigrants, as well as stricter enforcement of immigration laws. Net immigration levels from Mexico are estimated to have reached zero in recent years as an equal number of people entering the United States from Mexico are now returning to their home country.3
Slower Latino and Asian Population Growth
Because most immigrants to the United States arrive from Latin America or Asia, the decline in net international immigration has contributed to slower growth in the Latino and Asian American populations. Latinos and Asians remain the country’s two fastest-growing minority groups, but their growth rates have dropped below the peaks reported just a few years ago.
Population growth for Latinos averaged 3.6 percent per year during the previous decade, but fell to just 2.5 percent between 2010 and 2011 (see Figure 1). There was a similar drop for Asian Americans during the same period, from 3.6 percent to 2.2 percent.4 Although the rate of change fell for both groups, the number of Asians and Latinos is still increasing. And both groups are still growing faster than African Americans (1 percent) and non-Hispanic whites (0.1 percent).
Percent Annual Change in U.S. Population, by Racial/Ethnic Group
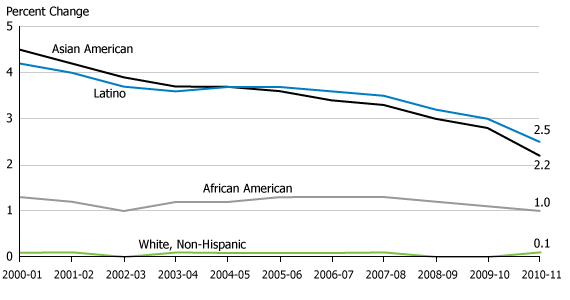
Source: U.S. Census Bureau, population estimates.
Population Aging
The recent decline in immigration has also accelerated population aging in the United States. Most immigrants are working-age adults, and many start families after they arrive in the U.S., creating an immigrant youth bulge.5 Less immigration therefore reduces the potential number of young people in the population. But even if immigrant levels had held steady during the recession, the U.S. population would still be growing older as the large cohort of baby boomers starts to reach retirement age.
A decade ago, children under age 18 made up a significant component of annual population growth and exceeded the growth of those ages 65 and older (see Figure 2). But by 2011, these patterns had reversed: The number of people under age 18 declined by 190,000 between 2010 and 2011, while the number of elderly increased by 917,000. Growth in the number of working-age adults, including those in prime childbearing ages, is also down sharply.
Annual Change in U.S. Population, by Age Group
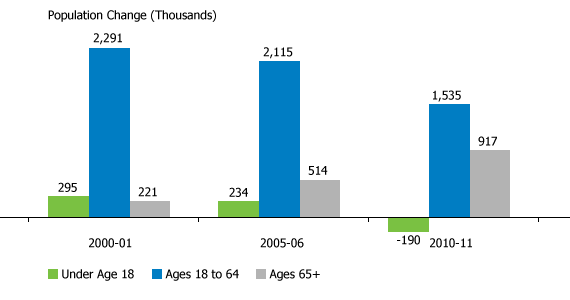
Source: U.S. Census Bureau, population estimates.
Because of its relatively young age structure, the United States still has a great deal of population momentum compared to many other developed countries.6 But as more baby boomers enter retirement and there are fewer people of reproductive age, we could see further declines in the number of births, and the age structure of the United States could start to resemble that of Europe.
Declining Fertility Rates
U.S. fertility rates have also declined in recent years, reducing levels of natural increase in the population. There were an estimated 4 million births between 2010 and 2011, down from 4.2 million at the recent peak of U.S. population growth between 2005 and 2006. The total fertility rate (TFR) stood at 2.0 births per woman in 2009—down from 2.1 a few years ago—but preliminary data from the National Center for Health Statistics (NCHS) suggest that the TFR could drop below 2 births per woman in 2010.
Latinos currently account for more than one-fourth of all births in the United States. Yet the Latina general fertility rate (births per 1,000 Latinas ages 15 to 44) dropped from 102 in 2007 to 80 in 2010, according to preliminary NCHS estimates. This represents a significant decline for a group with historically high fertility rates—approaching 3 births per woman just a few years ago. If current trends continue, the Latina TFR could drop below 2.5 in the near future.
The U.S. population is currently projected to reach “majority minority” status (the point at which less than 50 percent of the population is non-Hispanic white) in 2042. However, a sustained drop in immigration levels and fertility rates would slow the pace of minority population growth. It’s too soon to tell whether these are short-term trends resulting from the U.S. economic downturn, or whether they will continue in the future. But either way, these current trends represent a significant departure from developments over the past decade.
References
- Population estimates are from the U.S. Census Bureau and are reported as of July 1 of each year.
- Mary M. Kent and Mark Mather, “What Drives U.S. Population Growth?” Population Bulletin 57, no. 4 (2002), accessed on May 17, 2012.
- Jeffrey Passel, D’Vera Cohn, and Ana Gonzalez-Barrera, “Net Migration from Mexico Falls to Zero—and Perhaps Less” (May 3, 2012), accessed on May 17, 2012.
- Data are shown for the Asian alone population.
- Mark Mather, “Children in Immigrant Families Chart New Path,” PRB Reports on America (Washington, DC: Population Reference Bureau, 2009), accessed on May 17, 2012.
- Mark Mather, Kelvin Pollard, and Linda A. Jacobsen, “First Results from the 2010 Census,” PRB Reports on America (Washington DC: Population Reference Bureau, 2011), accessed on May 17, 2012.
Related Posts
Family Planning and the Gendered Impacts of Crises on Women: An Effective Tool Across Sectors to Support Women’s Empowerment and Build Resilience to Shocks
Holistic integrated solutions are key to address the interlinkages of the gendered impacts of crises.

Research Identifies New Strategies to Reduce Undercount of Young Children in U.S. 2020 Census
PRB identifies factors predicting where children under age 5 are more likely to be missed in the 2020 Census and develops a new undercount risk measure for young children.

Lesson Plans on Human Population and Demographic Studies
Find out the answers to these questions and more. The sections listed below explore eight elements of population dynamics.

Health Sector Reform: How It Affects Reproductive Health
(June 2003) Many less developed countries are reforming their health systems in an effort to achieve public health goals more affordably and effectively.
Report. Health Sector Reform: How It Affects Reproductive Health
This report also in French and Spanish. (June 2003) Many less developed countries are reforming their health systems in an effort to achieve public health goals more affordably and effectively.