Paola Scommegna
Contributing Senior Writer

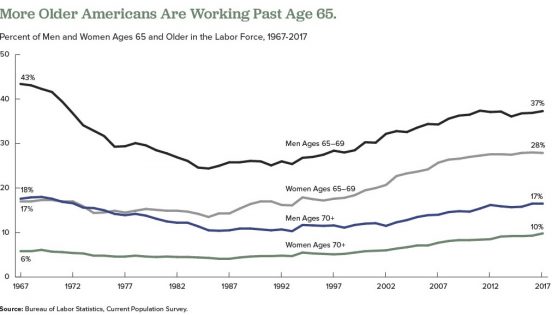
A growing share of Americans are working beyond their 65th birthday, a reversal that began in the mid-1980s. Labor force participation rates for men ages 65 to 69 began to drop in the mid-1960s, bottoming out at 24 percent in 1985, but have risen to about 37 percent in 2017. Among women ages 65 to 69, the labor force participation rate increased from 18 percent in 1964 to 28 percent in 2017.
Researchers have identified a variety of factors influencing older people’s decisions to postpone retirement over the past 25 years, including the following:
But researchers disagree on whether the upswing in the share of employed older people will continue as more members of the baby boom generation reach traditional retirement ages.
Some analysts argue that most of the factors listed above have played themselves out. Alice Munnell of Boston College points out that defined-benefit pensions and employer-provided retirement health insurance are almost entirely absent from the private sector; educational attainment has plateaued among the those now approaching retirement age; gains in health and longevity related to declines in smoking and improved medical care are being offset by increases in obesity; and blue-collar jobs have been rare for a generation.2
But other researchers argue that high levels of debt remain a powerful force that may contribute to more people postponing retirement. Annamaria Lusardi of George Washington University, Olivia Mitchell of University of Pennsylvania, and Noemi Oggero of the University of Turin find a “dramatic increase” in the amount of debt carried by older Americans nearing retirement ages, mainly the result of “having purchased more expensive homes with smaller down payments than previous generations.”3
They use data from the nationally representative Health and Retirement Study (HRS), an ongoing survey of older Americans, and the National Financial Capability Study (NFCS), a national sample of adults surveyed on financial planning and decisionmaking. Their analysis focuses on the debt of Americans ages 56 to 61 in 1992, 2004, and 2010.
They show that the median debt-to-income ratio (the percentage of income that goes to debt payments) climbed from 14 percent in 1992 to 45 percent in 2004, and to 50 percent in 2010. The median amount of debt rose sharply between 1992 and 2004, from $6,800 to $31,200 in 2015 dollars.
Their findings also indicate that older adults ages 62 to 66 in 2010 carried more debt than their counterparts from earlier years, though they carried less debt than adults ages 56 to 61 in 2010. “While people’s financial situation does seem to improve with age, the older group is still financially distressed,” they write. “Close to half (47 percent) of those ages 62 to 66 are worried about running out of money in retirement and just over half (55 percent) had planned for it [their retirement].”
In another study using HRS and NFCS data, Lusardi and Mitchell find that women in their 50s and 60s in recent generations are more likely to say they plan to work to older ages than their peers from the early 1990s.4 Respondents with plans to delay retirement tend to have higher levels of education, higher divorce rates, and fewer children, but “household finances also play a key role” in retirement decisions, they report. “Older women today have more debt than previously and are more financially fragile than in the past,” they write.
1 U.S. Bureau of Labor Statistics, “Table 2. Employed Full- and Part-Time Workers by Disability Status and Age, 2016 Annual Averages,” last modified June 21, 2017, accessed at www.bls.gov/news.release/disabl.t02.htm, on Feb. 14, 2018.
2 Alicia Munnell, “The Average Retirement Age—An Update,” Center for Retirement Research, Boston College, No. 15-4 (March 2015).
3 Annamaria Lusardi, Olivia S. Mitchell, and Noemi Oggero, “Debt and Financial Vulnerability on the Verge of Retirement,” National Bureau of Economic Research Working Paper No.23664 (Aug. 2017).
4 Annamaria Lusardi and Olivia S. Mitchell, “Older Women’s Labor Market Attachment, Retirement Planning, and Household Debt,” National Bureau of Economic Research Working Paper No. 22606 (Sept. 2016).
 ">
">