497 Search Results Found For : "Low-priced"


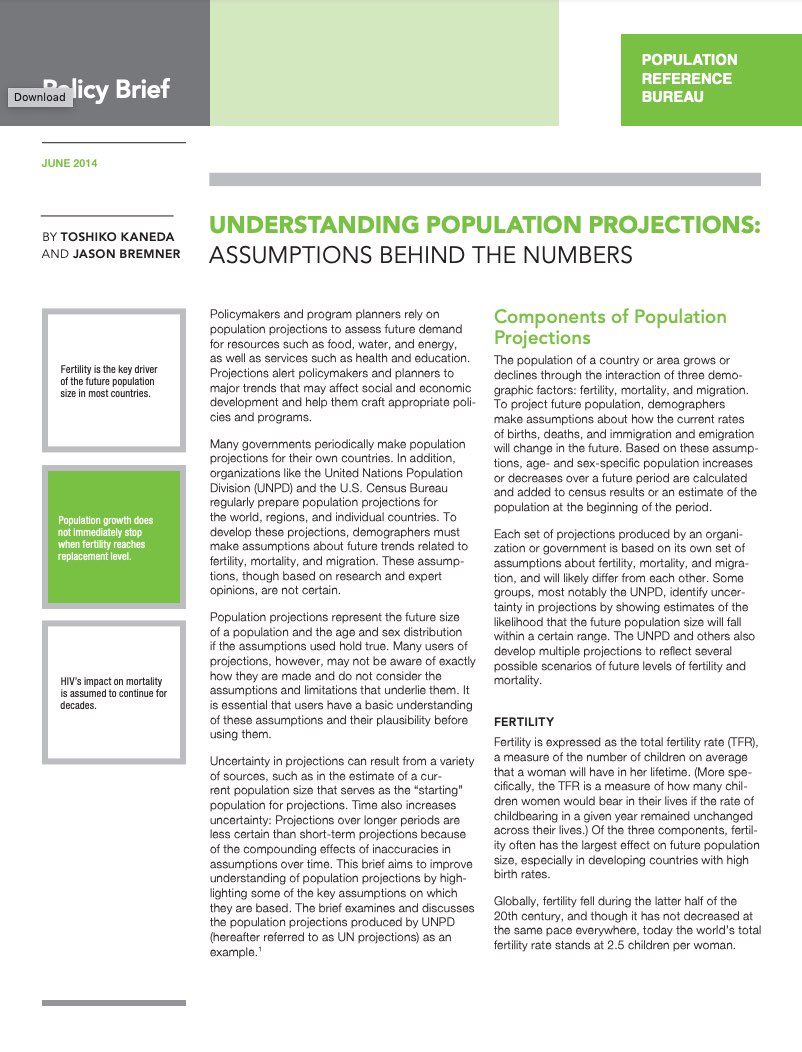
Policy Brief. Understanding Population Projections: Assumptions Behind the Numbers (2014)

Policymakers and program planners rely on population projections to assess future demand for resources such as food, water, and energy, as well as services such as health and education.

View Details Array ( [ID] => 15551 [id] => 15551 [title] => understanding-population-projections-2014 [filename] => understanding-population-projections-2014.pdf [filesize] => 599322 [url] => https://www.prb.org/wp-content/uploads/2014/07/understanding-population-projections-2014.pdf [link] => https://www.prb.org/resources/understanding-population-projections-assumptions-behind-the-numbers/understanding-population-projections-2014-2/ [alt] => [author] => 15 [description] => [caption] => [name] => understanding-population-projections-2014-2 [status] => inherit [uploaded_to] => 5136 [date] => 2021-02-01 20:02:53 [modified] => 2021-02-01 20:02:53 [menu_order] => 0 [mime_type] => application/pdf [type] => application [subtype] => pdf [icon] => https://www.prb.org/wp-includes/images/media/document.png ) Download (0.6 MB)

Digital and Economic Divides Put U.S. Children at Greater Educational Risk During the COVID-19 Pandemic

(2020) With the number of coronavirus infections surging, school districts across the United States are grappling with decisions about whether and how to re-open this fall.

View Details

HIV/AIDS and African Americans: A State of Emergency

(2005) More African Americans are living with HIV or already dead from AIDS than any other single racial or ethnic group in the United States—a crisis one black AIDS activist calls "a state of emergency" for the African American community.

View Details

More Than Shelter: How Housing Affordability Is Linked to Older Americans’ Health

Older adults’ housing challenges reflect social and financial inequalities and can lead to poor health.

View Details

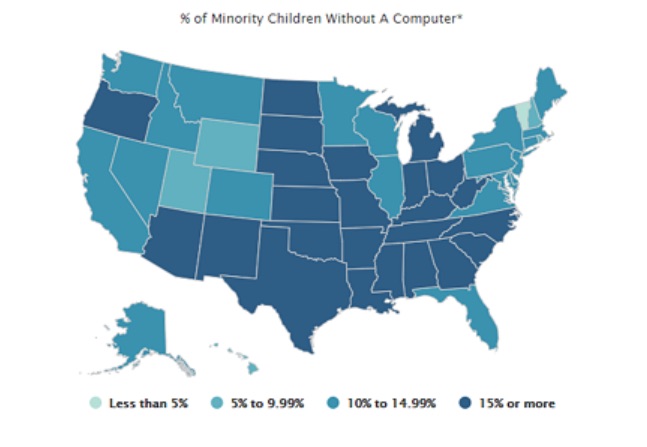
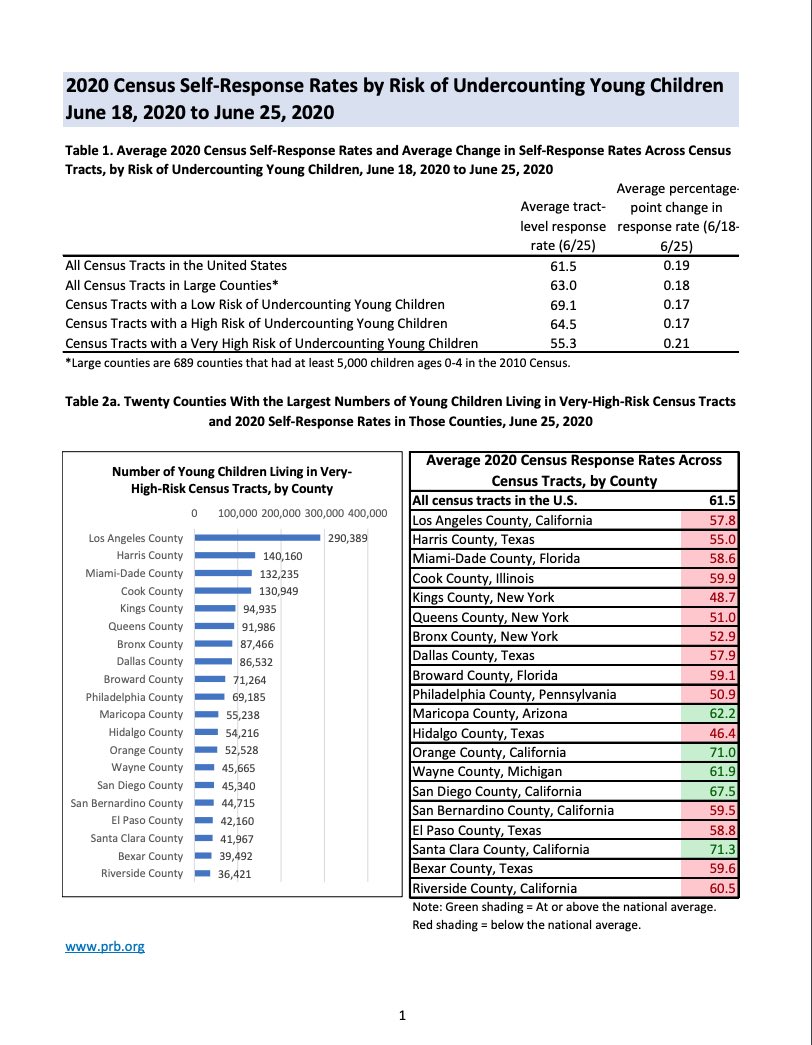
Tables. 2020 Census Self-Response Rates By Risk of Undercounting Young Children, June 18-25, 2020

Self-response rates are lowest in neighborhoods with high concentrations of racial and ethnic minorities in the young child population, which could mean fewer dollars for communities that need funds the most.

View Details Array ( [ID] => 1299 [id] => 1299 [title] => prb-response-rate-summary-jun25 [filename] => prb-response-rate-summary-jun25.pdf [filesize] => 218851 [url] => https://www.prb.org/wp-content/uploads/2020/06/prb-response-rate-summary-jun25.pdf [link] => https://www.prb.org/resources/2020-census-self-response-rates-are-lagging-in-neighborhoods-at-risk-of-undercounting-young-children/prb-response-rate-summary-jun25/ [alt] => [author] => 15 [description] => [caption] => 2020 Census Self-Response Rates by Risk of Undercounting Young Children June 18, 2020 to June 25, 2020 analysis by PRB. [name] => prb-response-rate-summary-jun25 [status] => inherit [uploaded_to] => 1295 [date] => 2020-10-05 12:59:41 [modified] => 2020-10-05 13:00:58 [menu_order] => 0 [mime_type] => application/pdf [type] => application [subtype] => pdf [icon] => https://www.prb.org/wp-includes/images/media/document.png ) Download (0.2 MB)

2020 Census Self-Response Rates Are Lagging in Neighborhoods at Risk of Undercounting Young Children

Self-response rates are lowest in neighborhoods with high concentrations of racial and ethnic minorities in the young child population, which could mean fewer dollars for communities that need funds the most.

View Details Array ( [ID] => 1299 [id] => 1299 [title] => prb-response-rate-summary-jun25 [filename] => prb-response-rate-summary-jun25.pdf [filesize] => 218851 [url] => https://www.prb.org/wp-content/uploads/2020/06/prb-response-rate-summary-jun25.pdf [link] => https://www.prb.org/resources/2020-census-self-response-rates-are-lagging-in-neighborhoods-at-risk-of-undercounting-young-children/prb-response-rate-summary-jun25/ [alt] => [author] => 15 [description] => [caption] => 2020 Census Self-Response Rates by Risk of Undercounting Young Children June 18, 2020 to June 25, 2020 analysis by PRB. [name] => prb-response-rate-summary-jun25 [status] => inherit [uploaded_to] => 1295 [date] => 2020-10-05 12:59:41 [modified] => 2020-10-05 13:00:58 [menu_order] => 0 [mime_type] => application/pdf [type] => application [subtype] => pdf [icon] => https://www.prb.org/wp-includes/images/media/document.png ) Download (0.2 MB)

Understanding Population Projections: Assumptions Behind the Numbers

View Details Array ( [ID] => 15551 [id] => 15551 [title] => understanding-population-projections-2014 [filename] => understanding-population-projections-2014.pdf [filesize] => 599322 [url] => https://www.prb.org/wp-content/uploads/2014/07/understanding-population-projections-2014.pdf [link] => https://www.prb.org/resources/understanding-population-projections-assumptions-behind-the-numbers/understanding-population-projections-2014-2/ [alt] => [author] => 15 [description] => [caption] => [name] => understanding-population-projections-2014-2 [status] => inherit [uploaded_to] => 5136 [date] => 2021-02-01 20:02:53 [modified] => 2021-02-01 20:02:53 [menu_order] => 0 [mime_type] => application/pdf [type] => application [subtype] => pdf [icon] => https://www.prb.org/wp-includes/images/media/document.png ) Download (0.6 MB)