534 Search Results Found For : "climate change"


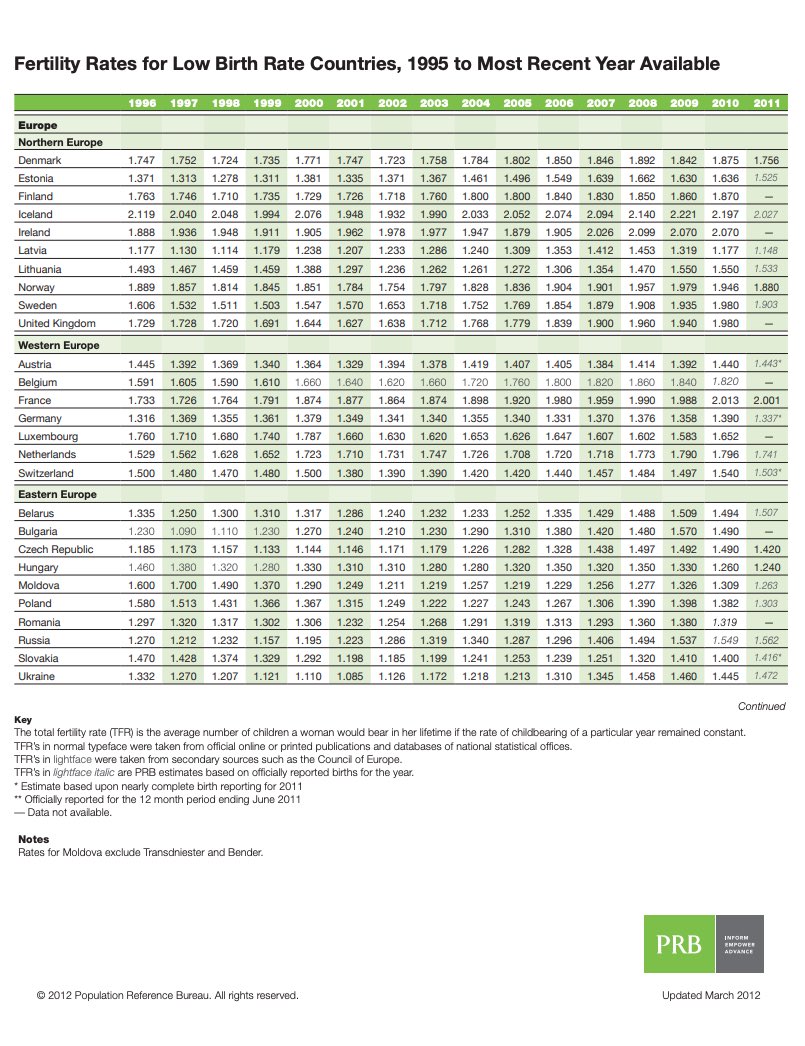
Tables: Fertility Rates in Low Birth-Rate Countries, 1996-2011

View Details Array ( [ID] => 15050 [id] => 15050 [title] => TFR_Table2012_update-1 [filename] => TFR_Table2012_update-1.pdf [filesize] => 203348 [url] => https://www.prb.org/wp-content/uploads/2021/01/TFR_Table2012_update-1.pdf [link] => https://www.prb.org/resources/fertility-rates-in-low-birth-rate-countries-1996-2011/tfr_table2012_update-1-2/ [alt] => [author] => 15 [description] => [caption] => [name] => tfr_table2012_update-1-2 [status] => inherit [uploaded_to] => 15048 [date] => 2021-01-30 23:44:30 [modified] => 2021-01-30 23:44:30 [menu_order] => 0 [mime_type] => application/pdf [type] => application [subtype] => pdf [icon] => https://www.prb.org/wp-includes/images/media/document.png ) Download (0.2 MB)

How Many People in the United States Are Experiencing Homelessness?

(2020) The economic effects of the coronavirus pandemic in the United States include an unemployment rate higher than at any time in the country’s history—including the Great Depression. As an unprecedented number of Americans struggle with job loss, many of them may lose their homes. Many others may lose their homes due to natural disasters or other crises.

View Details

International Migration Transforms Australia

(2001) Immigration since World War II has transformed Australian society and population. Many residents of Australia are immigrants or are the children of immigrants.

View Details

Who Are America’s Immigrants?

A century beyond the country’s strictest immigration law, here’s what the data tell us about who’s coming to the United States

View Details

Q&A With Kyler Sherman-Wilkins

PRB spoke with him about his goals for the program and future implications for the study of demography.

View Details

What’s Driving the Decline in U.S. Population Growth?

(2012) Between 2010 and 2011, the U.S. population increased by 0.7 percent, after averaging 0.9 percent growth each year from 2000 through 2010.1 The United States added just 2.3 million people from 2010 to 2011, compared with 2.9 million from 2005 to 2006, just five years earlier.

View Details

Transitions in World Population

(2004)World population was transformed in the 20th century as technological and social changes brought steep declines in birth rates and death rates around the world. The century began with 1.6 billion people and ended with 6.1 billion, mainly because of unprecedented growth after 1960.

View Details

Proposed Changes in Immigration Policy Put Children at Risk of Losing Health Insurance

(2018) Many children may lose public health insurance and nutrition assistance benefits under proposed changes to U.S. immigration policy.

View Details

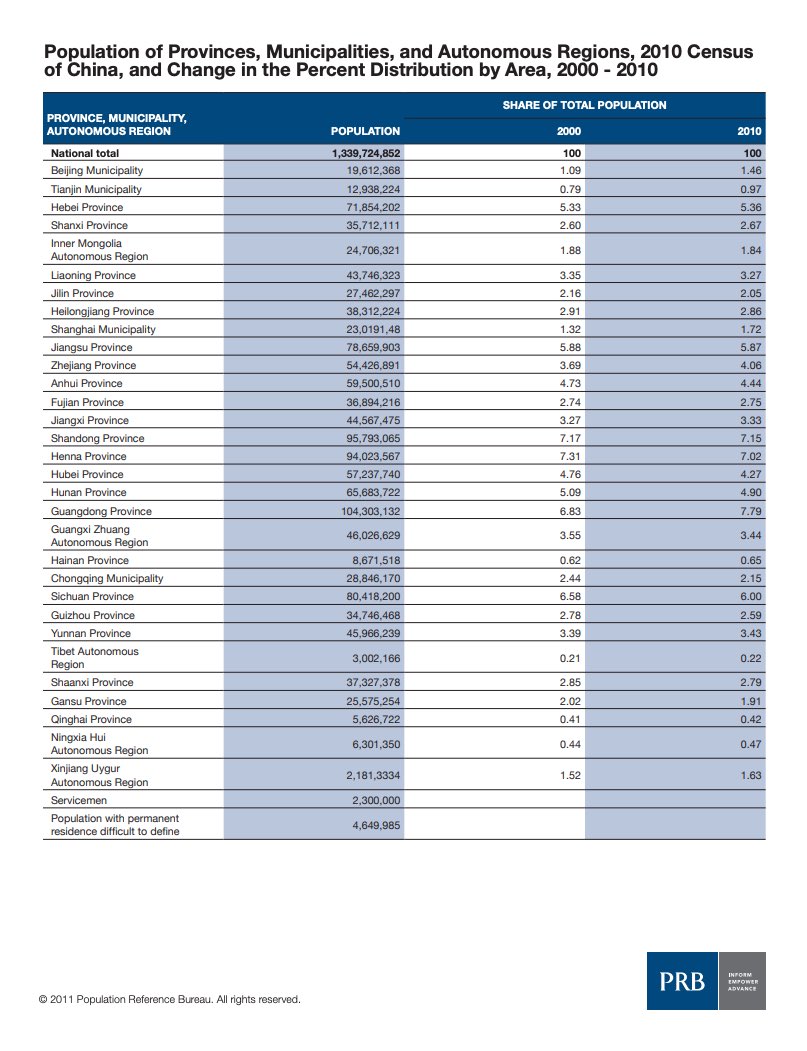
China Releases First 2010 Census Results

(2011) China, the world's only other "demographic billionaire," along with India, released the results of its Nov. 1, 2010 Census on April 28.

View Details Array ( [ID] => 13696 [id] => 13696 [title] => china-2010-census-results-table [filename] => china-2010-census-results-table.pdf [filesize] => 113780 [url] => https://www.prb.org/wp-content/uploads/2011/05/china-2010-census-results-table.pdf [link] => https://www.prb.org/resources/china-2010-census-results/china-2010-census-results-table-2/ [alt] => [author] => 15 [description] => [caption] => [name] => china-2010-census-results-table-2 [status] => inherit [uploaded_to] => 5361 [date] => 2021-01-24 19:26:36 [modified] => 2021-01-24 19:26:36 [menu_order] => 0 [mime_type] => application/pdf [type] => application [subtype] => pdf [icon] => https://www.prb.org/wp-includes/images/media/document.png ) Download (0.1 MB)