2020 World Population Data Sheet Lesson Plan Slidedeck (PPT)
(2020) PRB’s World Population Data Sheet is an excellent reference and data analysis tool. This series of short activities allows students to access a wealth of data on the world, regions, and individual countries, and develop their data literacy skills and knowledge of geography.
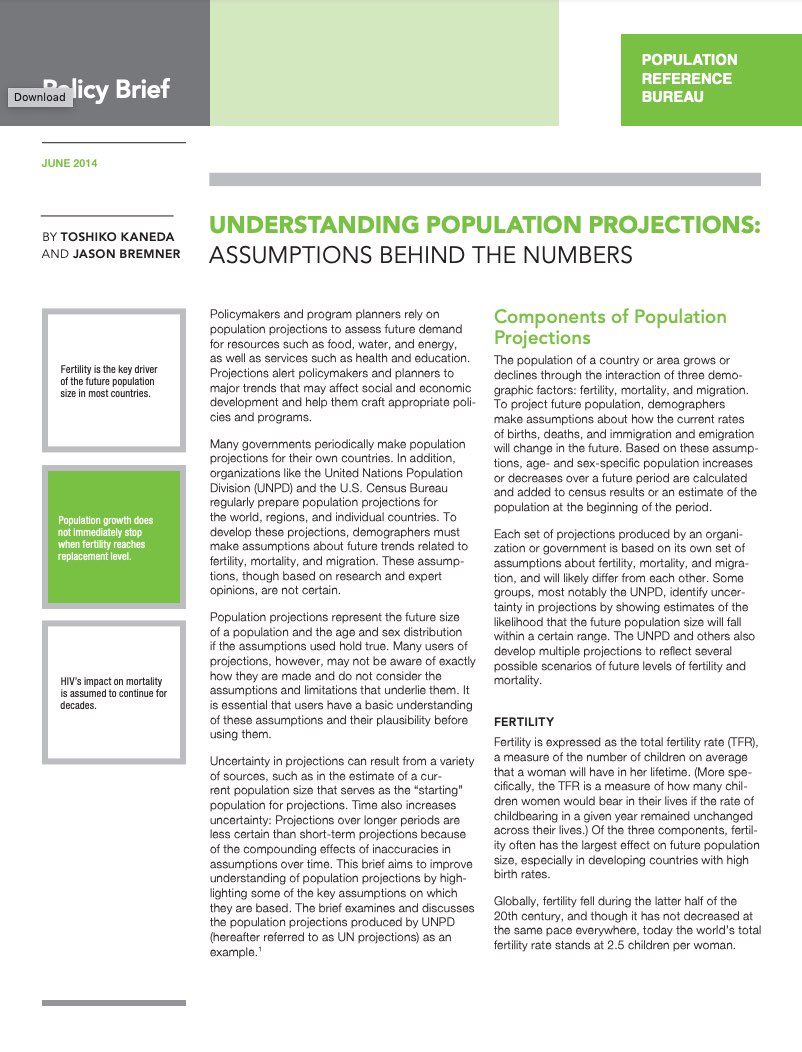
Policy Brief. Understanding Population Projections: Assumptions Behind the Numbers (2014)
Policymakers and program planners rely on population projections to assess future demand for resources such as food, water, and energy, as well as services such as health and education.
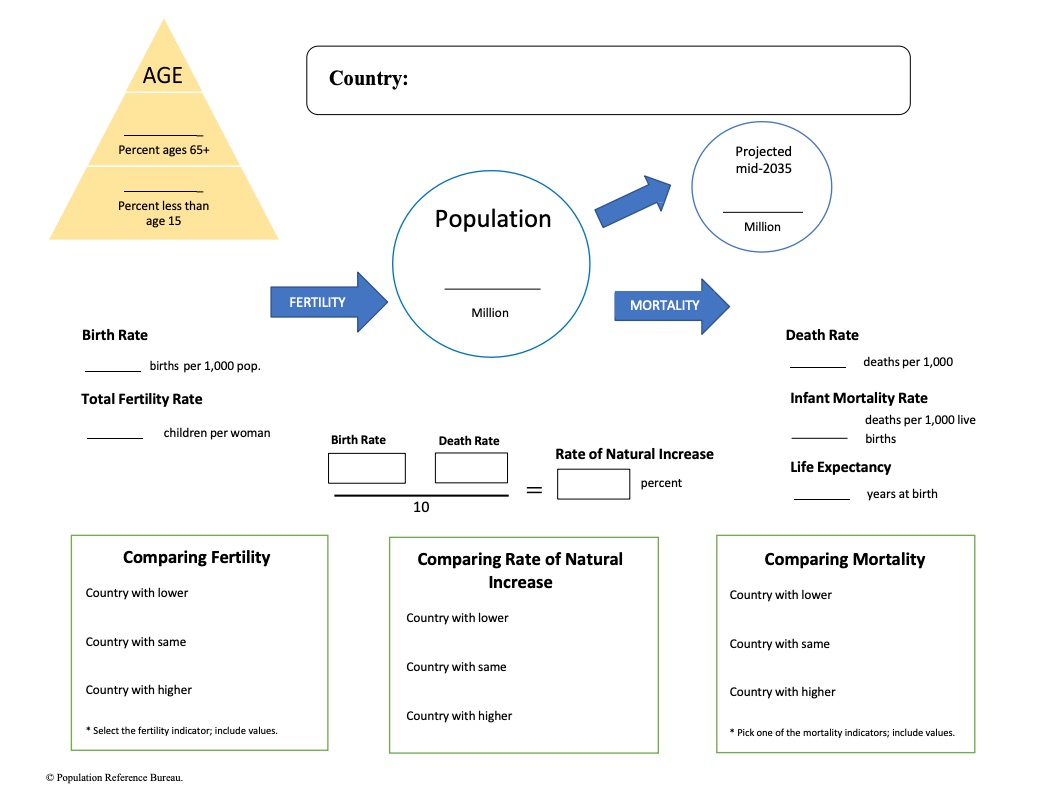
Lesson Plan. 2020 World Population Data Sheet (PDF)
(2020) PRB’s World Population Data Sheet is an excellent reference and data analysis tool. This series of short activities allows students to access a wealth of data on the world, regions, and individual countries, and develop their data literacy skills and knowledge of geography.
(2011) Increasing disaster threats not only reflect the onset of events such as earthquakes or floods, but also the changing demographic and socioeconomic characteristics of the population.
(2008) Hardly a day has gone by over the past few months without a national poll tracking how this year's U.S. presidential race is going. However, the U.S. presidential election actually is a series of 51 contests (50 states and the District of Columbia).
(2020) PRB’s World Population Data Sheet is an excellent reference and data analysis tool. This series of short activities allows students to access a wealth of data on the world, regions, and individual countries, and develop their data literacy skills and knowledge of geography.
(2014) The U.S. baby-boom generation – those born between 1946 and 1964 – is the largest generation in American history and a major force in the country’s demographic future.
(2010) In 1970, then-President Ferdinand Marcos launched the Philippines' first National Population Program to improve access to family planning to lower fertility and slow population growth. Fertility has declined since then, although the level is still high compared with other countries in Southeast Asia.