
 ">
">
This article is taken from the Population Bulletin: The World At 7 Billion, which looks at the four phases of the demographic transition as descriptive of past and future population growth. Four countries are highlighted to illustrate each phase and its implications for human well-being.
Germany’s recovery from the devastation of World War II is often called an “economic miracle” because its economy is now Europe’s largest. Immigration has been an important part of the country’s modern demographic history.
Labor shortages led to a guest-worker program, which began bringing workers to West Germany from countries such as Greece, Italy, Spain, Turkey, and Yugoslavia in the late 1950s. Rather than return to their homelands, however, many of these workers brought their families to Germany. From 1960 to the early 1980s, net immigration averaged several hundred thousand per year, peaking at more than 500,000 in 1969 and 1970. Following Germany’s reunification in 1990, a new flow of migrants arrived: ethnic Germans who had been trapped behind the Iron Curtain. In 1992, net immigration neared 800,000. There was concern at the time that some of these migrants were not true ethnic Germans, but were economic migrants seeking a better life in the West. At the end of 2009, 19 percent of Germany’s population had what the German Federal Statistical Office calls a “migrant” background, which includes immigrants since 1950 and their offspring.
Germany is a dramatic example of the fourth phase of demographic transition: Countries with low or very low birth and death rates represent almost half, or 46 percent, of the world’s population.
Overview
Germany’s population stands at an estimated 81.8 million in mid-2011, the largest country in the European Union by a good margin. But that total is down from 82.3 million at the end of 2006. Germany’s principal demographic concerns today are its very low birth rate and the lack of social and cultural integration of its migrant population. Recently, Chancellor Angela Merkel stated that integration was “not working.”
Figure 1
Total Fertility Rate in Germany, 1955-2010
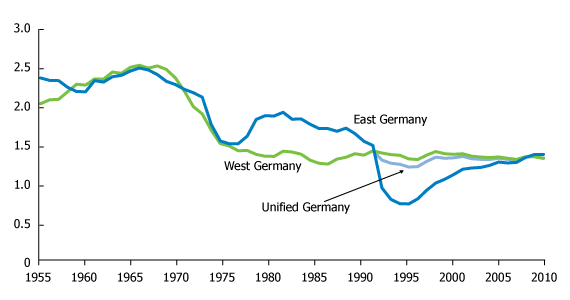 Source: German Federal Statistical Office.
In 1964, births exceeded deaths by 486,985, the highest postwar surplus. By 1972, deaths in Germany exceeded births by 64,032, and deaths have surpassed births every year since. In 2010, the difference between births and deaths stood at -180,833. Only a positive balance of net immigration has forestalled a much more rapid population decline. As a member of the European Union (EU), Germany must also abide by the Schengen Agreement of 1985 whereby the EU has no border controls. Member states do have the right to impose certain restrictions, however. In 1995, the agreement was in force in the 25 member states. There has been some resistance to including new member states from eastern and southern Europe in the passport-free zone. The EU is now debating the Schengen status of new members Bulgaria and Romania.
Population and Policies
The fourth phase of the demographic transition is often described as an extended period of near demographic equilibrium, with fertility near the replacement level of about 2.1 children per woman. In the majority of industrialized countries, fertility fell quite rapidly throughout the late 1960s and early 1970s, a transformation that was to alter demographic prospects in many countries in unforeseen ways. In the United States, fertility fell from 2.9 children per woman in 1965 to a record low of 1.7 in 1976. Germany reached a TFR of 1.7 in 1970. But while the U.S. fertility rate slowly rebounded to 2.1 in 1990 (and has remained close to that ever since), the German fertility rate did not rebound, and today is much lower, at 1.4.
Fertility in the former East and West Germany followed a very similar path up to the mid-1970s. But East Germany, under Communist rule, instituted a number of pronatalist measures such as family allowances, maternity leave, and child care subsidies. Fertility rose until the economic disruption after the country’s reunification and the subsequent out-migration from East Germany to the West.
Figure 2
Age and Sex Structure of Germany, 2009 and 2050
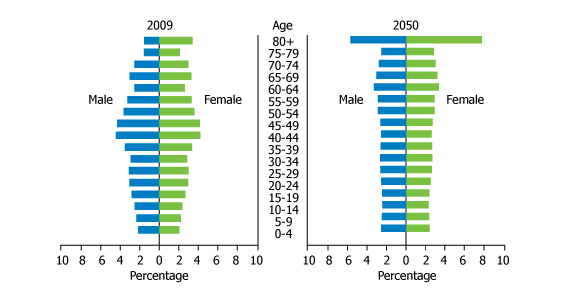 Sources: For 2009: German Federal Statistical Office, Statistical Yearbook 2010. For 2050: United Nations Population Division, World Population Prospects: The 2010 Revision (2011).
In western Germany, however, little was done to reverse the trend in low fertility. Fertility has remained below 1.5 children per woman since 1975, and at times considerably below. Obstacles to increasing the birth rate are similar to other low-fertility countries, particularly people’s lack of confidence in their economic future. But there are several other factors. Day care centers usually close at 1 p.m., a burden on the growing number of two-earner families. Social attitudes tend to disfavor leaving one’s child in the care of someone else for the entire day. Mothers who do leave their children all day are often considered to be “raven mothers” (Rabenmutter) because a raven abandons her young at an early age. But this attitude may be slowly changing with growing acknowledgment of a birth rate crisis. Some day care centers now sport Ganztags! signs (all-day day care). The government took little direct action until well after 2000, despite growing concern over the diminished number of young people and its effect on supporting pension programs and virtually free health care, particularly for the elderly.
To try to increase the birth rate, the government gives 184 euros monthly for the first and second child, 190 euros for the third, and 215 for the fourth until each child turns 18 (or 25 if still pursuing an education). Maternity leave spans 14 weeks, six weeks prior to the birth and eight weeks afterward—with a minimum benefit paid of 13 euros per day. Finally, a monthly minimum of 300 euros is allocated for care of a newborn but can rise to 1,800 euros or 67 percent of one’s prior salary. This is paid for 14 months with the stipulation that one parent must use the benefit for two months, a feature that ensures that fathers will take part in child care. The additional expense has put a strain on the national budget and has had little effect on birth rates. But only a few countries in the industrialized world have seen significant increases in birth rates from these kinds of family benefits—notably Russia and the Canadian province of Quebec.
Challenges
To date, efforts to raise fertility in Germany have not been successful. In two Eurobarometer surveys, respondents were asked about their “personal ideal” number of children. In 2001, German women ages 15 to 24 said 1.8 children; in 2006, they said 2.0. In contrast, in France the answer was 2.6 for both survey years. Answers to questions on ideal numbers of children, however, are nearly always much higher than fertility actually achieved in developed countries. In the 2001 survey, among German women ages 18 to 34, nearly 17 percent gave “none” as their ideal and 9 percent said “one,” percentages far higher than other EU countries.
Projections from the National Statistical Office assume that, if there is a rise in fertility, it will be quite modest. With an increase to a fertility rate of 1.6 children and annual net immigration of 200,000, Germany’s population would decrease to 74.5 million in 2060 with 31 percent of the population ages 65 and older. Should fertility remain at 1.4 children and immigration amount to 100,000 per year, the 2060 population would decline to 64.7 million, with 34 percent ages 65 and over. Given the stable trend in fertility over the last 35 years and the lack of success of pronatalist programs, population decline and continued aging appear to describe the country’s future quite well.
Previous:
World Population Growing at Record Speed
Phase 1: Uganda: At the Beginning of the Demographic Transition
Phase 2: Guatemala: Beyond the Early Phase of the Demographic Transition
Phase 3: India: On the Path to Replacement-Level Fertility?
This article is taken from the Population Bulletin:The World At 7 Billion, which looks at the four phases of the demographic transition as descriptive of past and future population growth. Four countries are highlighted to illustrate each phase and its implications for human well-being.
Uganda has entered into its demographic transition by reducing its once-high death rate. As a result of lower mortality but still high fertility, Uganda has developed a very youthful age structure.
Uganda’s population will continue to grow because of the large number of people who are either currently at an age when they are having children or who will soon enter that age group. With half of its population age 15 or younger, Uganda stands out as one of the world’s youngest age structures. As the world reaches 7 billion, countries at the beginning of their demographic transition represent a relatively small proportion—about 9 percent—of the world’s population. However, these countries face similar development challenges.
Overview
With a population of 35 million, Uganda is one of Africa’s largest and fastest-growing countries. Uganda has several policies and action plans that address its major population and development issues, yet none effectively address the country’s fertility, which is among the highest in the world. Despite economic growth in the past decade, many Ugandans live in poverty and confront social and economic inequities.
To understand Uganda’s population challenges, one must examine the roles and status of women. Ugandan women are greatly affected by HIV/AIDS, as is the case in many sub-Saharan African countries. In addition, maternal and child health indicators for Uganda show that women and children have very limited access to health services. Even though the country continues to improve the health of its people, Uganda will need to address its high fertility, increase the number of youth who attend secondary school and higher, and foster job creation so that its families, communities, and the nation as a whole grow economically.
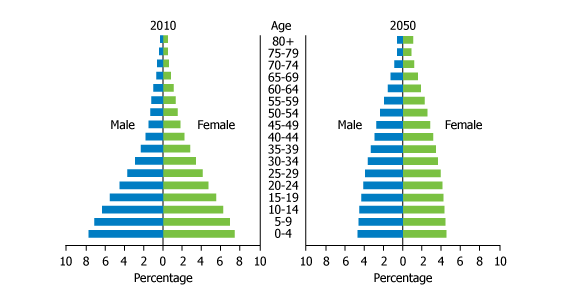
Age and Sex Structure of Uganda, 2010 and 2050
Source: United Nations Population Division, World Population Prospects: The 2010 Revision (2011).
Population and Policies
The factor driving Uganda’s current population growth of 3.3 percent per year is a total fertility rate (TFR) averaging between six and seven lifetime births per woman. This level is only a slight reduction from the high level in the 1970s of 7.1 children per woman. If the current fertility level persists, Uganda’s population will double to 70 million by 2031, and could reach 100 million after 2040.
One reason for this high TFR is that only about 18 percent of Uganda’s married women between ages 15 and 49 use effective contraception, with injectable contraceptives, pills, and sterilization the most popular methods. An additional 41 percent of married women want to postpone or avoid pregnancy but are not using an effective family planning method.
Uganda’s 2008 population policy prioritizes birth spacing and youth-friendly sexual and reproductive health services, and allocates funding for these programs. Two focal areas of Uganda’s National Population Policy Action Plan 2011-2015 are sexual and reproductive health and rights, and gender and family welfare. In spite of these and other policies, Uganda’s government shows relatively little support for family planning. For example, government funding for contraceptives is not sufficient even to address the needs of women living in urban areas, who represent only 15 percent of the total population. The lack of public support for family planning by national leaders is visibly noticed by the global community.
Economic Inequalities
Uganda’s gross domestic product is growing annually at a rate of 5 percent to 10 percent. Historically an agriculturally based economy, the discovery of oil in 2006 offers Uganda an opportunity for economic growth and diversification. Yet Uganda is still a resource-poor country and 65 percent of its population lives on less than US$2 per day. This inequality is stark: The wealthiest 20 percent (quintile) of the population holds 49 percent of total income, while the poorest quintile holds only 6 percent.
According to the 2006 Uganda Demographic and Health Survey (DHS), wealth distribution is closely related to fertility. Women in the poorest quintile have eight children on average during their lives, while women in the wealthiest quintile have just over four children. Similarly, 41 percent of young women ages 15 to 19 in the poorest quintile have begun childbearing, while only 16 percent in the wealthiest quintile have. These differences are further reinforced by the practice of child marriage: More than half of women in all but the wealthiest quintile are married before age 18.
Gender Inequalities
Like many countries that face development challenges, one of the barriers impeding progress is gender inequality. Gender roles play out in virtually every aspect of life—from educational attainment among youth to decisions made within families. In households where the 2006 DHS was conducted, men age 20 or older always had higher levels of education than women of the same age. However, females under age 20 had roughly the same education as males, suggesting greater attention to educating girls. Women’s empowerment remains elusive—men indicate that family size is primarily their decision (47 percent), though many see it as a joint decision (45 percent); few (5 percent) see it as the woman’s decision. Women reinforce their own lack of power as well: More than 70 percent of women thought that a husband could be justified for hitting or beating his wife, suggesting a cultural acceptance of violence against women.
Gender inequalities also play out in the HIV/AIDS epidemic. According to the 2010 Uganda Report to the United Nations, 6.4 percent of Ugandans between ages 15 and 49 are infected with HIV. However, young women experience much higher rates of infection than young men. For example, among 20-to-24-year-olds, 2.4 percent of men are HIV positive, compared to 6.3 percent of women. Prevalence is highest among women ages 30 to 34, at 12.1 percent, compared to 8.1 percent among men in that age group. Although AIDS continues to contribute approximately 64,000 deaths per year in Uganda, these deaths do not offset the population growth resulting from the approximately 1 million births each year in Uganda.
Health of Women and Children
Like other countries in the early phase of the demographic transition, Uganda has one of the world’s highest maternal death ratios—approximately 430 deaths per 100,000 live births. Although most women receive some antenatal care, only about 47 percent receive four or more visits and only 42 percent have a skilled attendant at delivery. These statistics vary greatly across Uganda’s nine regions.
Deaths among children under age 5 continue to decrease in Uganda, and currently fewer than 13 percent of children die before reaching age 5, due mainly to neonatal causes, malaria, pneumonia, and diarrhea. This reduction in child deaths is partly a result of higher levels of full immunization and better care at delivery, as well as better use of health services when children are ill. However, poor nutrition undermines the health of most children: 73 percent have anemia and 38 percent are stunted (low height for age).
Challenges
Uganda’s continued rapid population growth, according to the United Nations high projection, will expand its population in 2050 to 105.6 million; half the population would be age 20 or younger—significantly older than the current median age of 15. However, if fertility remains at a level of 6.7 children per woman (from the 2006 DHS), Uganda’s population could be as high as 145 million by 2050 and have the same youthful structure as it currently has. To address this challenge, Uganda will need to focus not only on family planning to slow its population growth, but on wise investments that will help develop an educated labor force and create jobs to sustain and increase its recent economic growth.
Previous: World Population Growing at Record Speed
Next: Phase 2: Guatemala: Beyond the Early Phase of the Transition


This article is taken from the Population Bulletin:The World At 7 Billion, which looks at the four phases of the demographic transition as descriptive of past and future population growth. Four countries are highlighted to illustrate each phase and its implications for human well-being.
India is on track to become the world’s largest country about 10 years from now, even though fertility has declined to 2.6 children per woman, which is less than half of its 1950s level.
India’s population will surpass China’s, assuming that China does not alter its current fertility policy. But India’s population will also be more youthful than China’s and will not face a budget-straining situation of population aging. Countries like India in the third phase of demographic transition have fertility rates that have declined significantly from previously high levels but have not reached the population-stabilizing “replacement level” of 2.1 children per woman. These countries are home to 38 percent of the world’s 7 billion people.
Overview
As of the recently conducted 2011 Census, India’s population stood at 1.2 billion. To get an idea of the size of India’s population, consider that the population of just one age group, males ages 0-4, is about 67 million, larger than the entire population of France. Between the last three censuses, India’s population growth rate has been in decline, but the 2011 Census was the first to show a decrease in the number added as well. From 2001 to 2011, 181.5 million people were added, down slightly from 182.3 million from 1991 to 2001.
Figure 1
Sex Ratio at Birth, Selected States of India, 1999-2008
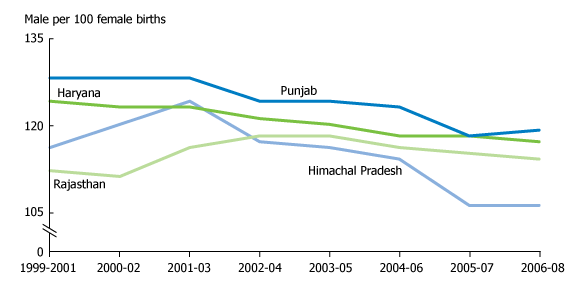
Source: Registrar General of India, Sample Registration System.
India is often portrayed as an exploding middle-class economy. While not a complete exaggeration, such attitudes obscure a far more complex society. Unlike Vietnam, an example of a virtually homogeneous country with a common language and predominant ethnicity, India is more like a collection of semi-independent countries united under one democracy. The country is divided into 35 states and Union Territories, from Uttar Pradesh with 200 million people to the Lakshadweep Islands with 64,429 people. Its diversity is reflected by the fact that there are 16 separate languages on rupee notes. Many states are ruled by regional parties, posing challenges to the national government in Delhi in forming coalition governments at the national level and at some state levels.
Despite much publicity given to the country’s economic growth, India remains a rural nation with many towns officially designated as urban still retaining much of their rural character. Urban places are generally defined as villages and towns of 5,000 or more in which 75 percent or more of the male labor force is not directly employed in agriculture. The average Indian resided in a village of about 4,000 people in 2001. Many of these places lack adequate sanitation and clean water, and are often only reachable by primitive roads and trails. These characteristics often place considerable obstacles in the path of health services delivery.
There are also misconceptions regarding the Indian “middle class” and standards of living. Indians are not consumers in the Western sense of impulse purchases or frivolous spending. A true middle-class Indian, living a Western-standard life, is more properly considered part of the super-rich class, a minuscule proportion of the population. Media reports on new, glitzy shopping malls in India fail to mention that few visitors actually purchase anything; they go to the air-conditioned malls to visit food courts and attend the cinema. In the vast majority of Indian households, traditional ways of life, such as arranged and early marriages (about half of Indian females marry below the legal age of 18), deep respect for one’s elders, and close relations with extended families are the rule. One’s wages are less important than in the West, since large extended families often pool resources.
Figure 2
Total Fertility Rates, India and Selected States, 1972-2009
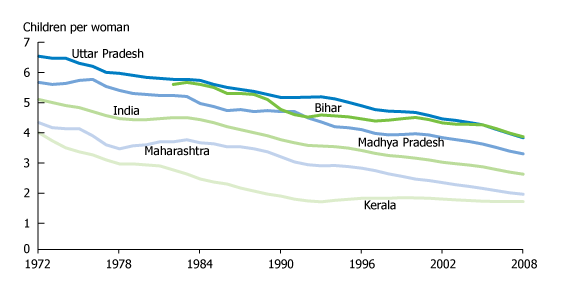
Note: The states of Chhattisgarh, Jharkhand, and Uttarkhand were seperated from Madhya Pradesh, Bihar, and Uttar Pradesh, respectively, in 2000.
Source: Registrar General of India, Sample Registration System.
Population and Policy
India is often noted as the first developing country to declare a policy to reduce fertility, in 1952, although effective funds were not allocated until 1966 and the fi rst truly comprehensive policy was not written until 2000. Nonetheless, effective measures were taken in many states to lower the birth rate and every state has seen a decline. In the early 1950s, fertility is estimated to have been 5.9 children per woman by the United Nations Population Division, not as high as in many other developing countries at the time where the average was often seven children or more.
By 2009, fertility in India had declined to 2.6 children per woman, less than half that of the early 1950s. But this national fertility rate masks wide disparities by state. The lowest fertility rates are found in the southern states, especially in Kerala with a 2009 TFR of 1.7, along with its neighbor Tamil Nadu. Much of the country’s demographic future will depend on fertility trends in the northern states which, along with large populations, have the highest levels of illiteracy and poverty. Bihar and Uttar Pradesh, the states with the highest TFRs, had populations of 104 million and 200 million, respectively, in 2011. These two states, part of the Empowered Action Group States (EAG), along with Chhattisgarh, Jharkhand, Madhya Pradesh, Orissa, Rajasthan, and Uttarakhand, are all impoverished and are the focus of increased family planning efforts.
Skewed Sex Ratio at Birth
Along with China and several Caucasus countries, the preference for sons in India has resulted in a sex ratio at birth skewed in favor of males. Worldwide, the biological norm is about 105 male per 100 female births. India’s sex ratio is 111 male per 100 female births. In India, there are both economic and religious motivations for the abortion of female fetuses. At marriage, a daughter leaves the household to live with her in-laws and thereby provides no economic support to her parent’s family, especially in their old age. Additionally, a dowry must be paid even though dowries were banned in 1961. There is a saying that having a daughter is “like watering your neighbor’s garden.” For Hindus (about 80 percent of the population), having a son light his parent’s funeral pyre is a prerequisite for Nirvana, the release from the cycle of reincarnation.
Sex-selective abortion was made illegal in 1994 and, recently, the prosecution of doctors who engage in the practice was taken up in a serious way. It is clear that some notable progress has been made. Generally, the abortion of female fetuses is more prevalent in wealthier, highly educated, low-fertility states where parents can afford the ultrasound test and the motivation to have at least one son is more pressing.
The Future
The size of India’s future population will largely depend upon the course of fertility decline in the highly populous north. While clearly in the third phase of the transition, will India move to the fourth phase of replacement fertility or will it join that group of developing countries where that seems doubtful? For the fourth phase to begin, fertility in the very large and poor Indian states will have to decline to that of an industrialized country, around two or fewer children. In terms of future world population size, India will be one of the important demographic stories in coming decades.
Previous: Phase 2: Guatemala: Beyond the Early Stage of the Transition
Next: Phase 4: Germany: Beyond the Transition’s End
This article is taken from the Population Bulletin:The World At 7 Billion, which looks at the four phases of the demographic transition as descriptive of past and future population growth. Four countries are highlighted to illustrate each phase and its implications for human well-being.
(July 2011) As a lower middle-income country, Guatemala is well-advanced in its demographic transition, showing evidence of recent reductions in its birth rate.
Guatemala’s population structure illustrates that women have been having fewer children for several years, which explains why the base of the pyramid is shorter, compared to the elongated base of Uganda’s pyramid. With half of its population age 19 or younger, Guatemala’s population is still relatively young and is the youngest in Latin America. Guatemala is one of many countries in this second phase of the demographic transition; together they represent about 7 percent of the world’s population of 7 billion.
Overview
At more than 14 million, Guatemala is the most populous country in Central America. Its growth rate is still high at 2.5 percent per year—the highest in all of Latin America. Although Guatemala has several national policies that support social development and address population issues, they have not been carried out very effectively. The country has experienced economic growth in the past decade, although growth has recently slowed. Guatemala remains challenged by high levels of inequality, especially between the Mayan population, which represents approximately 40 percent of the country’s population, and the ladino population, which makes up the majority of the remaining 60 percent.
Guatemala has made great strides in addressing many of its gender-based disparities. However, the more-telling difference is between the quality of the lives of Mayan and ladina women, reflected in differences in school attendance and use of health services. Women are having smaller families; people are healthier and living longer, with a life expectancy at birth of 71 years; and the child dependency ratio is decreasing, suggesting that families may be poised to invest more in health, education, and savings. Nevertheless, sustaining economic growth and dealing with an upturn in violent crime threaten Guatemala’s longer-term development.
Age and Sex Structure of Guatemala, 2010 and 2050
Source: United Nations Population Division, World Population Prospects: The 2010 Revision (2011).
Population and Policies
Over the past 20 years, fertility levels have decreased substantially in Guatemala. From 5.6 children per woman in 1987, the recent 2008/09 National Survey of Maternal and Child Health (NSMCH) indicates that women have an average of 3.6 children each. If current fertility remains unchanged, Guatemala’s population will double in 26 years. Although fertility has gone down, women indicated that, on average, they want fewer than three children.
The recent reductions in fertility are due largely to increased use of family planning. Currently, 44 percent of married women use a modern family planning method, with female sterilization and injectable contraceptives the most common types. At the same time, an additional 31 percent of married women want to postpone or avoid pregnancy but are not using an effective contraceptive method.
Since 2002, Guatemala has had a national Social Development and Population policy that prioritizes as health objectives a reduction in maternal and infant mortality, sexually transmitted infections, and HIV/AIDS. In 2010, the Guatemalan Congress approved a law to support healthy motherhood, and stipulates that at least 30 percent of taxes on the sale of alcohol should be used to support reproductive health programs. Guatemala is also addressing poverty reduction through Mi Familia Progresa, a conditional cash transfer program established in 2008 that encourages the use of health services and education.
Economic Inequalities
Guatemala’s recent economic growth has resulted from tourism and the exports of textiles, clothing, and agricultural crops. Half of the labor force works in agriculture. Almost a quarter of the population lives on less that US$2 per day. The country has a very inequitable income distribution: The wealthiest 20 percent (quintile) of the population holds 58 percent of total income, while the poorest quintile holds only 3 percent.
Economic inequalities influence many social behaviors. Wealthier women have fewer children on average during their lives than poorer women have: 1.8 children per woman in the wealthiest quintile compared to 5.7 children per woman in the poorest quintile. It is not surprising that use of family planning methods is very high among married women in the wealthiest quintile—72 percent—but only 36 percent of married women in the lowest quintile use any form of family planning.
Gender Inequalities
Compared with many other countries, Guatemala has moved closer toward gender equality. Between 1987 and 2008/09, the percentage of women who never attended school dropped from 38 percent to 20 percent; among Mayan women, this improvement was even more notable: from 67 percent never attending school in 1987 to 35 percent not attending school in 2008/09. Recent educational advances are fairly equal for both boys and girls. Among children ages 5 to 14, there are no differences in the age at which boys and girls start school nor in the percentage who never attend school.
Gender roles also influence social behaviors and attitudes. Many Guatemalan women tend to have more traditional views. For example, 65 percent of women included in the 2008/09 survey reported that a woman should obey her husband even when she does not agree with him. Almost 80 percent responded that they need to get his approval before incurring a household expense, working outside the house, going to the doctor when ill, or leaving the house. However, only 56 percent indicated that a woman should seek the man’s approval about using family planning. Each of these attitudes was more frequently held by women in the poorer quintiles than in the wealthier ones.
Gender-based violence is not unusual, as 46 percent of women reported that they have experienced either verbal, physical, or sexual violence from their husband or partner. The frequency of these behaviors is consistent between Mayan and ladina women, as well as across wealth quintiles. However, in contrast to other countries where women accept wife beating, only 7 percent of Guatemalan women agreed that under certain circumstances a man is justified in hitting his wife.
Health of Women and Children
As a country with improving access to and use of health services, Guatemala still has a high maternal mortality ratio of 110 deaths per 100,000 live births, putting it slightly above other countries in Central America. Use of antenatal care is very high, with 93 percent of women receiving care at some time during their most recent pregnancy. More than 50 percent of women receive care from a physician or nurse during delivery, but only 30 percent of Mayan women receive skilled care, compared to 70 percent of ladina women.
Deaths among children under age 5 continue to decrease, from 109 in 1987 to 42 in 2008/09. More than half of infant deaths (17 out of 30 deaths per 1,000 live births) occur in the neonatal period; death at this phase can be prevented through skilled attendance at deliveries and antenatal care. Almost half of all children between ages 3 months and 59 months are stunted (low height for age.) However, almost twice as many Mayan children are stunted as are ladino children (66 percent vs. 36 percent, respectively). Just under half (48 percent) of children ages 6 months to 59 months are anemic, but this condition is fairly evenly distributed across wealth quintiles and ethnicity groups.
Challenges
Guatemala has made great advances in social and economic development in the past two decades, but serious inequities still exist between the Mayan and ladino populations. Regardless of the issue considered—fertility, child health, education—the disparities between these two segments of the population represent the gap that must be addressed through future development initiatives. If Guatemala follows the medium projection scenario, it will have a population of almost 32 million by 2050, and an age structure similar to Phase-3 countries.
Previous: Phase 1: Uganda: At the Beginning of a Transition
Next: Phase 3: India: On the Path to Replacement?