Mark Mather
Associate Vice President, U.S. Programs

Women live longer than men in the United States and in nearly every country in the world. But in the United States and many other developed countries, this gender gap is narrowing, resulting in an increase in the number of men, relative to women, surviving to old age.
In 1990, there was a seven-year gap in life expectancy between U.S. men and women. By 2013, this gap had narrowed to less than five years. It’s not that women are dying sooner, but that men’s life expectancy is increasing at a faster pace. In 2013, life expectancy at birth was 76.4 years for males and 81.2 years for females. But if current trends continue, men’s life expectancy could approach that of women within the next few decades.
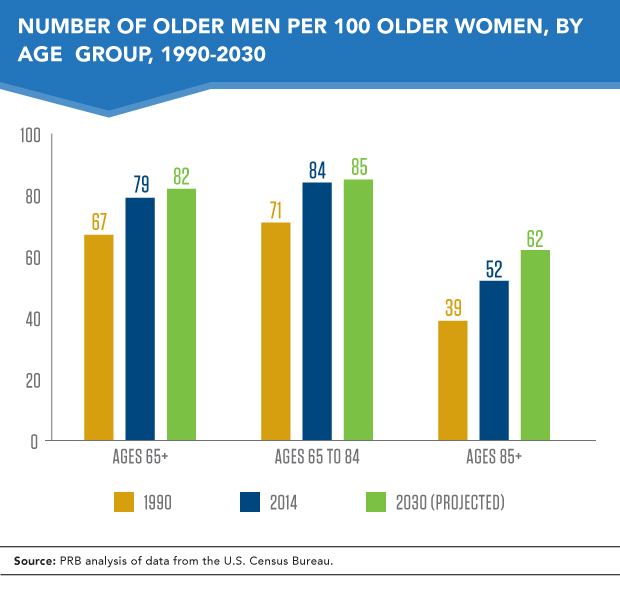
The growing number of men surviving to older age groups, relative to women, is contributing to a rising sex ratio—the number of males per 100 females—at older ages. The latest data from the U.S. Census Bureau show that in 2014, there were 79 men ages 65 and older for every 100 woman in that age group—up from 67 older men per 100 older women in 1990 (see figure). By 2030, the Census Bureau projects that the sex ratio for older adults will increase to 82 men per 100 women.
The data for those ages 85 and older are even more striking. The sex ratio has increased sharply among the “oldest old,” from 39 older men per 100 older women in 1990 to 52 in 2014. Census Bureau projections show that the sex ratio for those ages 85 and older could rise to 62 by 2030. That represents 24 additional men for every 100 women in the oldest-old category, compared with the 1990 estimate.
In the United States, the decline in the gender gap in mortality has been linked to male and female patterns of smoking, which increases the risk of death from lung cancer, heart disease, chronic obstructive pulmonary disease, and stroke. During the first half of the 20th century, smoking prevalence rates among men and women converged, as men’s rates declined from their earlier peaks and women’s rates increased—leading to a rise in smoking-related deaths among women relative to men.1 Smoking prevalence peaked among women born in the early 1940s, whereas prevalence rates peaked for men born in the 1910s. The result has been a steady reduction in smoking-related deaths among older men, and an increase in deaths among older women.
Similar declines in the gender gap in life expectancy have been reported in several countries in Europe. In France, the narrowing gap has been linked to reductions in male deaths due to heart disease and lung cancer. Improvements in men’s cardiovascular health, relative to women, has also helped reduce the gender gap in mortality in England and Wales, Sweden, Switzerland, and Italy.2
The gender gap at older ages is narrowing across all racial/ethnic groups, but the trend is most evident for non-Hispanic whites. Between 2000 and 2014, the number of white men ages 65 and older per 100 white women in that age group increased from 71 to 80—the largest increase among any of the major racial/ethnic groups (see Table 1).
Table 1
Sex Ratio at Older Ages (65+), by Race/Ethnicity, 2000 and 2014
| 2000 | 2014 | Increase | |
|---|---|---|---|
| Total | 70 | 79 | 9 |
| White* | 71 | 80 | 10 |
| Black or African American* | 61 | 67 | 5 |
| American Indian and Alaska Native* | 75 | 82 | 7 |
| Asian* | 74 | 76 | 2 |
| Native Hawaiian and Other Pacific Islander* | 81 | 87 | 6 |
| Two or more races* | 72 | 79 | 8 |
| Hispanic/Latino | 72 | 76 | 4 |
*Non-Hispanic.
Source: U.S. Census Bureau.
The sex ratio is also increasing among African Americans, but the number of older African American men is still lagging far behind the number of older women. In 2014, there were just 67 African American men per 100 African American women ages 65 and older. This imbalance is linked to the high rates of premature death among African American men. In 2013, the average life expectancy for black males at birth was just 72 years—well below the average for black females (78 years) and the U.S. average (79 years).
There is a striking regional pattern in the sex ratio among older adults, with more men relative to women in parts of the West, and more women relative to men in the South (see map). The relatively low sex ratio for older adults in the South reflects the high concentration of older African American women, who are more likely to outlive their male counterparts.
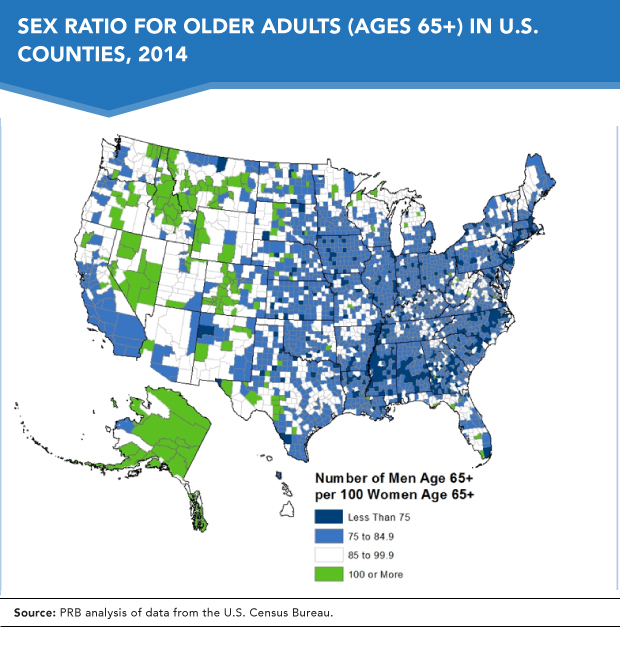
The pattern in the West may reflect historical migration patterns of men moving to Western counties to work in male-dominated jobs, including agriculture and mining. The total male population in the Western Region outnumbered the female population until the 1960s, while the number of females outnumbered males in the Northeast and South by the 1930s, and in the Midwest by the 1940s.3 These historical patterns continue to shape the regional distribution of the U.S. population today. Among the 50 states, Alaska had highest sex ratio for older adults in 2014 (98 older men per 100 older women).
Many of the counties with the highest sex ratios are located in sparsely populated rural areas. Others, such as Noble County Ohio, have imbalanced sex ratios because they have large prison populations. Among larger counties with at least 10,000 people ages 65 and older, Monroe County Florida—which includes the Florida Keys—had the highest sex ratio for older adults in 2014 (115 older men per 100 older women) (see Table 2). The Florida Keys is also home to a large number of divorcees: as of 2013 about 17 percent of men ages 65 and older in Monroe County were divorced, compared with 11 percent in Florida and 10 percent nationwide.
Table 2
Large Counties With the Highest Sex Ratios for Older Adults
(Counties With at Least 10,000 Adults Ages 65 and Older)
| Monroe County, Florida | 114.7 |
| Nye County, Nevada | 104.9 |
| Lyon County, Nevada | 101.0 |
| Camden County, Missouri | 100.6 |
| Douglas County, Nevada | 100.1 |
| Mohave County, Arizona | 98.4 |
| Sumter County, Florida | 95.9 |
| Calaveras County, California | 95.8 |
| Pinal County, Arizona | 95.3 |
| Lake County, California | 94.9 |
| Wayne County, Pennsylvania | 94.2 |
| Brunswick County, North Carolina | 94.0 |
| Carroll County, New Hampshire | 93.5 |
| Gila County, Arizona | 93.4 |
| Klamath County, Oregon | 93.4 |
| Mason County, Washington | 93.1 |
| Gallatin County, Montana | 92.9 |
| Flathead County, Montana | 92.8 |
| Pike County, Pennsylvania | 92.4 |
| Cochise County, Arizona | 92.3 |
Source: PRB analysis of data from the U.S. Census Bureau.
Four other large counties had sex ratios for older adults that exceeded 100, including three in Nevada (Douglas, Lyon, and Nye Counties) and one in Missouri (Camden County).
Historically, older adults have relied heavily on their adult children to provide support and care when they needed assistance. This is especially true among older women, who are much more likely than older men to be living alone. However, recent trends in marriage and family patterns may limit the availability of adult children who are available—or willing—to provide care for elderly parents in the coming decades. More young adults are delaying marriage, and in 2013, 41 percent of births occurred outside of marriage, up from 33 percent in 2000. As a result, more children are growing up in single-parent families and “blended families” made up of a couple and their children from their current and previous relationships. Children’s complex living arrangements may lead to weaker family ties and less support for aging parents.
Spousal care could potentially help fill this gap. With more men surviving to old age, there are more potential partners and caregivers available for older adults. However, the reality of caregiving is more complex because of the rising number of older adults who are single. It’s estimated that nearly half of female baby boomers will have been divorced by age 65.4 Although many of these women have remarried, there has also been a rapid increase in older adults who are single or cohabiting.5 Given these changes in marriage and family patterns, it’s too soon to tell whether men’s longer life expectancy will translate into better support mechanisms for older women, or if these gains will be offset by broader social trends.
Mark Mather is associate vice president of U.S. Programs at PRB.