2014 World Population Data Sheet Interactive map
View data on global, regional, or country maps or tables using PRB's 2014 interactive map organized in six tabs: population, births and deaths, life expectancy, family planning, income, and environment.
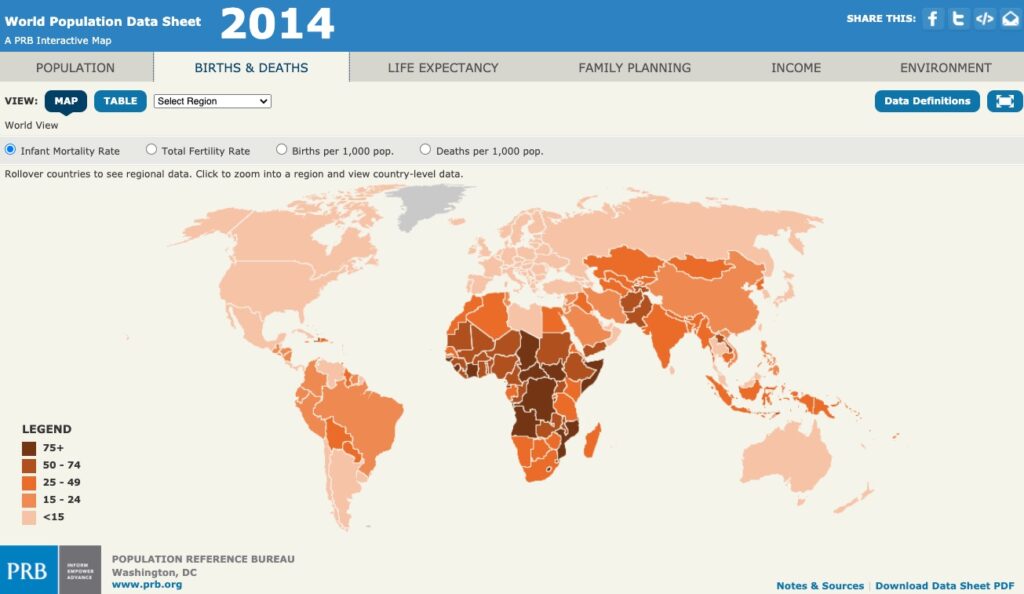
View data on global, regional, or country maps or tables using PRB’s 2014 interactive map. This map gives you 15 indicators organized in six tabs: population, births and deaths, life expectancy, family planning, income, and environment. For three of the indicators—infant mortality, total fertility rate, and life expectancy—we have included data from 1970 and 2013 to show trends over time. The environment indicator—carbon emissions—shows data from 1990 and 2012.
You can easily share and embed the map on your blog, website, Facebook page, or Twitter feed. (You may have to disable your browser’s pop-up blocker if you want to view the map in full screen mode.)
Related Posts
Family Planning and the Gendered Impacts of Crises on Women: An Effective Tool Across Sectors to Support Women’s Empowerment and Build Resilience to Shocks
Holistic integrated solutions are key to address the interlinkages of the gendered impacts of crises.
Health Sector Reform: How It Affects Reproductive Health
(June 2003) Many less developed countries are reforming their health systems in an effort to achieve public health goals more affordably and effectively.
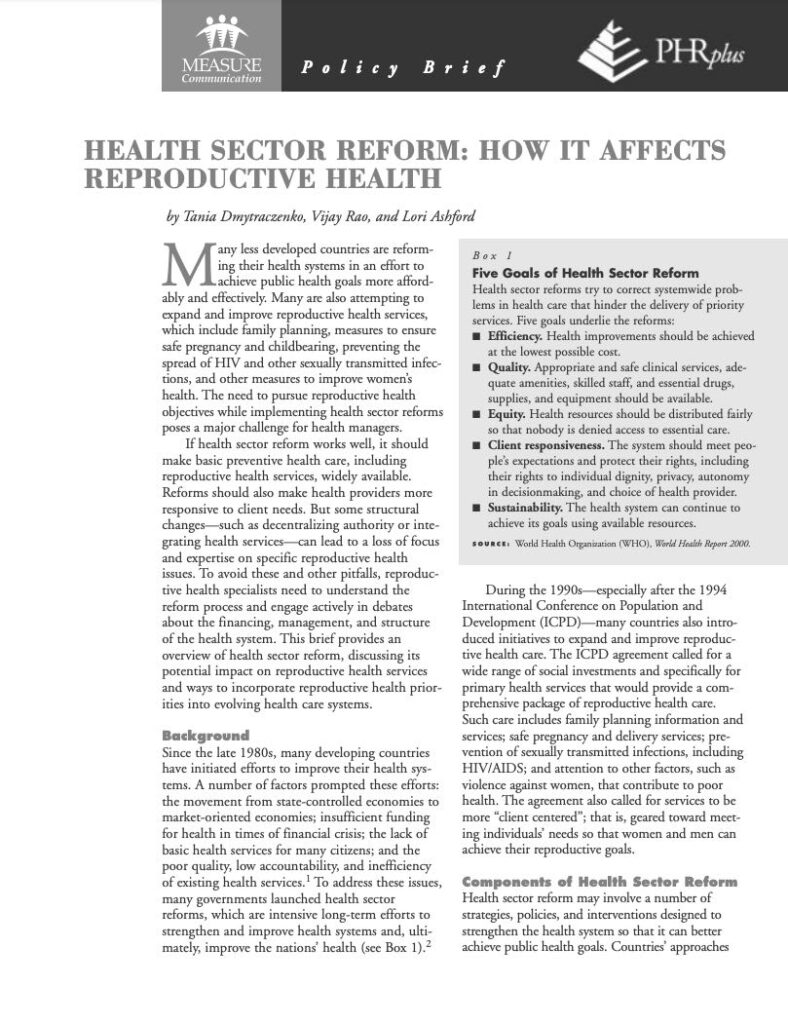
Report. Health Sector Reform: How It Affects Reproductive Health
This report also in French and Spanish. (June 2003) Many less developed countries are reforming their health systems in an effort to achieve public health goals more affordably and effectively.
Report. Reproductive Health in Policy & Practice: Case Studies From Brazil, India, Morocco, and Uganda
To assess how the Programme of Action, agreed upon at the 1994 International Conference on Population and Development (ICPD), is being implemented, senior researchers in Brazil, India, Morocco, and Uganda conducted country case studies.
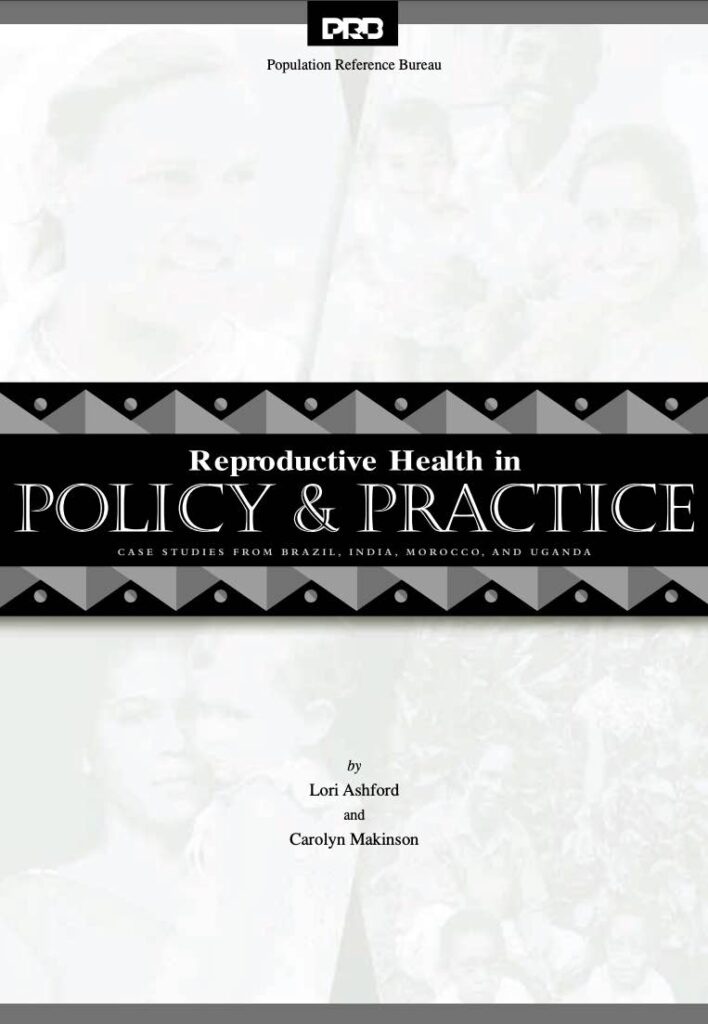
Reproductive Health in Policy & Practice: Case Studies From Brazil, India, Morocco, and Uganda
To assess how the Programme of Action, agreed upon at the 1994 International Conference on Population and Development (ICPD), is being implemented, senior researchers in Brazil, India, Morocco, and Uganda conducted country case studies.