William P. O’Hare
President, O'Hare Data and Demographic Services LLC

At least 4 million U.S. children under age 5 live in neighborhoods with a very high risk of undercounting young children in the 2020 Census, according to a new analysis by Population Reference Bureau (PRB). The estimate is based on a new PRB study to help improve targeting of communities with the highest risk of undercounting young children.
In the study, PRB identifies factors that predict where children under age 5 are more likely to be missed and develops a new undercount risk measure for young children. PRB’s database and an interactive map (developed by the CUNY Mapping Service at the City University of New York’s Graduate Center) show the risk of undercounting young children across U.S. census tracts in 689 large counties.
PRB’s results suggest that two measures currently being used to identify areas where young children are more likely to be missed—the 2010 Census mail return rate and the Low Response Score (also based on mail return rates)—are not very good predictors of net undercount rates for young children in large counties. Using updated census data for the 689 counties, the new study points to data on family structure and living arrangements, recent immigration, and socioeconomic status as better predictors of the risk for child undercount.
“Developing this new risk measure for the undercount of young children in local communities is a big step forward,” said Linda Jacobsen, co-author of the study and PRB’s vice president for U.S. Programs. “It provides advocates and others with a new tool to better pinpoint neighborhoods that need special attention.”
PRB’s research finds young children are more likely to be missed in neighborhoods with high shares of:
Collectively, the 689 counties included in the study account for about 93% of the national net undercount of young children in the 2010 Census. After identifying factors associated with the undercount of young children at the county level, PRB applied model coefficients to more recent population data at the census-tract level to identify neighborhoods at varying levels of risk for child undercount.
Census tracts were classified into one of three risk categories, based on PRB’s predicted net undercount rates for young children (see Table 1). About 25% of children under age 5 (4.1 million) live in tracts classified as having a “very high risk of undercount.” Collectively, the results suggest that about four-fifths of young children live in a neighborhood with a high or very high risk of a net undercount.
Table 1: Distribution of Children Under Age 5 by Tract-Level Risk Status, 2014-2018
| wdt_ID | Risk Status, 2014-2018 | Number of Young Children | Percent of Young Children |
|---|---|---|---|
| 1 | Low risk of undercount or potential overcount | 3,095,045.0 | 19 |
| 2 | High risk of undercount | 9,290,040.0 | 56 |
| 3 | Very high risk of undercount | 4,065,149.0 | 25 |
| 4 | Total | 16,450,234.0 | 100 |
Note: The number and percent of children are limited to counties with at least 5,000 children under age 5 in the 2010 Census and tracts within those counties with at least 25 children under age 5 in the 2010 Census.
<smallSources: PRB analysis of data from the U.S. Census Bureau; Revised 2018 Experimental Demographic Analysis Estimates; and 2014-2018 American Community Survey.
Data for the study are based on PRB’s analysis of the Census Bureau’s Revised 2018 Experimental Demographic Analysis Estimates, the 2010 Census, and five-year estimates from the American Community Survey. The technical paper with full methodology and a tract-level data set with the undercount risk measure and associated neighborhood characteristics are available for download.
The figures for all children in the 689 counties mask large differences among racial and ethnic groups. The percent of children under age 5 living in tracts with a very high risk of undercounting young children ranges from a high of 48% among African American children to a low of 9% among non-Hispanic white children (see Table 2). A large share of young Latino children also live in neighborhoods with a very high risk of undercount (38%). Data from the 2010 Census indicate these two groups of young children had exceptionally high net undercounts in the 2010 Census. Special attention should be devoted to neighborhoods where young black and Hispanic children are concentrated.
Table 2: Children Under Age 5 Living in Tracts With Very High Risk of Undercounting Young Children, by Race and Hispanic Origin, 2014-2018
| Children Under Age Five | Percent in Census Tracts With a Very High Risk of Undercounting Young Children |
|---|---|
| All children | 25% |
| Hispanic/Latino | 38% |
| Black alone | 48% |
| Asian alone | 28% |
| American Indian/Alaska Native alone | 31% |
| Native Hawaiian/Other Pacific Islander alone | 31% |
| Non-Hispanic White alone | 9% |
| Two or more races | 22% |
Notes: The percentage shown includes all children living in counties with at least 5,000 children under ages 5 in the 2010 Census and in tracts within those counties with at least 25 children under age 5 in the 2013-2017 American Community Survey. Regarding “Hispanic/Latino,” Hispanics can be of any race, so they are also included in the other racial categories with the exception of White alone.
Sources: PRB analysis of data from the U.S. Census Bureau; Revised 2018 Experimental Demographic Analysis Estimates; and 2013-2017 and 2014-2018 American Community Surveys.
The risk of undercounting young children also varies widely across the 689 large counties included in the analysis. While 80% of children under age 5 in Miami-Dade County, Florida live in a census tract with a very high risk of undercounting young children, the corresponding share in King County, Washington is only 12%. The characteristics of neighborhoods in these two counties help explain the difference in risk status. For example, while 26% of households in Miami-Dade County are limited English speaking, only 6% of households in King County fall in that category.
The tract-level maps below show the undercount risk for children under age 5 in 12 large U.S. counties and cities. Each map is accompanied by summary statistics showing key factors predicting the undercount of young children, as well as a link to an interactive version developed by the CUNY Mapping Service at the City University of New York’s (CUNY) Graduate Center.
We hope these maps will help advocates and others better target geographic areas and population subgroups for Get-Out-the-Count efforts to reduce the undercount of young children and help ensure an accurate 2020 Census.
Click here for an interactive version of this map from the CUNY Mapping Service at the City University of New York’s Graduate Center.
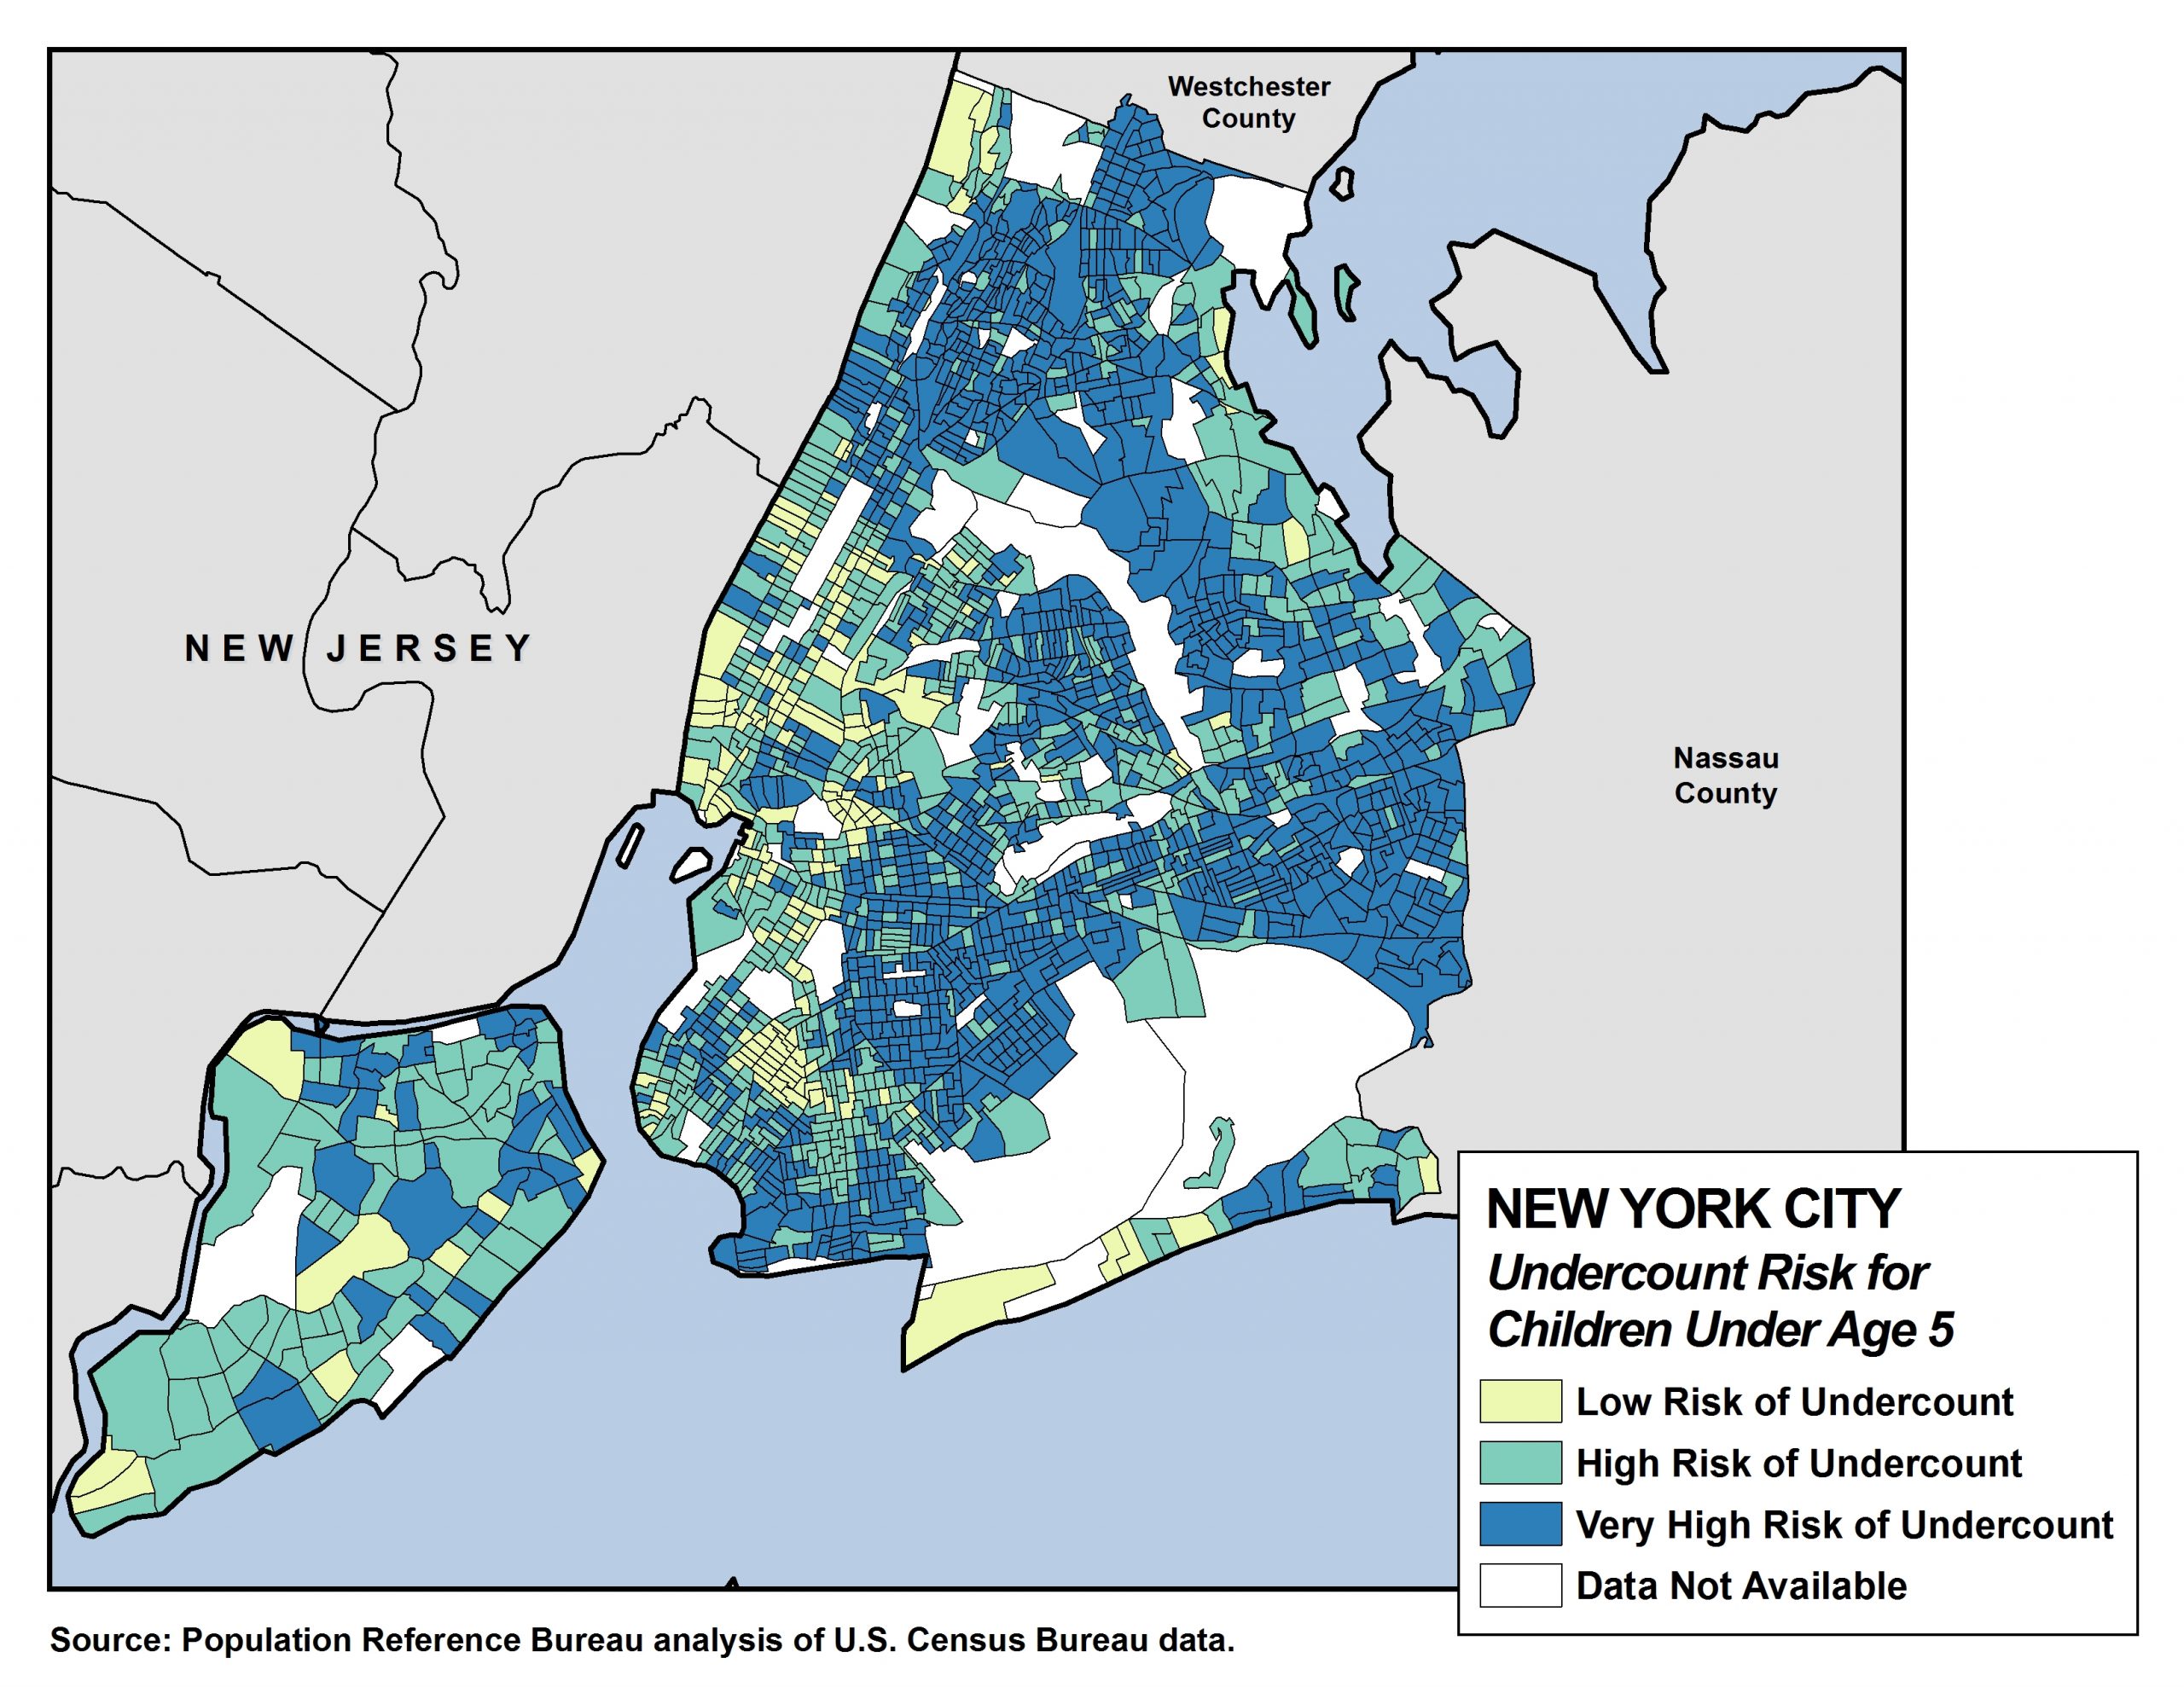
In New York City, 57% of children under age 5 live in tracts with a very high risk of undercounting young children, according to PRB’s analysis of data from the U.S. Census Bureau.
| wdt_ID | Key Factors Predicting the Undercount of Young Children | United States | NY | All tracts in New York City | Tracts in New York City w/ very high risk of undercounting |
|---|---|---|---|---|---|
| 1 | Children under age 5 living in families with incomes below 100% of the poverty level (%) | 22 | 23 | 26 | 31 |
| 2 | Adults ages 18 to 34 with less than a high school diploma or GED (%) | 12 | 11 | 12 | 14 |
| 3 | Children under age 18 living in female-headed households with no spouse present (%) | 25 | 27 | 33 | 45 |
| 4 | Children under age 6 living with grandparent householders (%) | 11 | 11 | 13 | 19 |
| 5 | Households that are limited English speaking (%) | 4 | 8 | 15 | 19 |
| 6 | Children under age 6 living in immigrant families (%) | 25 | 37 | 54 | 61 |
| 7 | Population living in renter-occupied housing units (%) | 35 | 43 | 65 | 68 |
Click here for an interactive version of this map from the CUNY Mapping Service at the City University of New York’s Graduate Center.
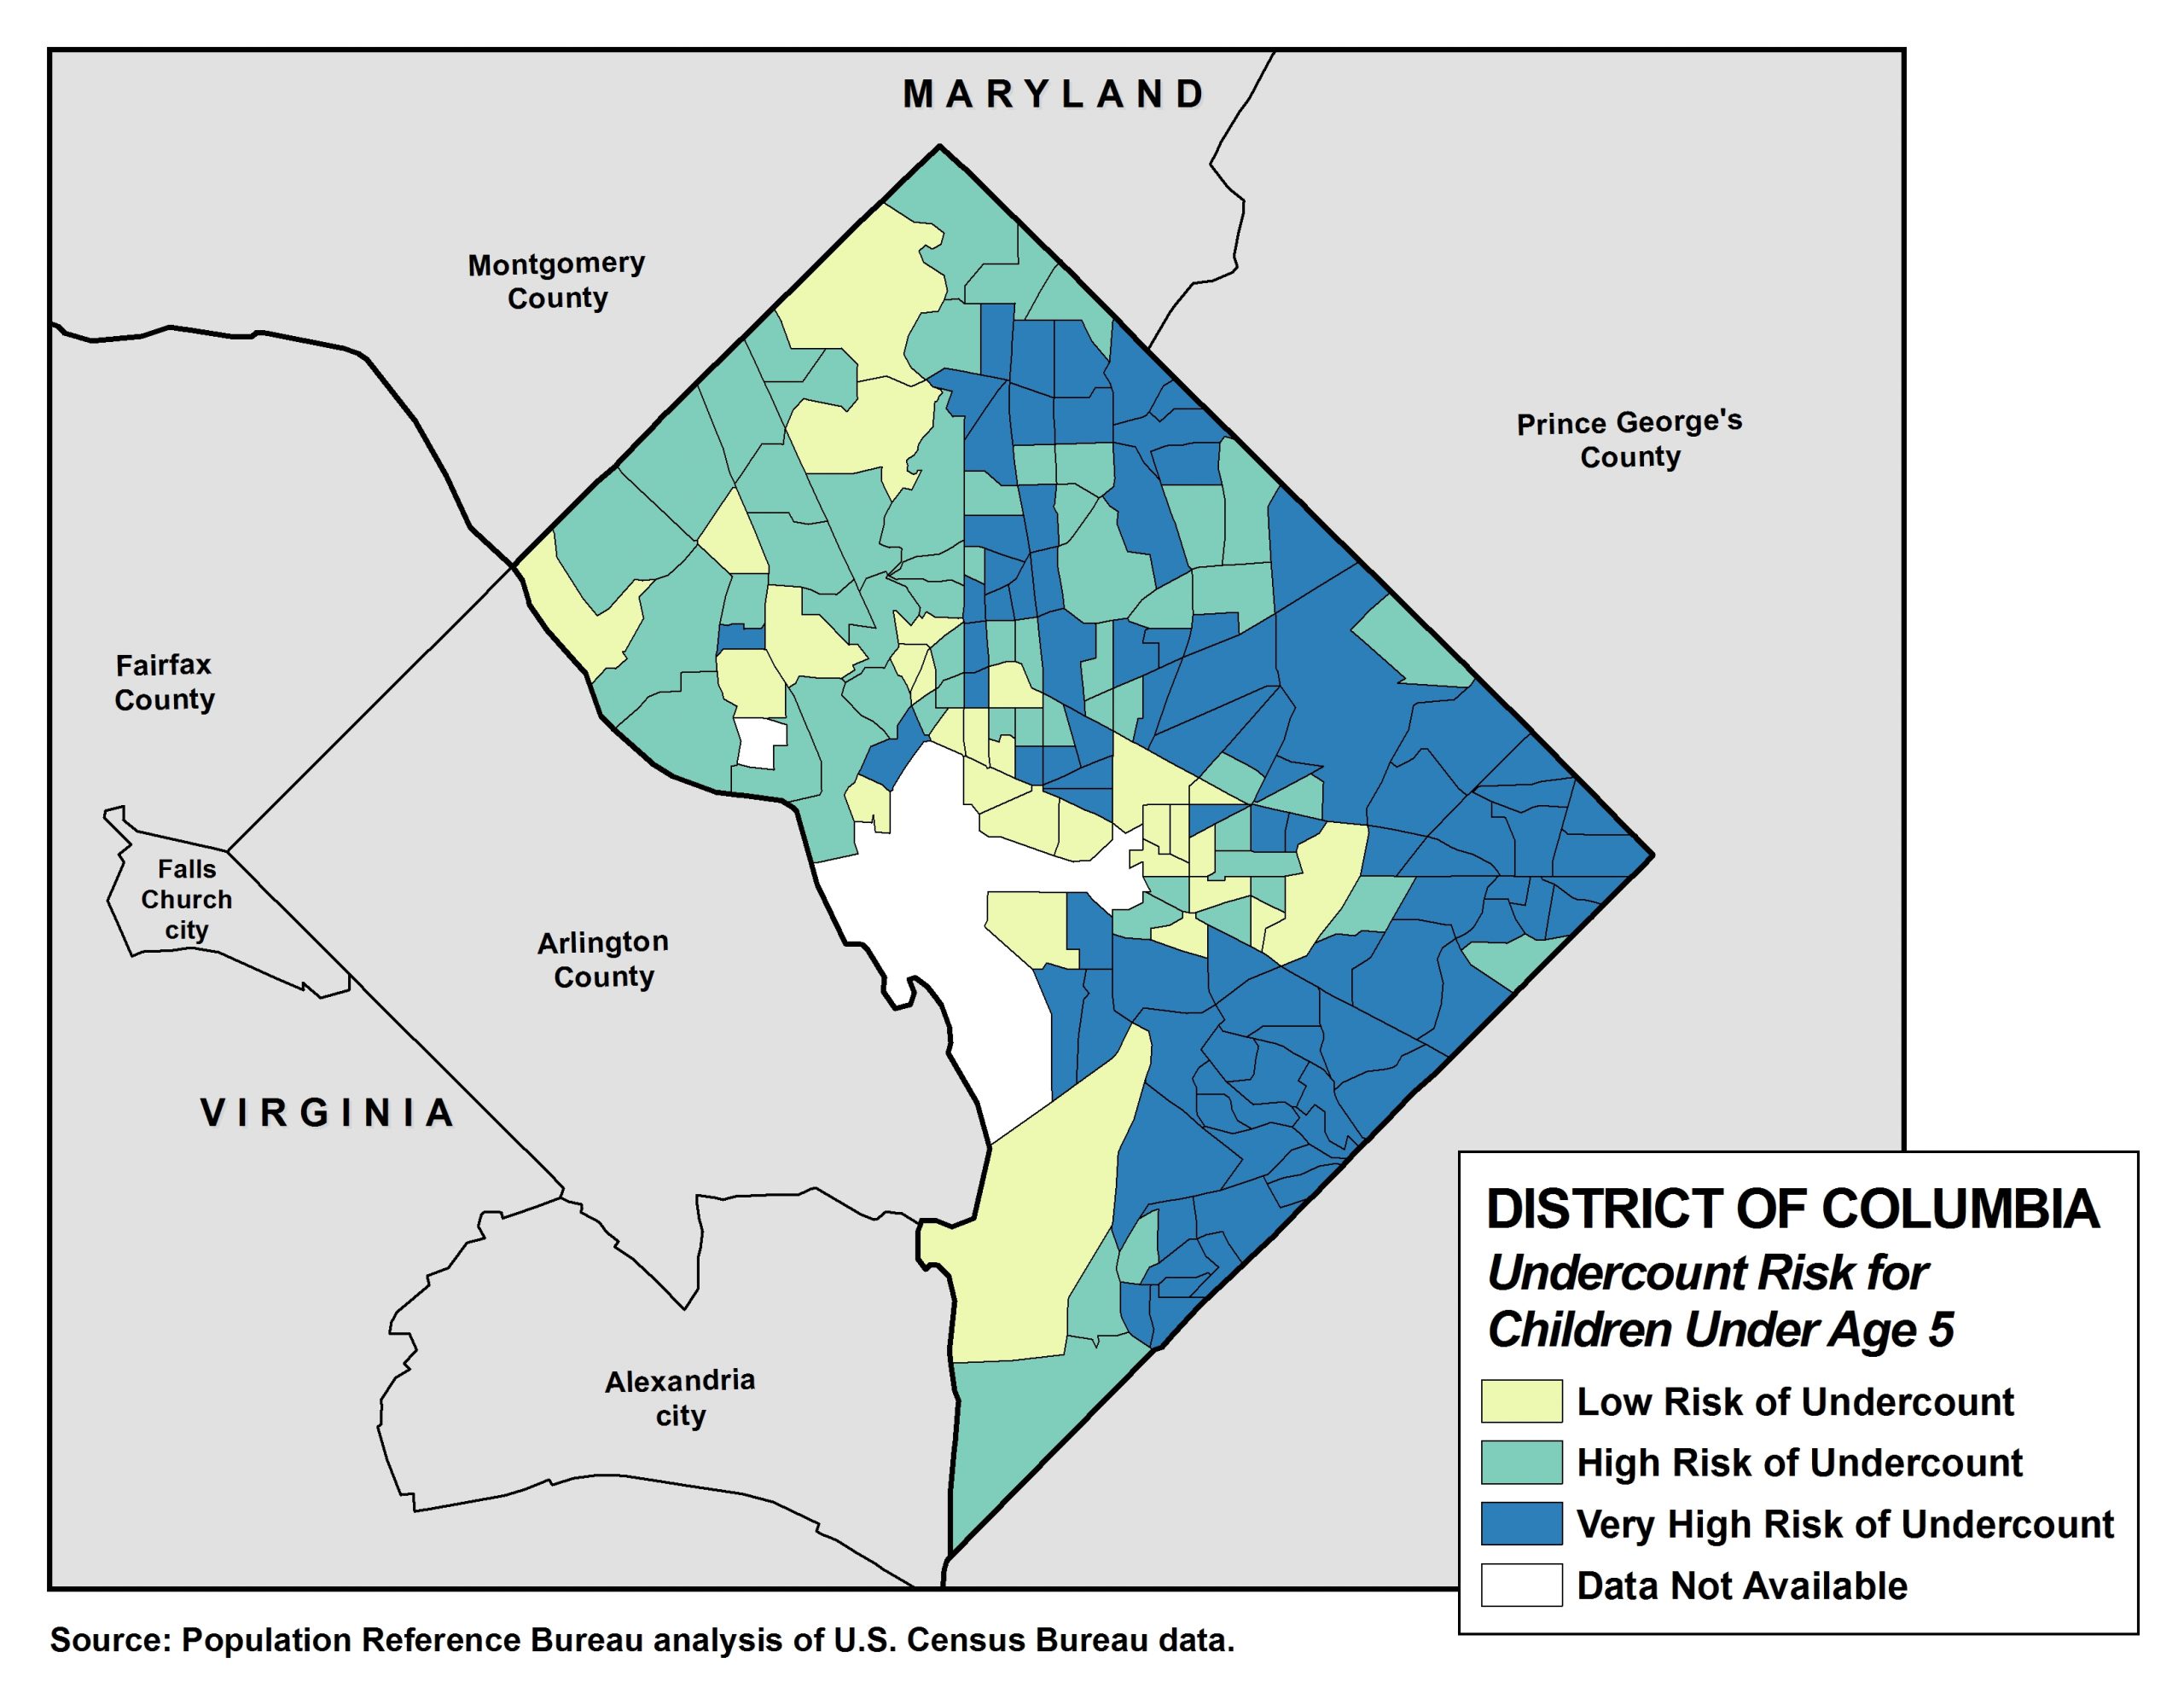
In the District of Columbia, 53% of children under age 5 live in tracts with a very high risk of undercounting young children, according to PRB’s analysis of data from the U.S. Census Bureau.
| wdt_ID | Key Factors Predicting the Undercount of Young Children | United States | DC | All tracts in DC | Tracts in DC with very high risk of undercounting young children |
|---|---|---|---|---|---|
| 1 | Children under age 5 living in families with incomes below 100% of the poverty level (%) | 22 | 22 | 22 | 32 |
| 2 | Adults ages 18 to 34 with less than a high school diploma or GED (%) | 12 | 7 | 7 | 10 |
| 3 | Children under age 18 living in female-headed households with no spouse present (%) | 25 | 45 | 45 | 64 |
| 4 | Children under age 6 living with grandparent householders (%) | 11 | 14 | 14 | 22 |
| 5 | Households that are limited English speaking (%) | 4 | 4 | 4 | 4 |
| 6 | Children under age 6 living in immigrant families (%) | 25 | 26 | 26 | 20 |
| 7 | Population living in renter-occupied housing units (%) | 35 | 56 | 56 | 61 |
Click here for an interactive version of this map from the CUNY Mapping Service at the City University of New York’s Graduate Center.
In Los Angeles County, California, 46% of children under age 5 live in tracts with a very high risk of undercounting young children, according to PRB’s analysis of data from the U.S. Census Bureau.
| wdt_ID | Key Factors Predicting the Undercount of Young Children | United States | CA | All tracts in Los Angeles County, CA | Tracts in Los Angeles County, CA with very high risk |
|---|---|---|---|---|---|
| 1 | Children under age 5 living in families with incomes below 100% of the poverty level (%) | 22 | 22 | 24 | 29 |
| 2 | Adults ages 18 to 34 with less than a high school diploma or GED (%) | 12 | 13 | 13 | 15 |
| 3 | Children under age 18 living in female-headed households with no spouse present (%) | 25 | 23 | 26 | 32 |
| 4 | Children under age 6 living with grandparent householders (%) | 11 | 13 | 16 | 23 |
| 5 | Households that are limited English speaking (%) | 4 | 9 | 13 | 18 |
| 6 | Children under age 6 living in immigrant families (%) | 25 | 44 | 52 | 59 |
| 7 | Population living in renter-occupied housing units (%) | 35 | 45 | 51 | 53 |
Click here for an interactive version of this map from the CUNY Mapping Service at the City University of New York’s Graduate Center.
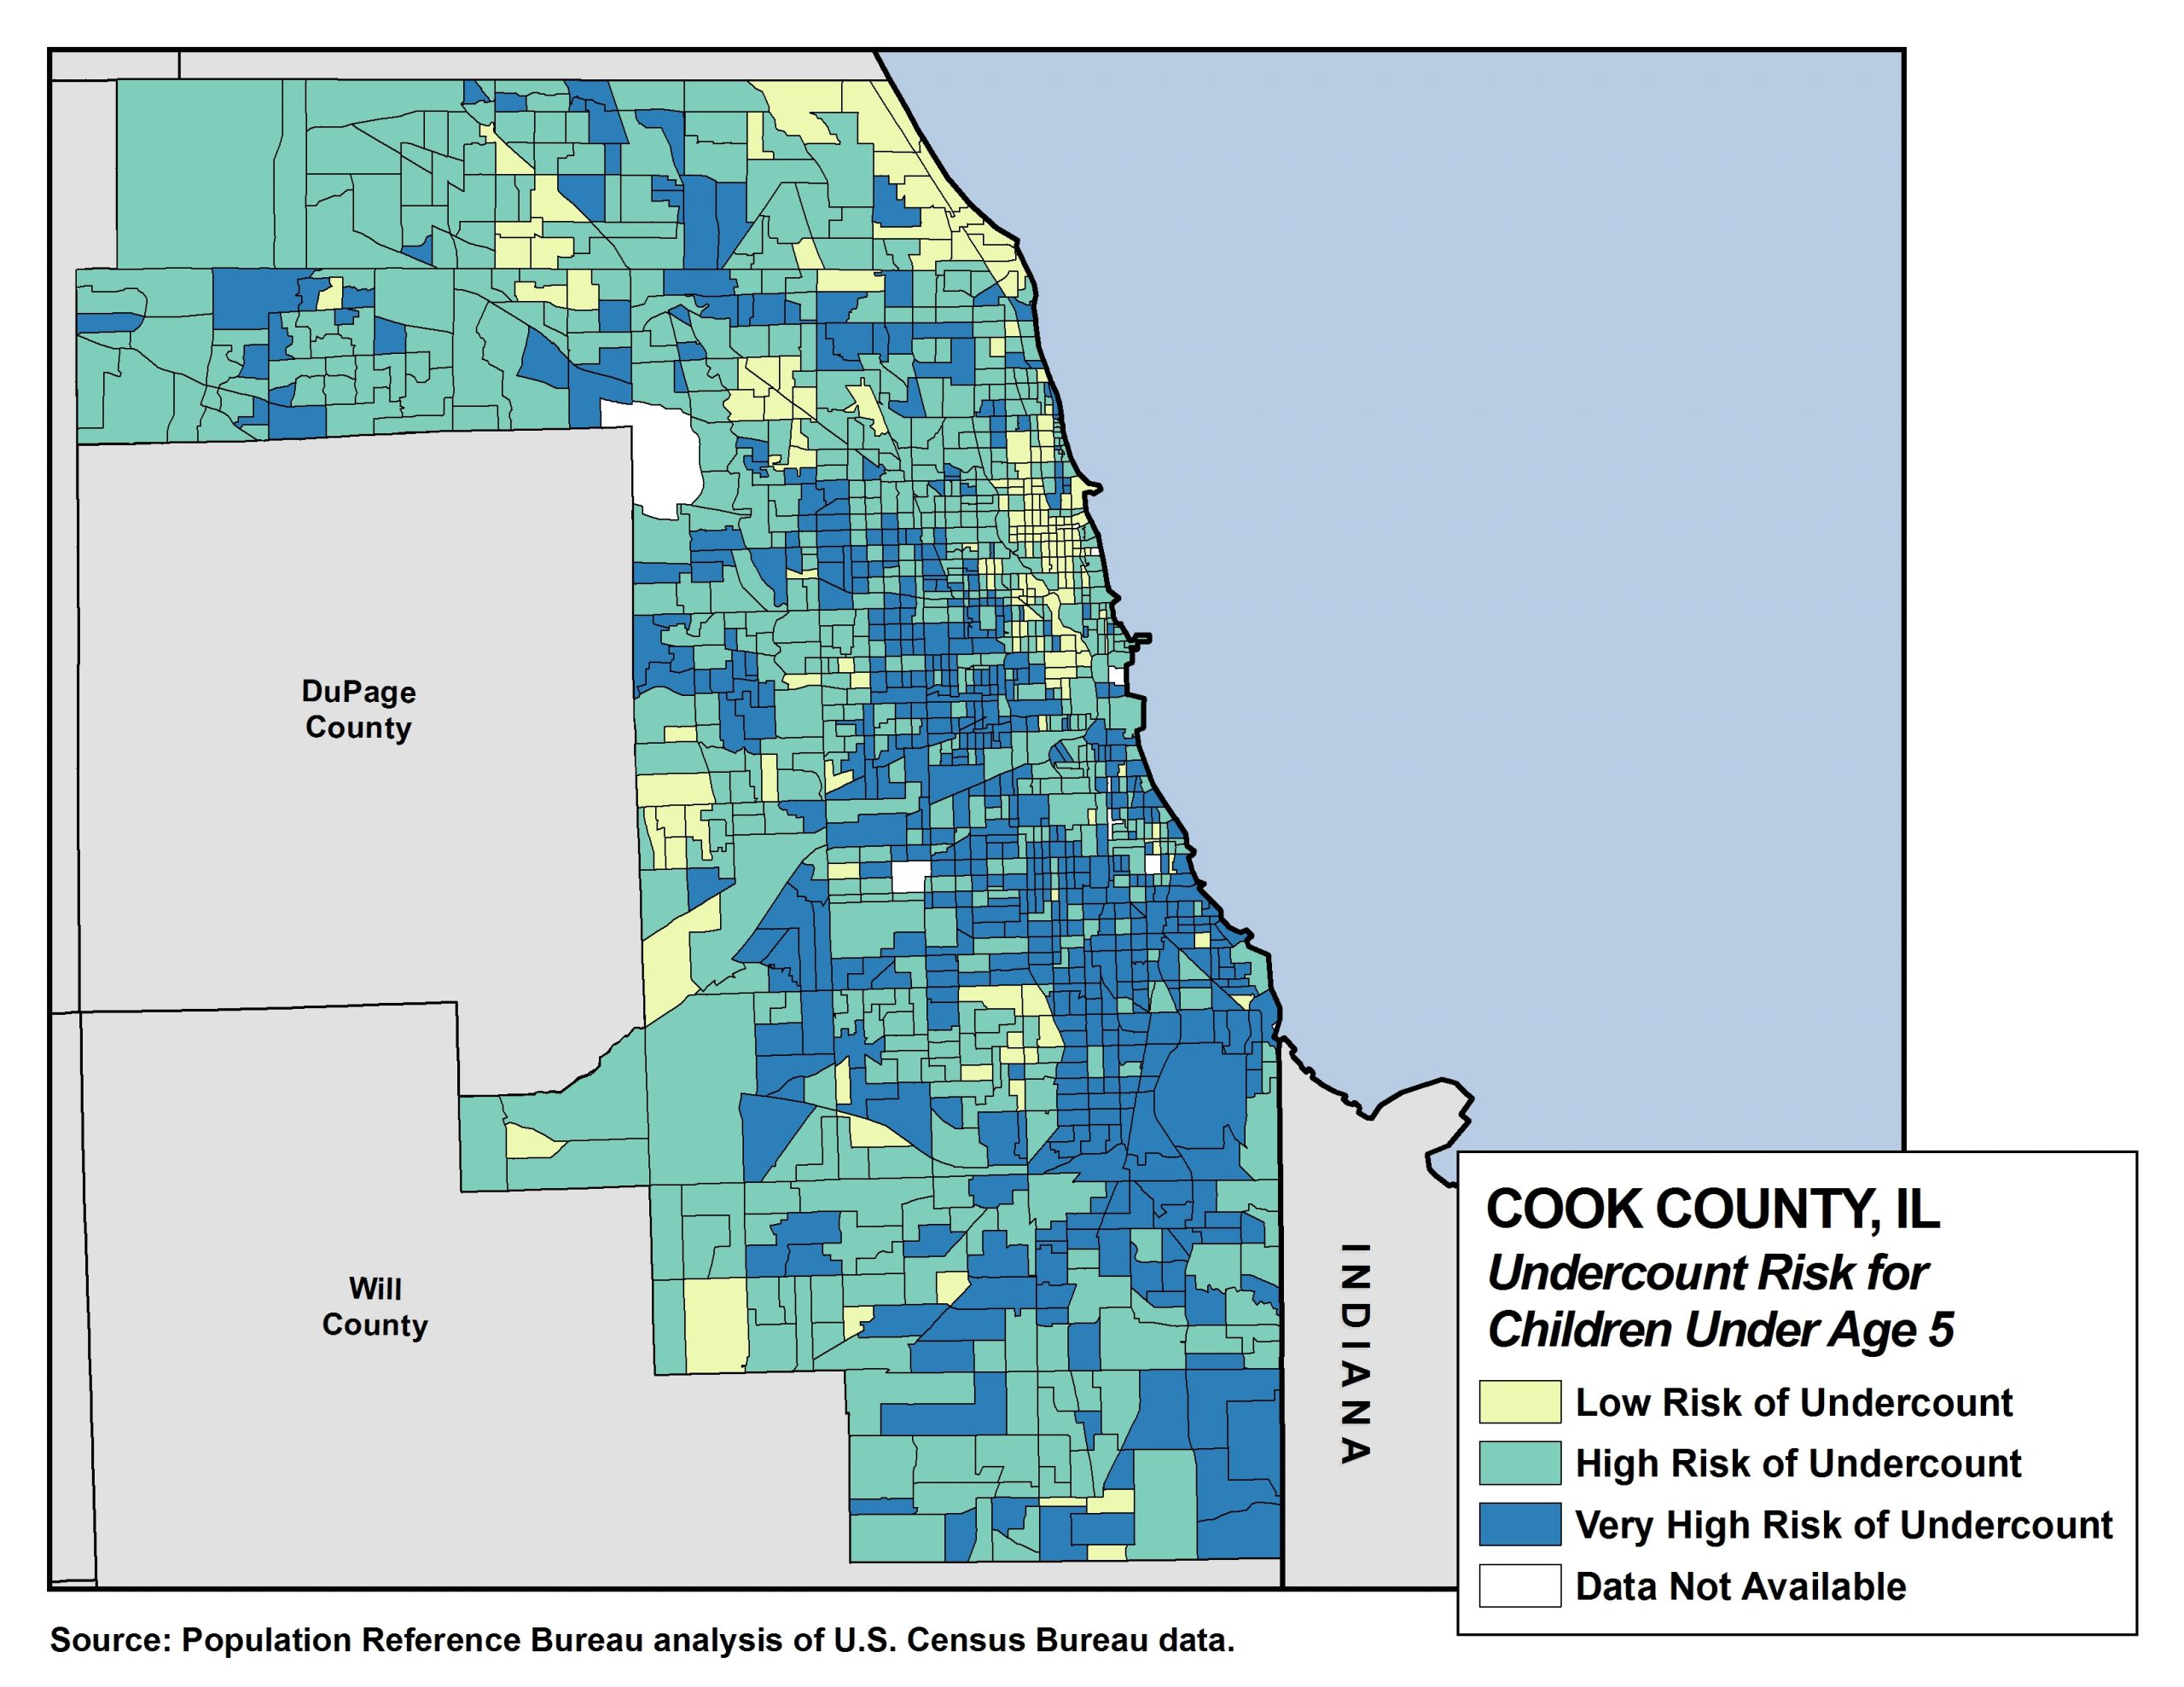
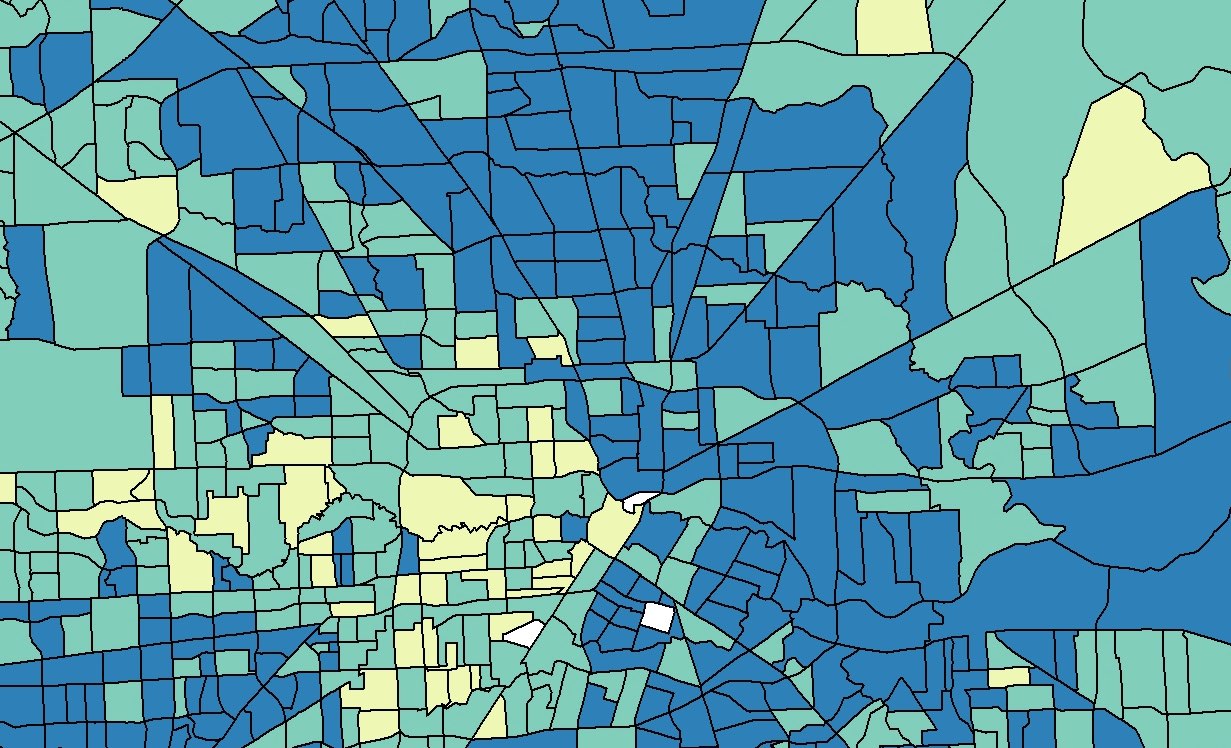
In Cook County, Illinois, 40% of children under age 5 live in tracts with a very high risk of undercounting young children, according to PRB’s analysis of data from the U.S. Census Bureau.
| wdt_ID | Key Factors Predicting the Undercount of Young Children | United States | IL | All tracts in Cook County, IL | Tracts in Cook County, IL w/ very high risk of undercounting |
|---|---|---|---|---|---|
| 1 | Children under age 5 living in families with incomes below 100% of the poverty level (%) | 22 | 21 | 23 | 33 |
| 2 | Adults ages 18 to 34 with less than a high school diploma or GED (%) | 12 | 10 | 10 | 13 |
| 3 | Children under age 18 living in female-headed households with no spouse present (%) | 25 | 25 | 29 | 45 |
| 4 | Children under age 6 living with grandparent householders (%) | 11 | 10 | 12 | 20 |
| 5 | Households that are limited English speaking (%) | 4 | 5 | 8 | 9 |
| 6 | Children under age 6 living in immigrant families (%) | 25 | 26 | 36 | 39 |
| 7 | Population living in renter-occupied housing units (%) | 35 | 31 | 40 | 46 |
Click here for an interactive version of this map from the CUNY Mapping Service at the City University of New York’s Graduate Center.
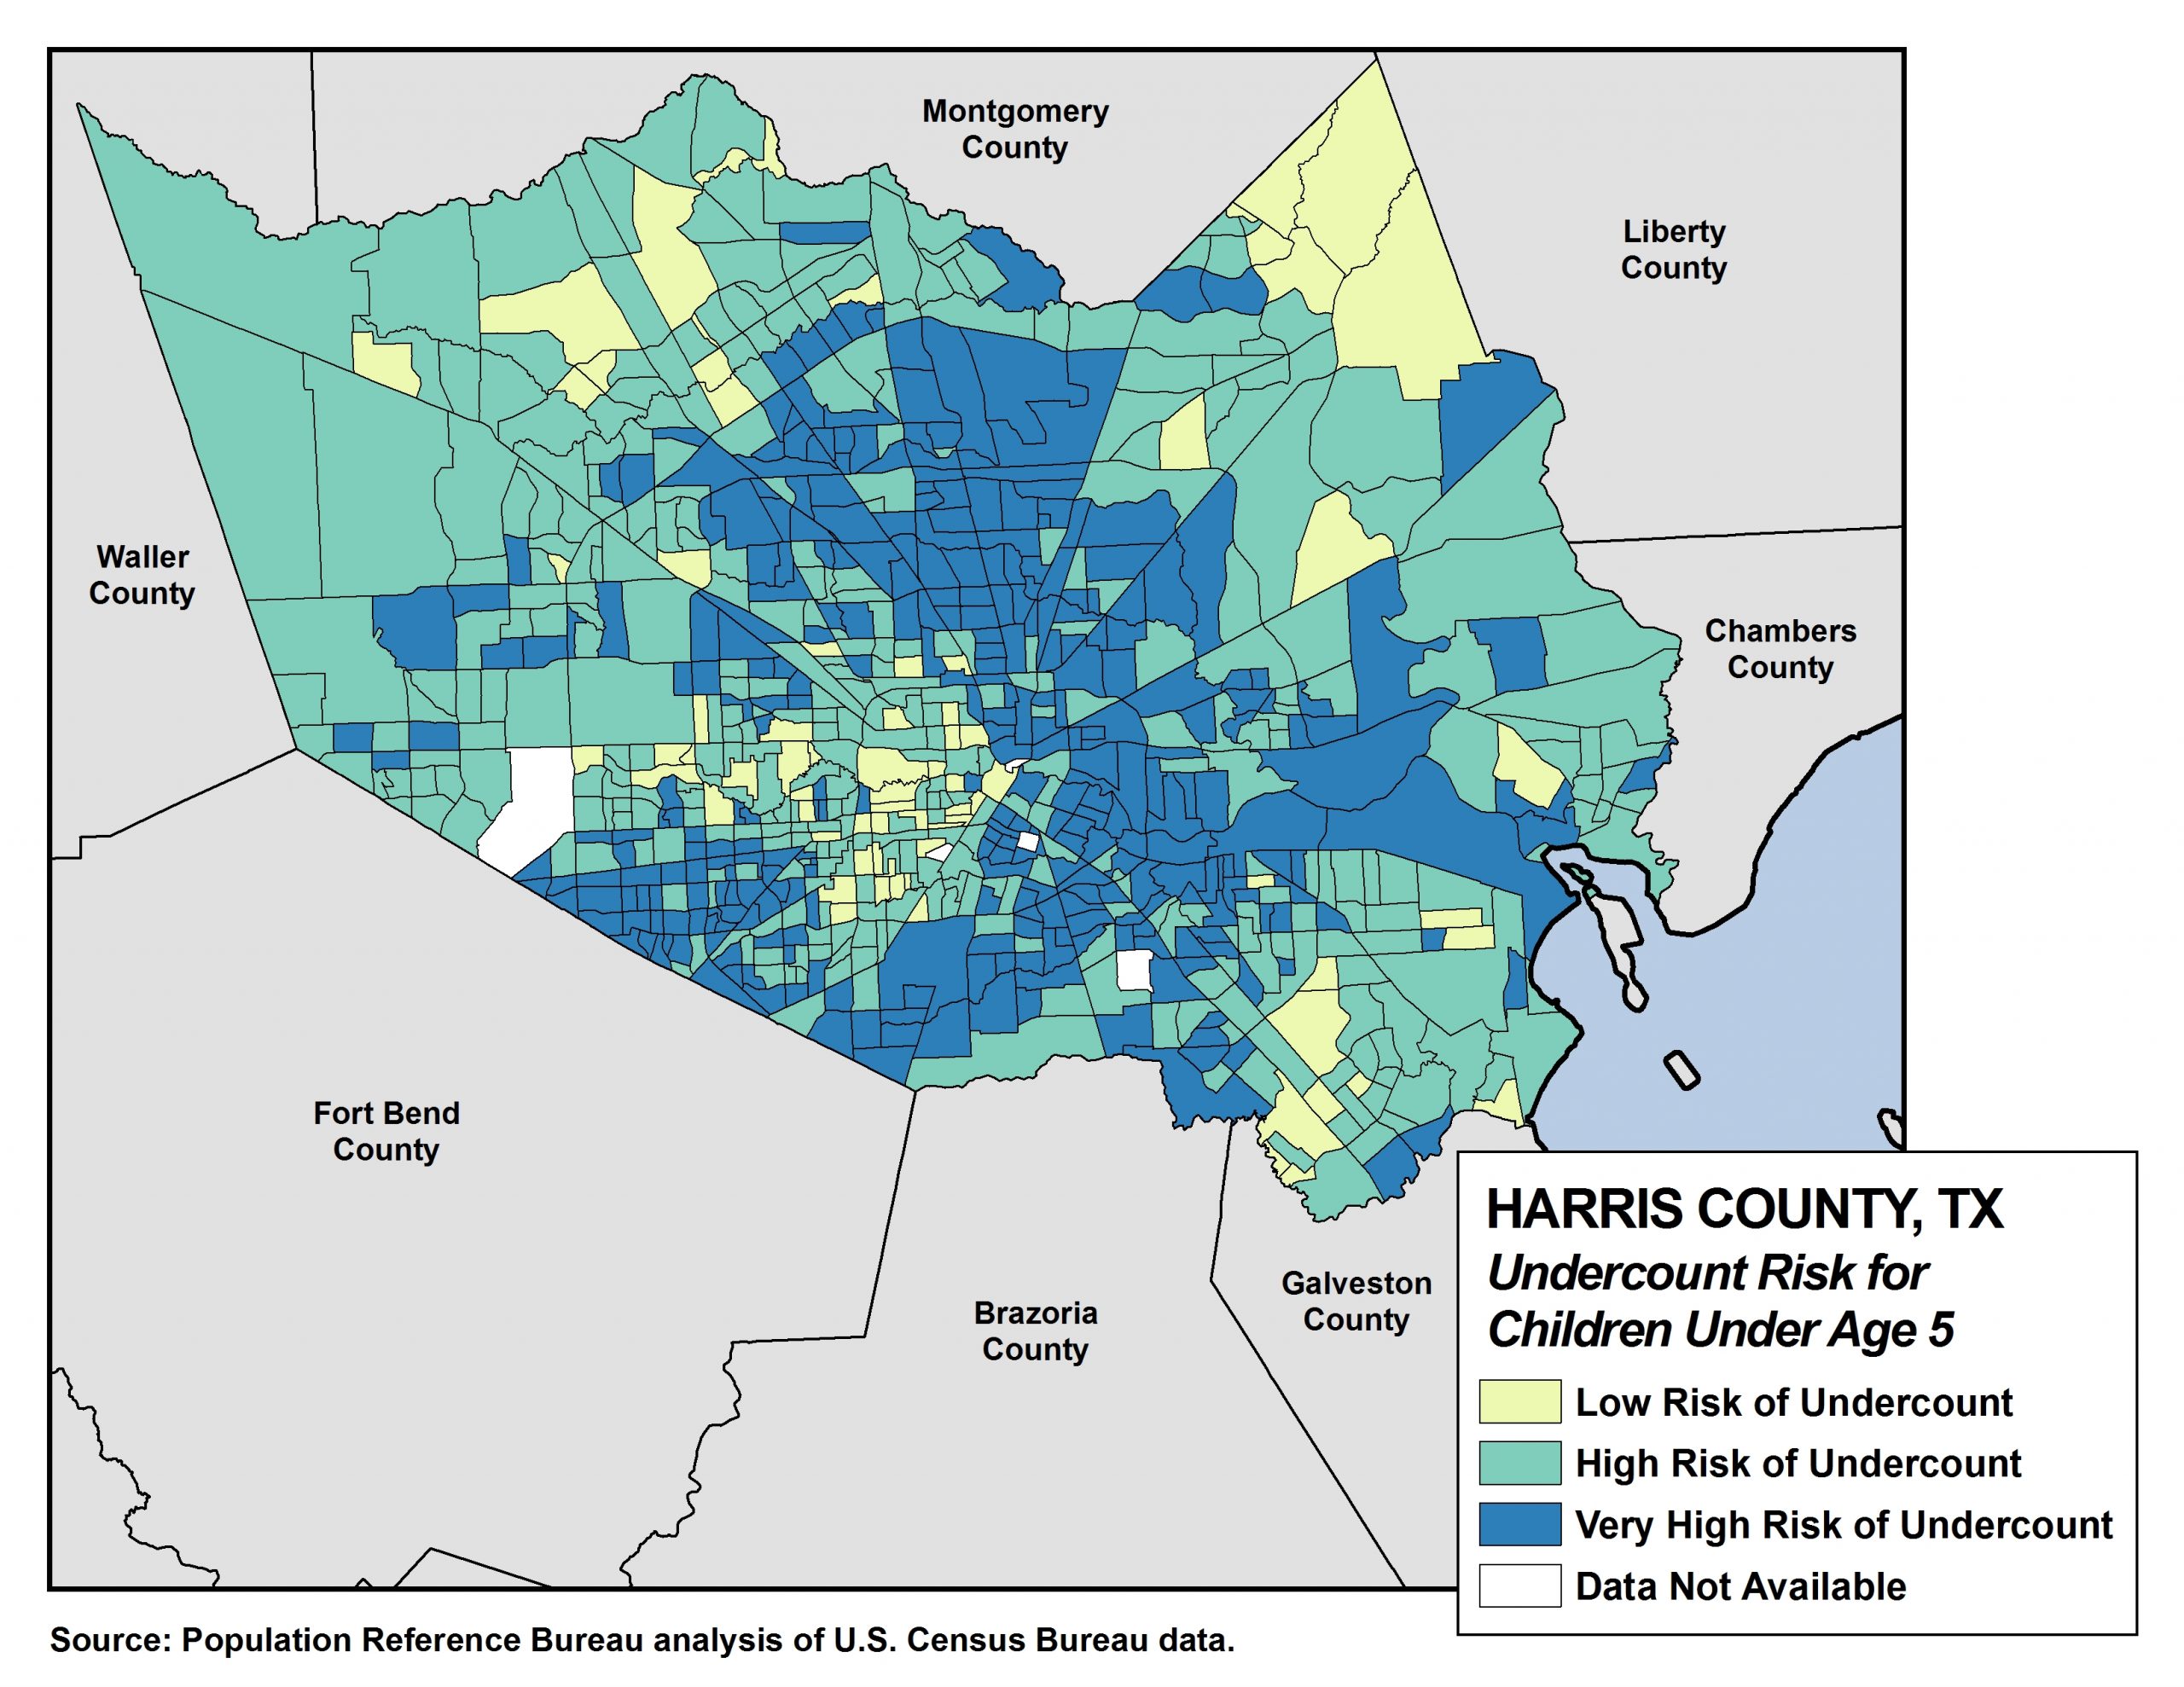
In Harris County, Texas, 40% of children under age 5 live in tracts with a very high risk of undercounting young children, children, according to PRB’s analysis of data from the U.S. Census Bureau.
| wdt_ID | Key Factors Predicting the Undercount of Young Children | United States | TX | All tracts in Harris County, TX | Tracts in Harris County, TX w/ very high risk of undercounting |
|---|---|---|---|---|---|
| 1 | Children under age 5 living in families with incomes below 100% of the poverty level (%) | 22 | 25 | 26 | 38 |
| 2 | Adults ages 18 to 34 with less than a high school diploma or GED (%) | 12 | 14 | 16 | 20 |
| 3 | Children under age 18 living in female-headed households with no spouse present (%) | 25 | 26 | 28 | 39 |
| 4 | Children under age 6 living with grandparent householders (%) | 11 | 13 | 12 | 19 |
| 5 | Households that are limited English speaking (%) | 4 | 8 | 12 | 18 |
| 6 | Children under age 6 living in immigrant families (%) | 25 | 33 | 45 | 54 |
| 7 | Population living in renter-occupied housing units (%) | 35 | 35 | 42 | 47 |
Click here for an interactive version of this map from the CUNY Mapping Service at the City University of New York’s Graduate Center.
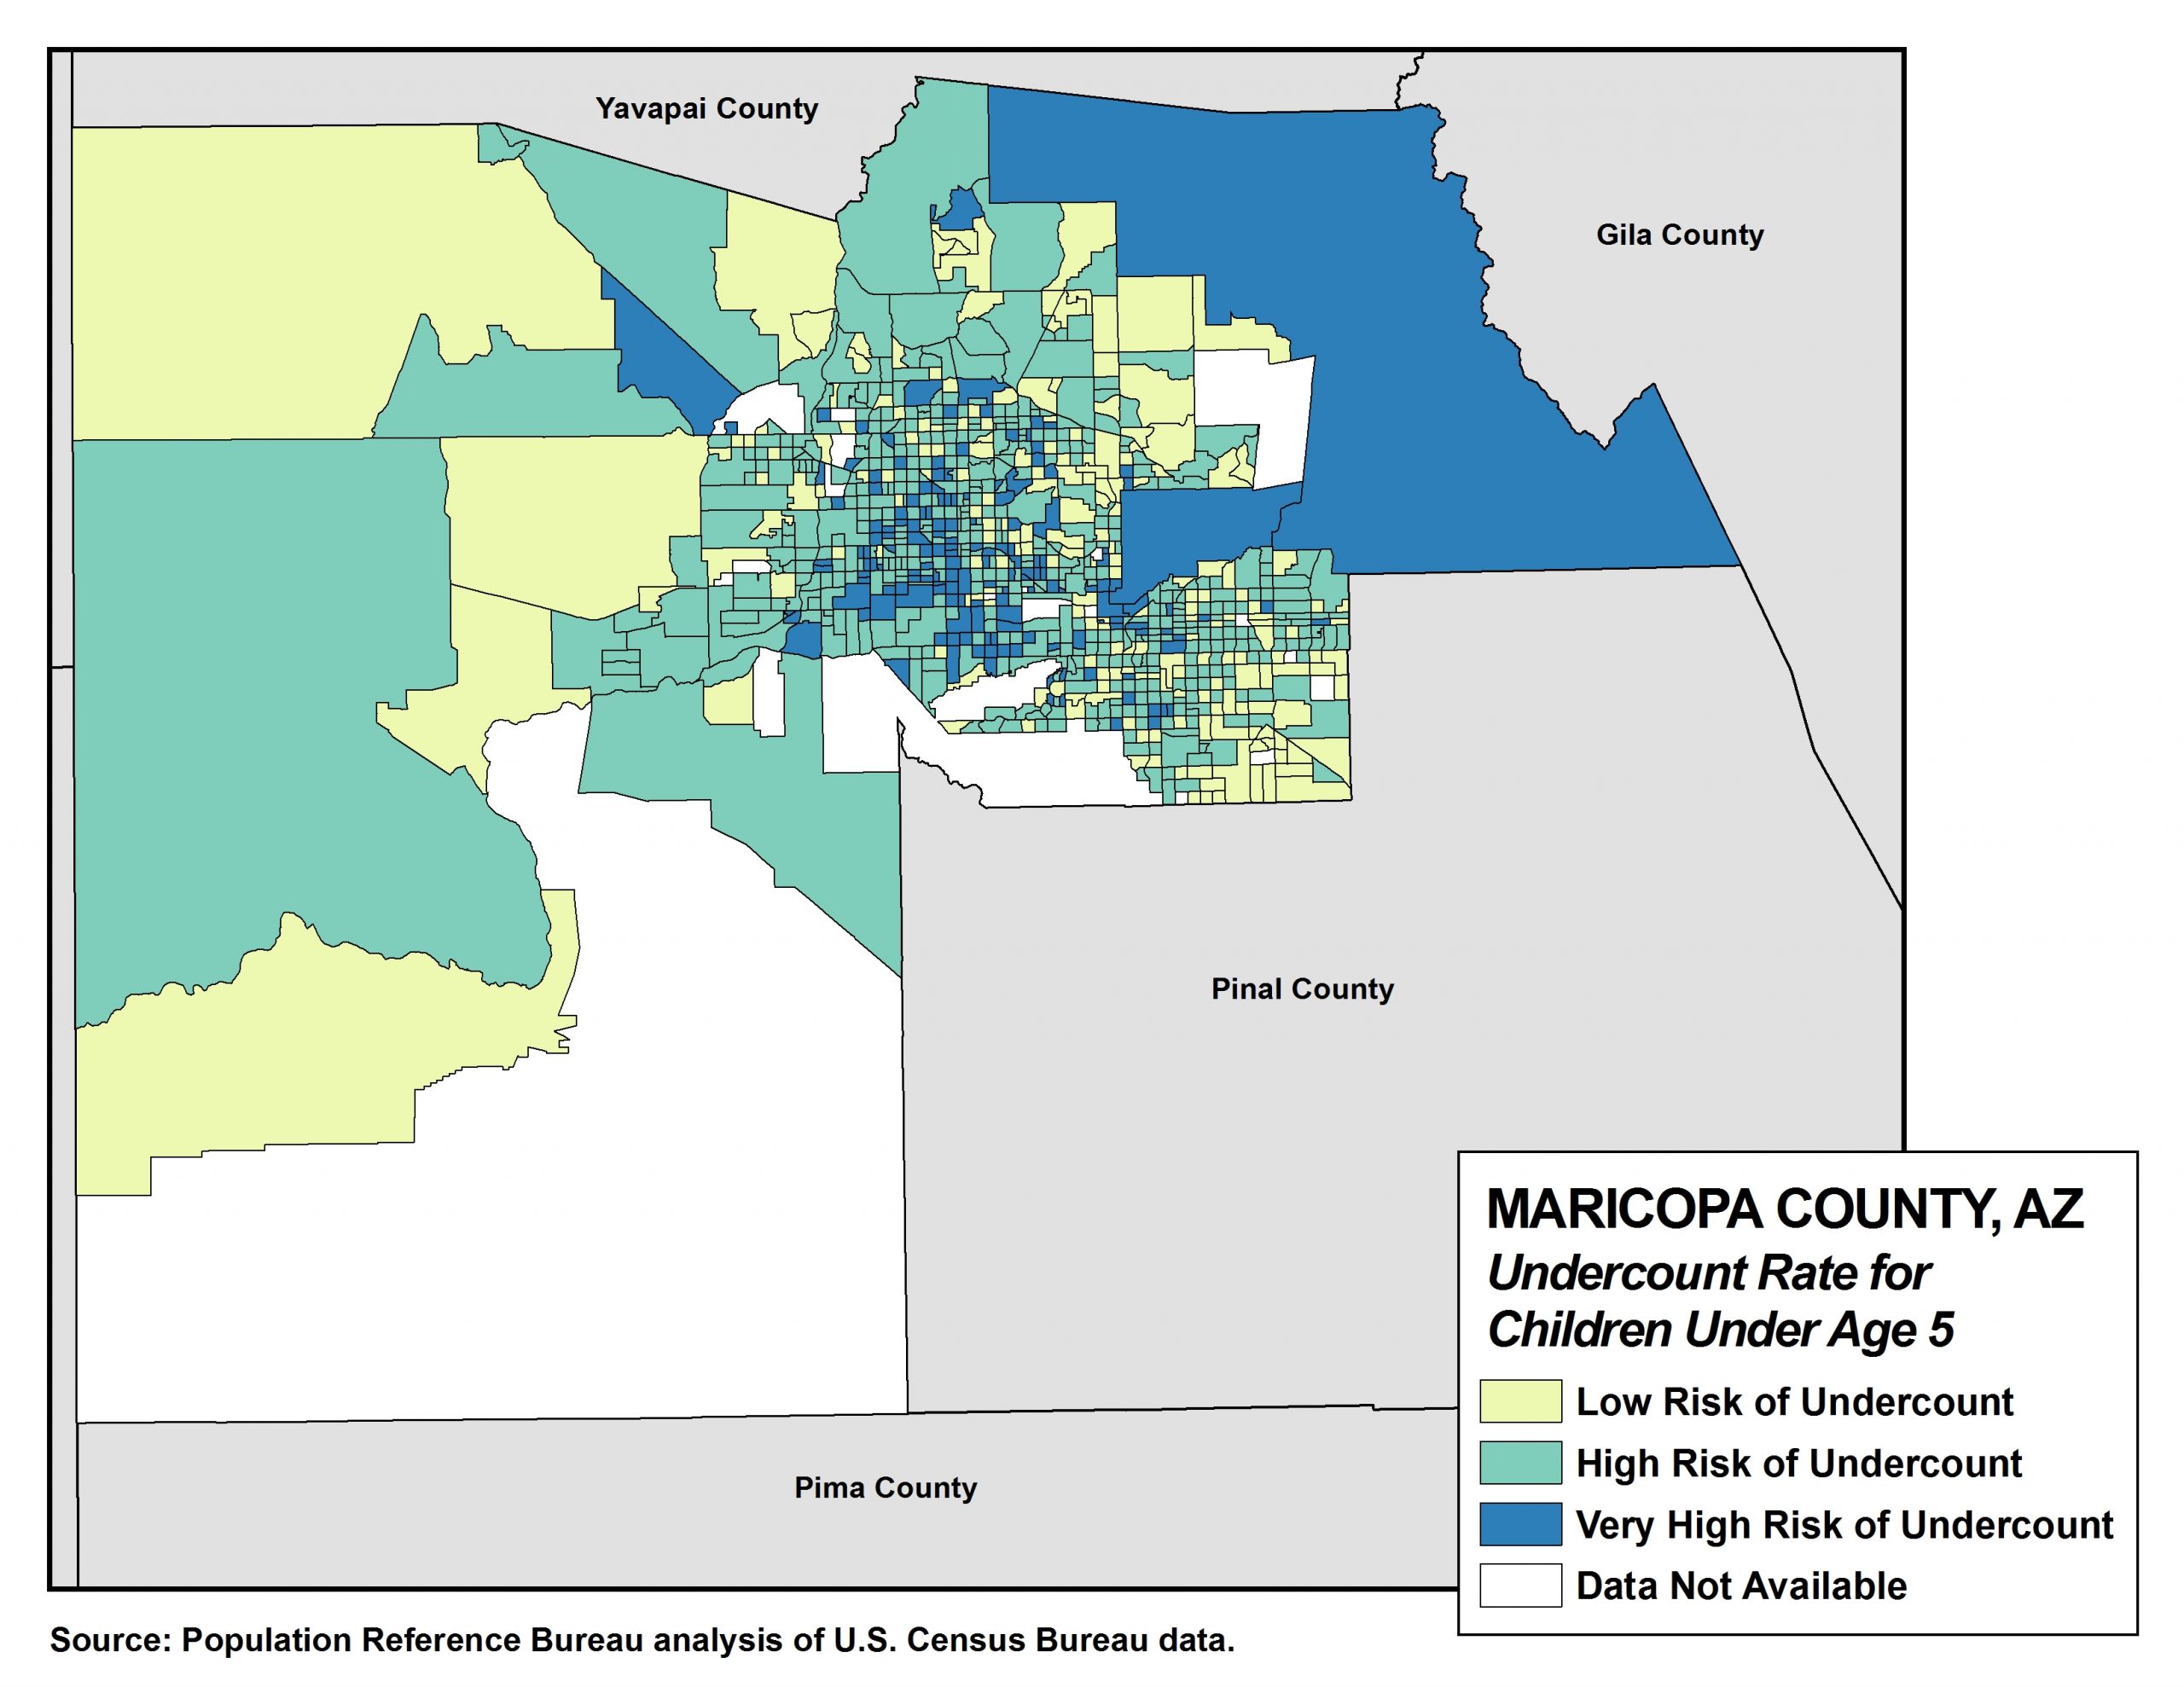
In Maricopa County, Arizona, 20% of children under age 5 live in tracts with a very high risk of undercounting young children, according to PRB’s analysis of data from the U.S. Census Bureau.
| wdt_ID | Key Factors Predicting the Undercount of Young Children | United States | AZ | All tracts in Maricopa County, AZ | Tracts in Maricopa County, Arizonaw/ very high risk of undercounting |
|---|---|---|---|---|---|
| 1 | Children under age 5 living in families with incomes below 100% of the poverty level (%) | 22 | 26 | 25 | 42 |
| 2 | Adults ages 18 to 34 with less than a high school diploma or GED (%) | 12 | 14 | 14 | 18 |
| 3 | Children under age 18 living in female-headed households with no spouse present (%) | 25 | 26 | 25 | 42 |
| 4 | Children under age 6 living with grandparent householders (%) | 11 | 13 | 11 | 19 |
| 5 | Households that are limited English speaking (%) | 4 | 4 | 4 | 9 |
| 6 | Children under age 6 living in immigrant families (%) | 25 | 26 | 30 | 48 |
| 7 | Population living in renter-occupied housing units (%) | 35 | 37 | 39 | 50 |
| Key Factors Predicting the Undercount of Young Children | United States | AZ | All tracts in Maricopa County, AZ | Tracts in Maricopa County, Arizonaw/ very high risk of undercounting |
Click here for an interactive version of this map from the CUNY Mapping Service at the City University of New York’s Graduate Center.
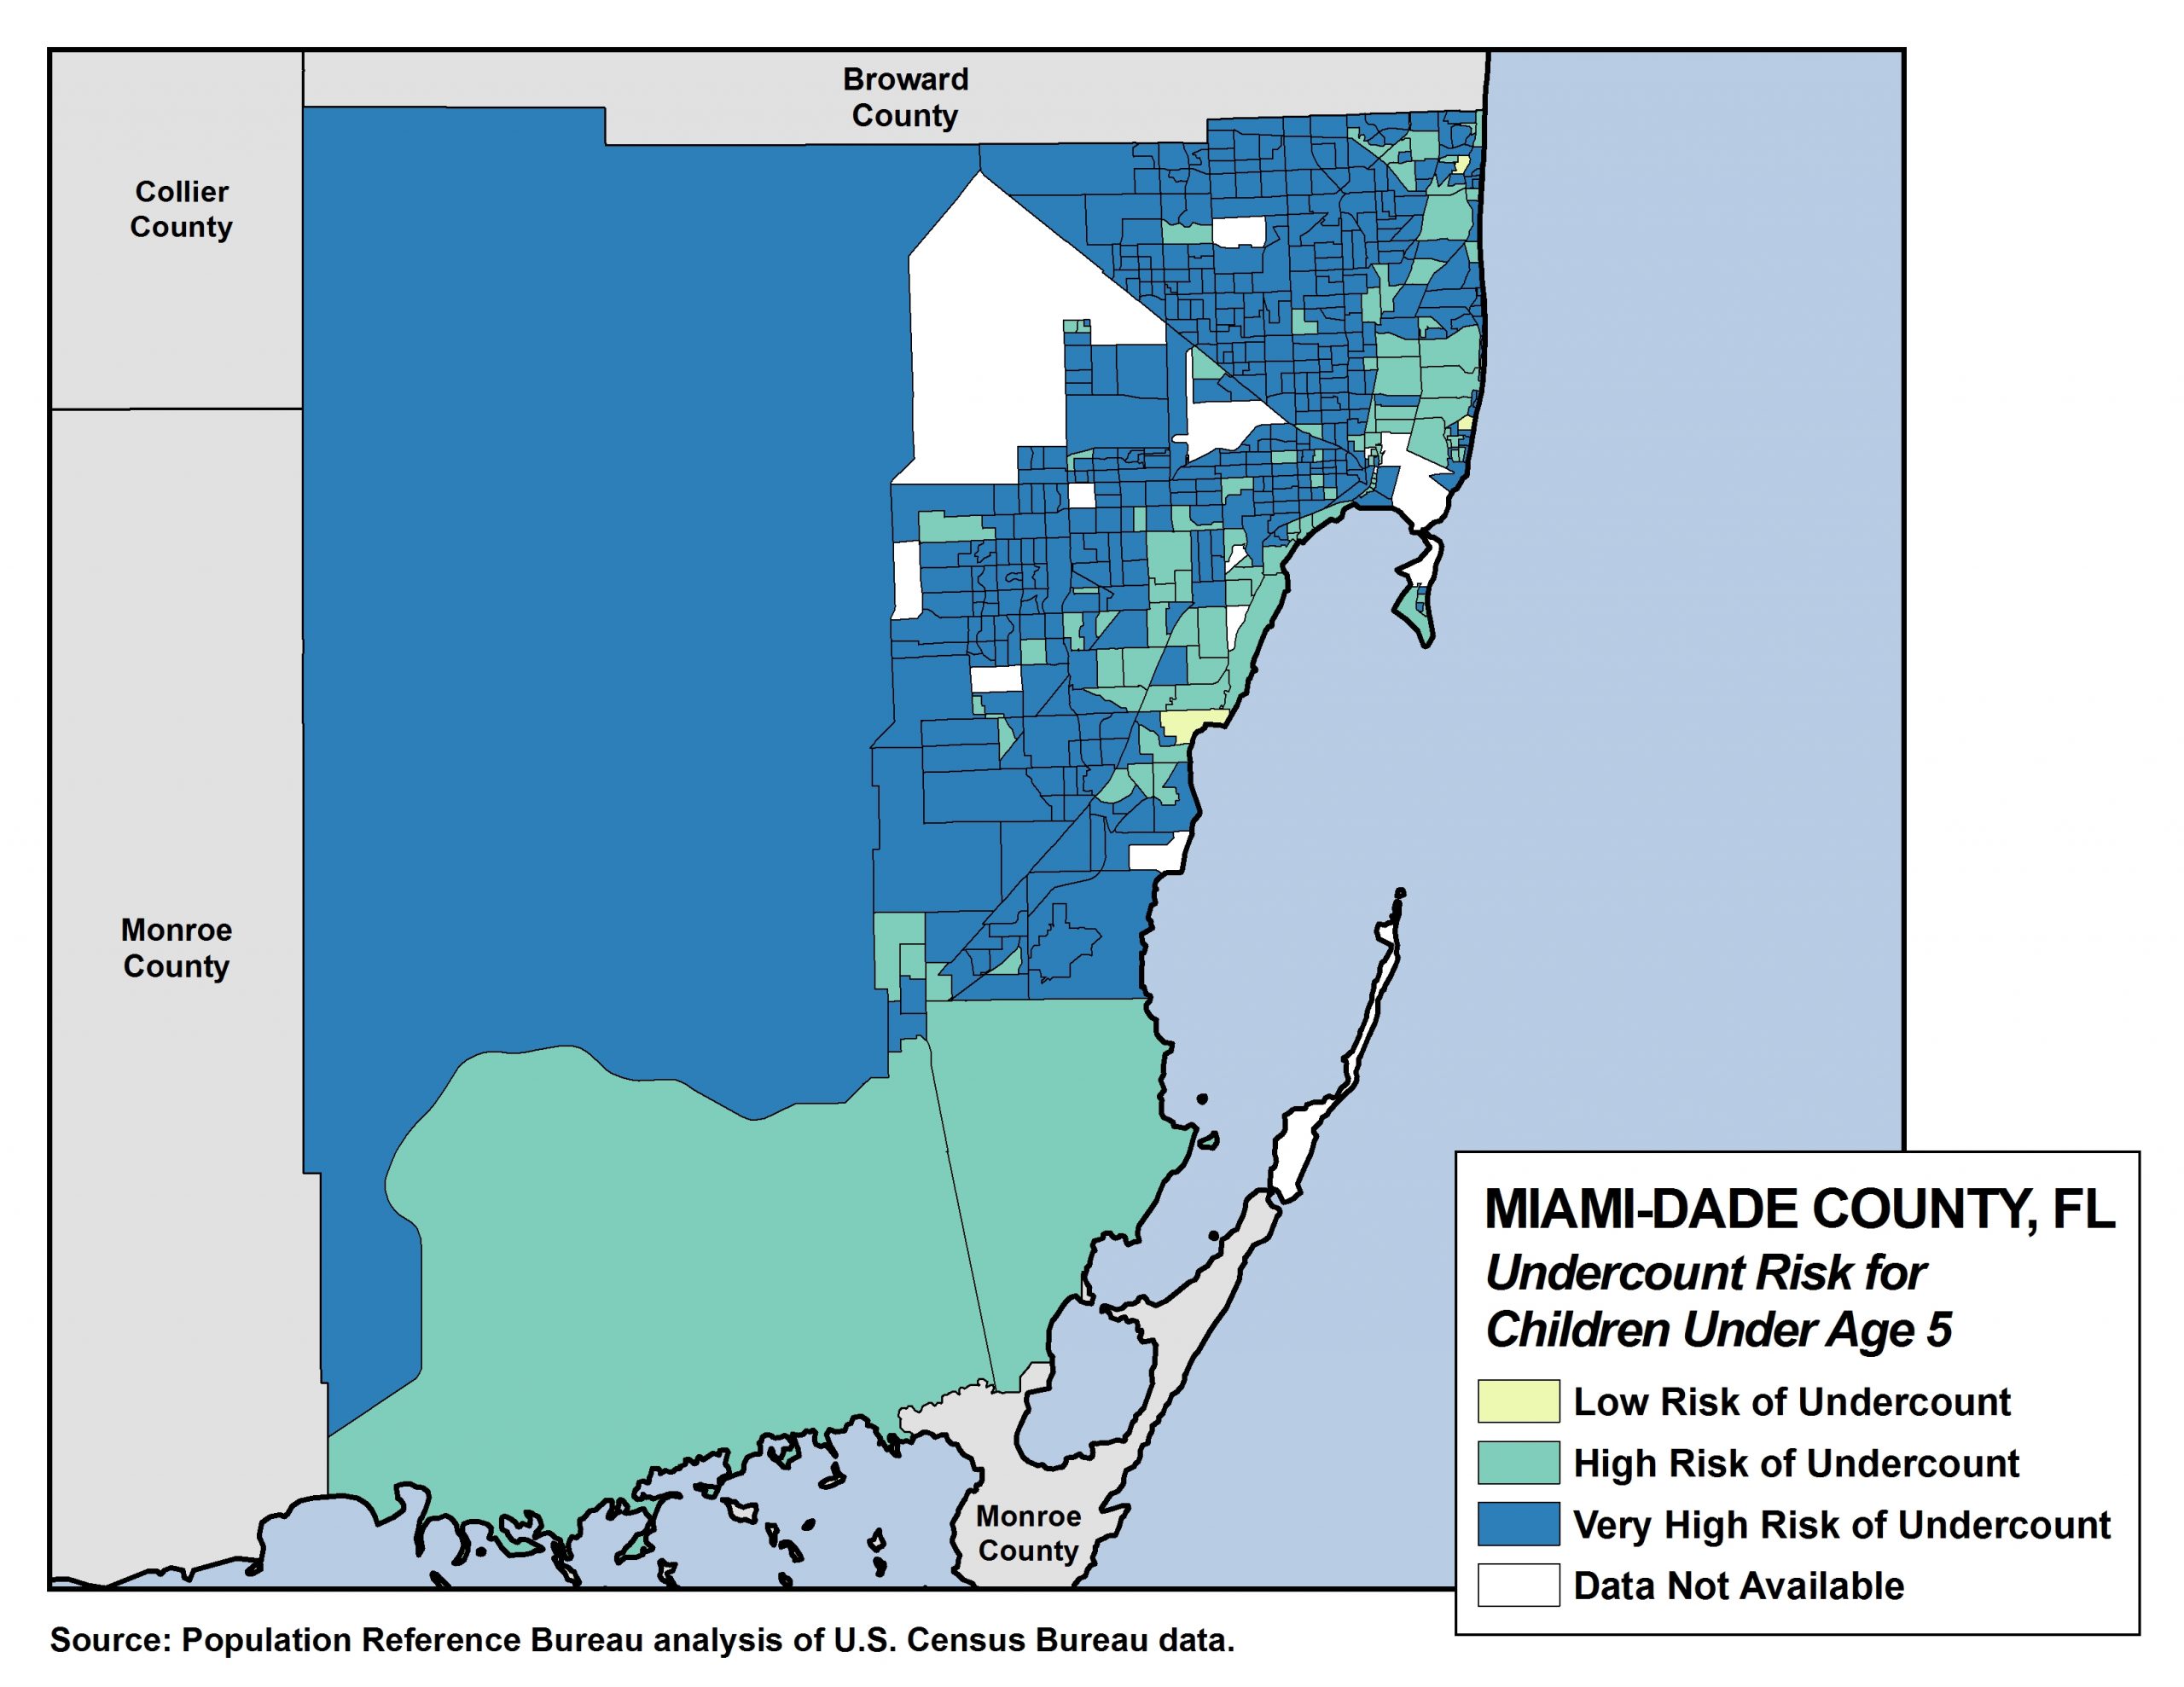
In Miami-Dade County, Florida, 84% of children under age 5 live in tracts with a very high risk of undercounting young children, according to PRB’s analysis of data from the U.S. Census Bureau.
| wdt_ID | Key Factors Predicting the Undercount of Young Children | United States | FL | All tracts in Miami-Dade County, FL | Tracts in Miami-Dade County, FL w/ very high risk of undercounting |
|---|---|---|---|---|---|
| 1 | Children under age 5 living in families with incomes below 100% of the poverty level (%) | 22 | 25 | 26 | 28 |
| 2 | Adults ages 18 to 34 with less than a high school diploma or GED (%) | 12 | 13 | 12 | 12 |
| 3 | Children under age 18 living in female-headed households with no spouse present (%) | 25 | 29 | 32 | 35 |
| 4 | Children under age 6 living with grandparent householders (%) | 11 | 12 | 14 | 15 |
| 5 | Households that are limited English speaking (%) | 4 | 7 | 26 | 28 |
| 6 | Children under age 6 living in immigrant families (%) | 25 | 33 | 64 | 66 |
| 7 | Population living in renter-occupied housing units (%) | 35 | 36 | 45 | 45 |
| Key Factors Predicting the Undercount of Young Children | United States | FL | All tracts in Miami-Dade County, FL | Tracts in Miami-Dade County, FL w/ very high risk of undercounting |
Click here for an interactive version of this map from the CUNY Mapping Service at the City University of New York’s Graduate Center.
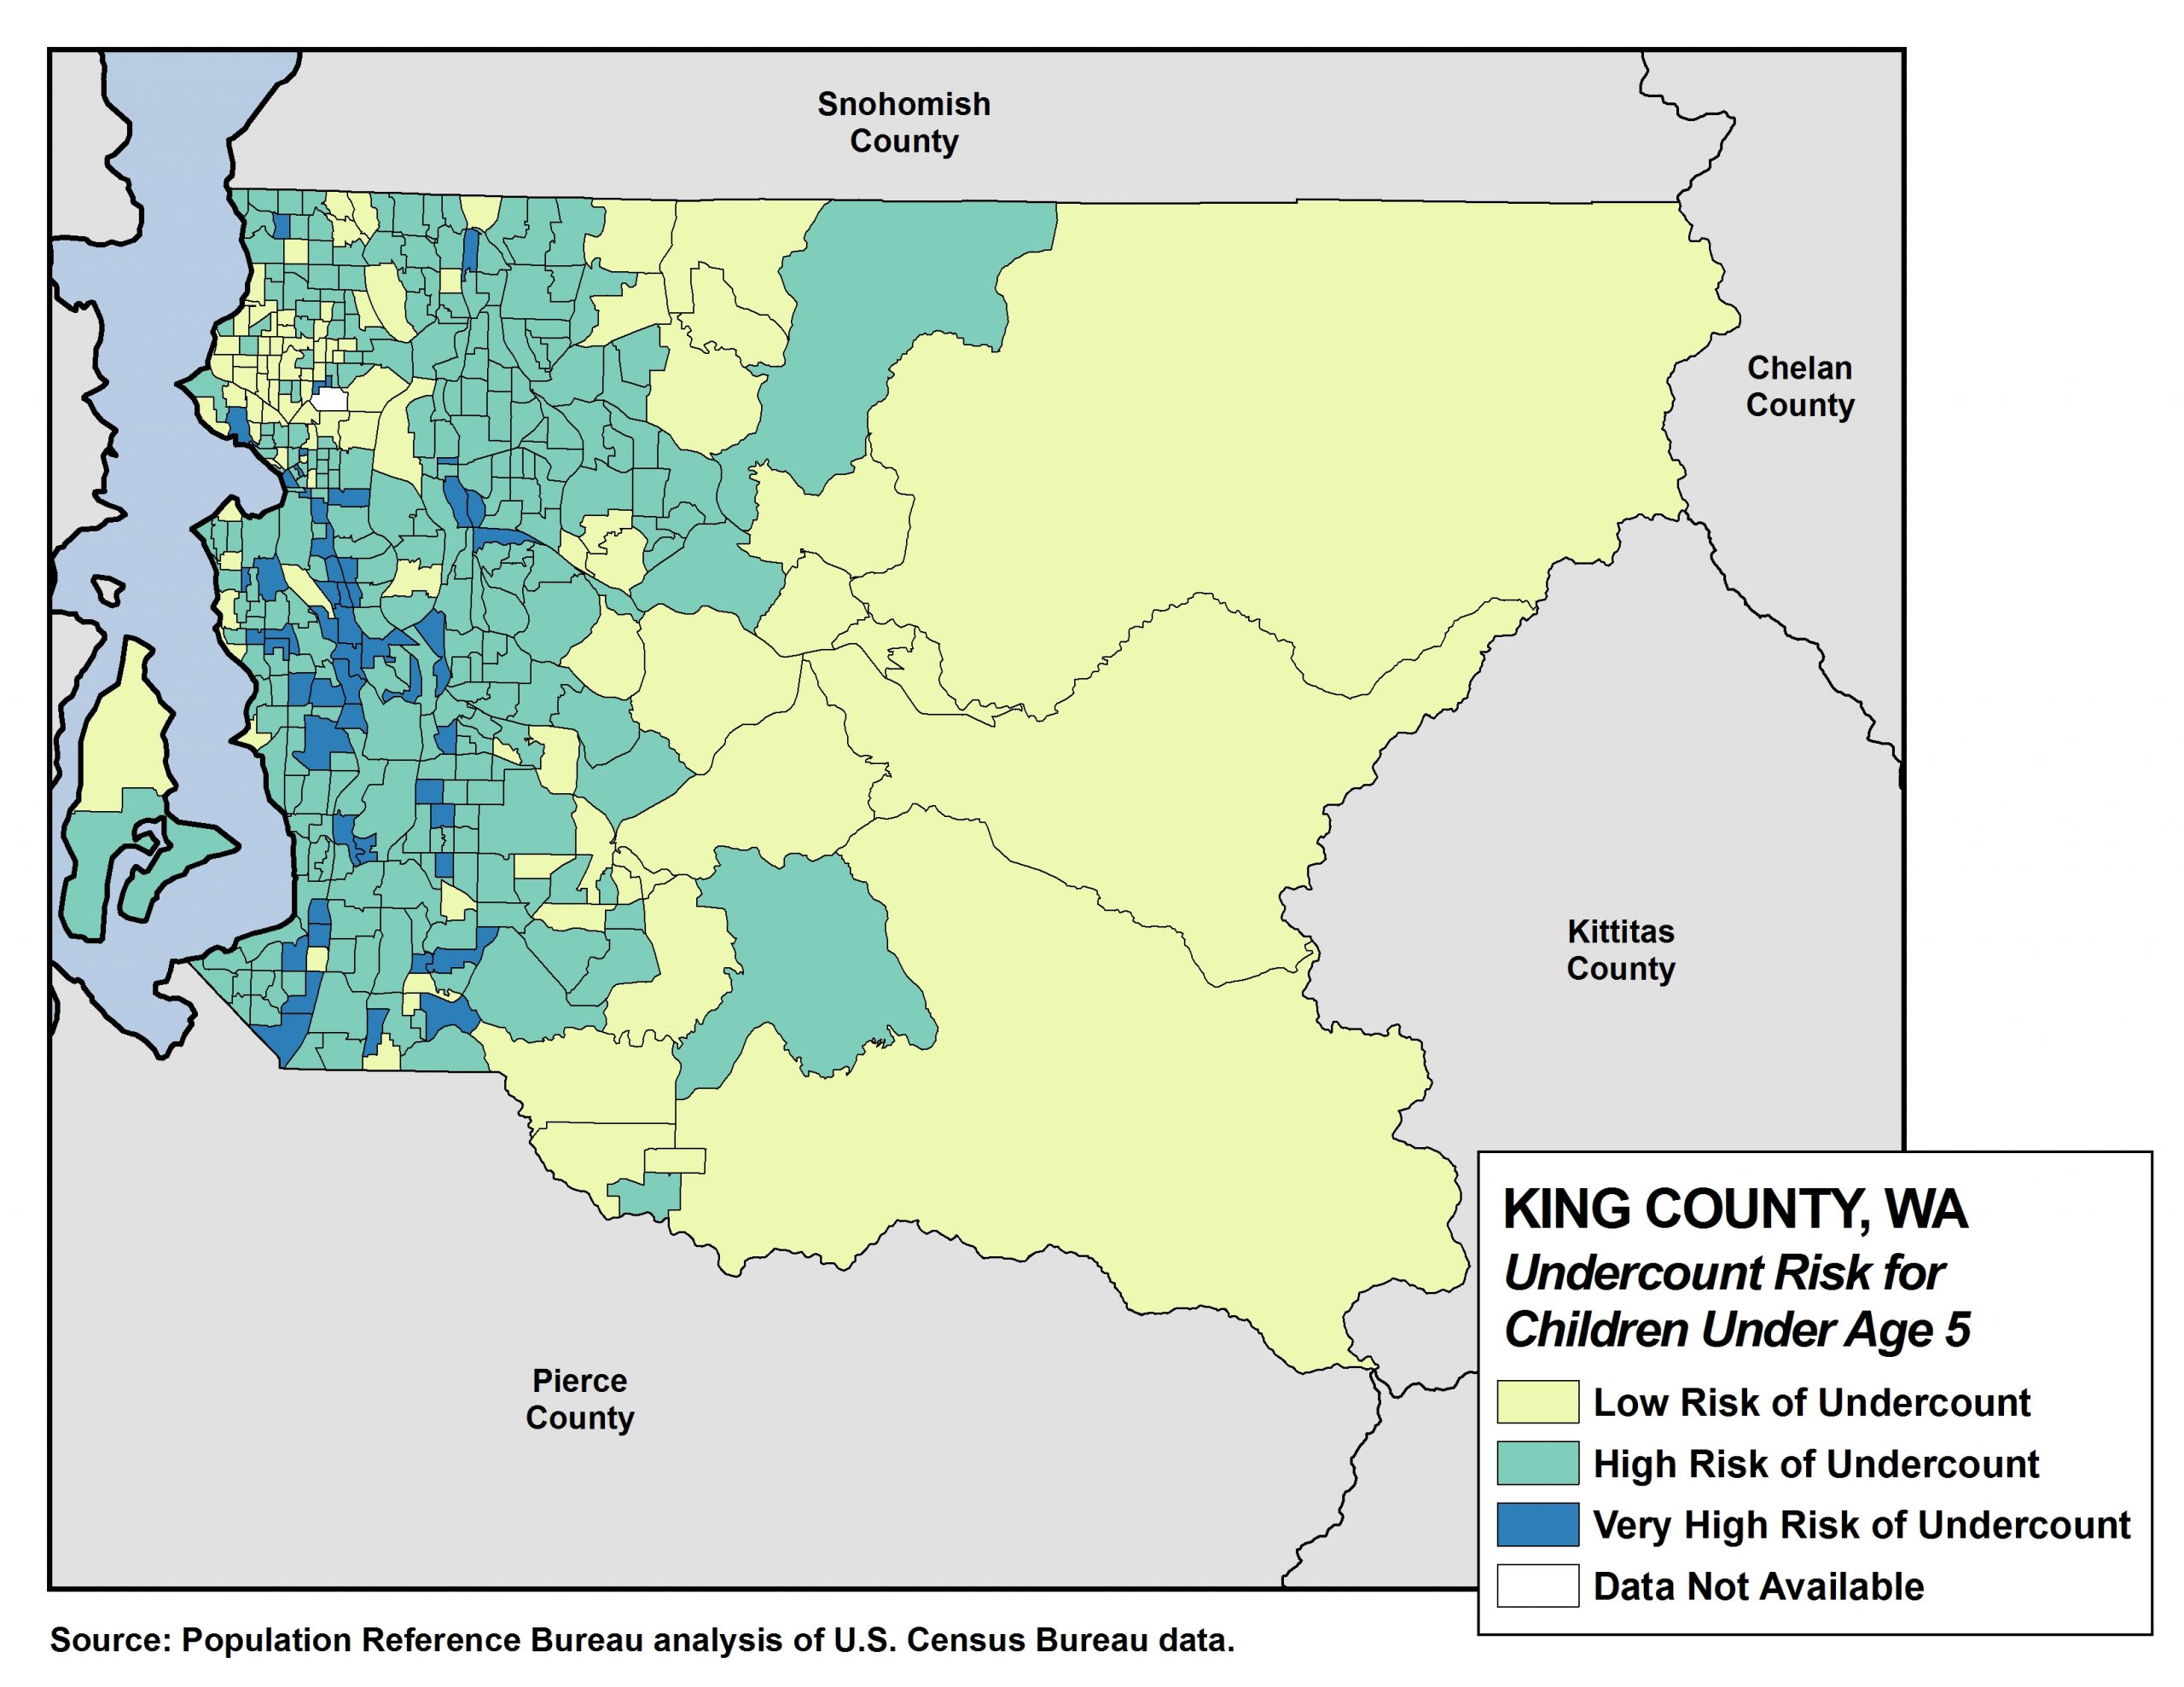
In King County, Washington, 12% of children under age 5 live in tracts with a very high risk of undercounting young children, according to PRB’s analysis of data from the U.S. Census Bureau.
| wdt_ID | Key Factors Predicting the Undercount of Young Children | United States | WA | All tracts in King County, WA | Tracts in King County, WA w/ very high risk of undercounting |
|---|---|---|---|---|---|
| 1 | Children under age 5 living in families with incomes below 100% of the poverty level (%) | 22 | 17 | 12 | 27 |
| 2 | Adults ages 18 to 34 with less than a high school diploma or GED (%) | 12 | 11 | 8 | 10 |
| 3 | Children under age 18 living in female-headed households with no spouse present (%) | 25 | 20 | 17 | 38 |
| 4 | Children under age 6 living with grandparent householders (%) | 11 | 8 | 6 | 14 |
| 5 | Households that are limited English speaking (%) | 4 | 4 | 6 | 11 |
| 6 | Children under age 6 living in immigrant families (%) | 25 | 29 | 43 | 60 |
| 7 | Population living in renter-occupied housing units (%) | 35 | 35 | 39 | 50 |
Click here for an interactive version of this map from the CUNY Mapping Service at the City University of New York’s Graduate Center.
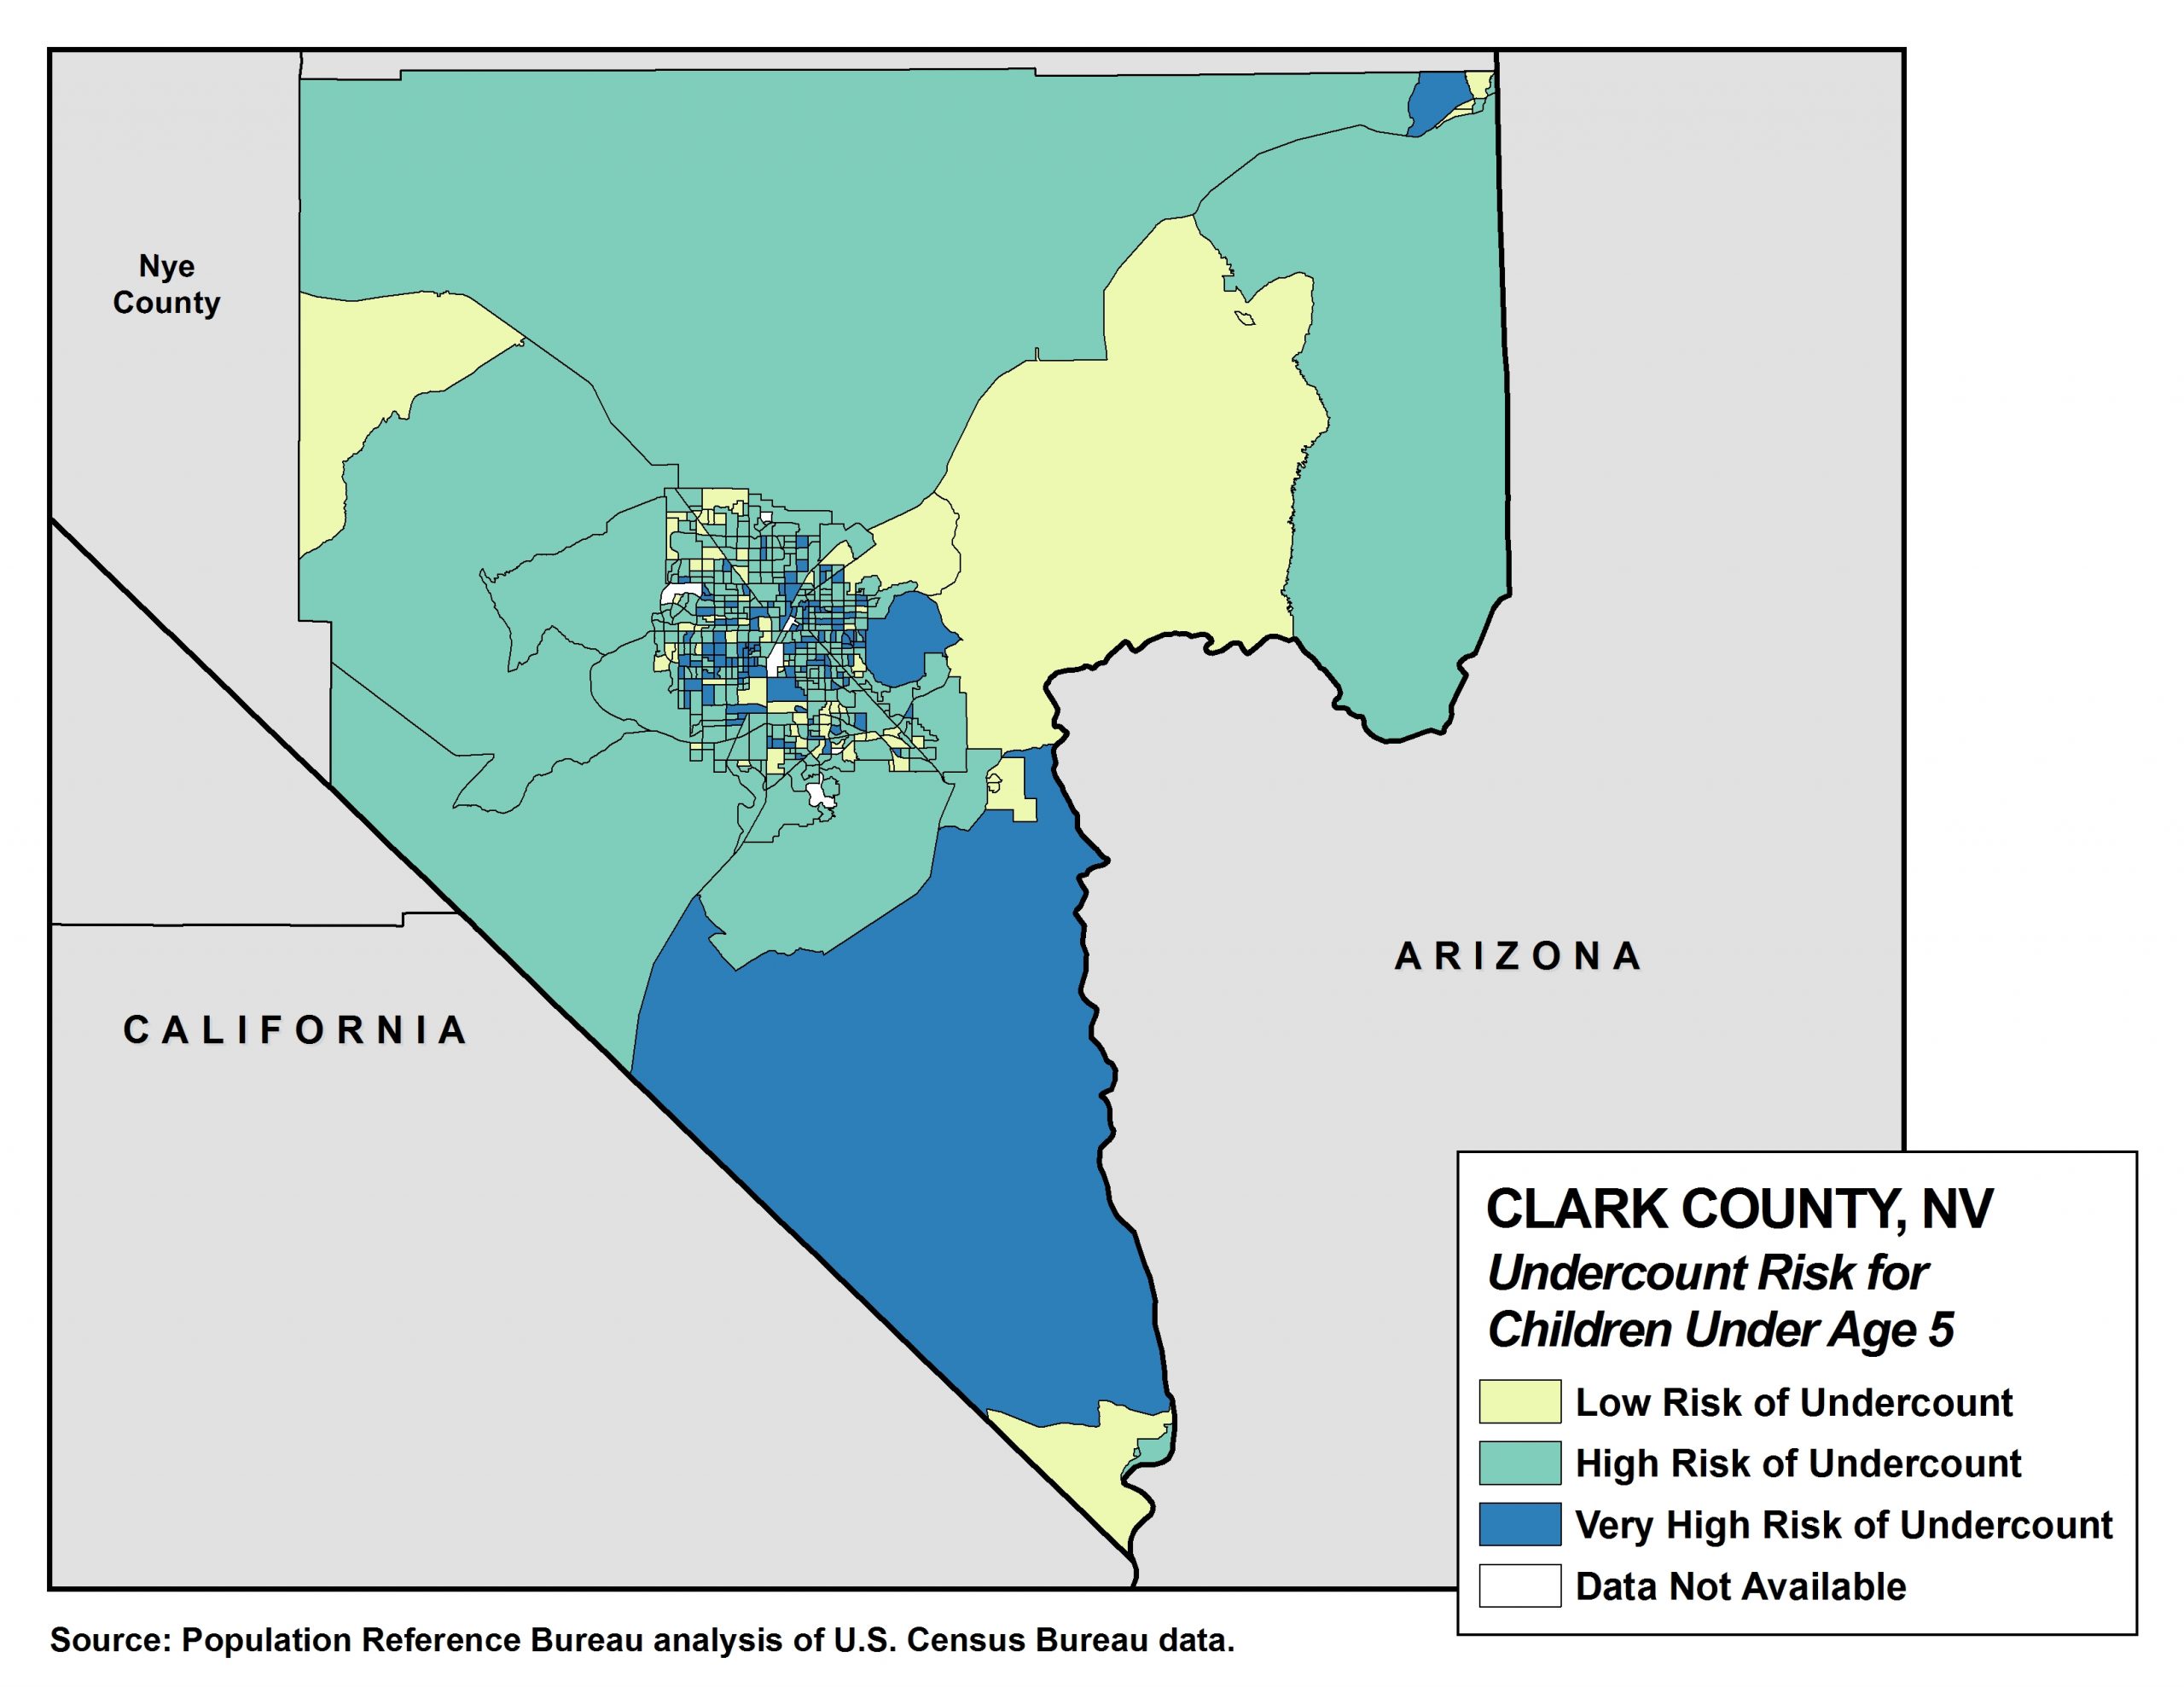
In Clark County, Nevada, 20% of children under age 5 live in tracts with a very high risk of undercounting young children, according to PRB’s analysis of data from the U.S. Census Bureau.
| wdt_ID | Key Factors Predicting the Undercount of Young Children | United States | NV | All tracts in Clark County, NV | Tracts in Clark County, NV w/ very high risk of undercounting |
|---|---|---|---|---|---|
| 1 | Children under age 5 living in families with incomes below 100% of the poverty level (%) | 22 | 23 | 24 | 30 |
| 2 | Adults ages 18 to 34 with less than a high school diploma or GED (%) | 12 | 15 | 15 | 16 |
| 3 | Children under age 18 living in female-headed households with no spouse present (%) | 25 | 26 | 27 | 38 |
| 4 | Children under age 6 living with grandparent householders (%) | 11 | 11 | 11 | 20 |
| 5 | Households that are limited English speaking (%) | 4 | 6 | 7 | 11 |
| 6 | Children under age 6 living in immigrant families (%) | 25 | 34 | 37 | 52 |
| 7 | Population living in renter-occupied housing units (%) | 35 | 44 | 47 | 52 |
Click here for an interactive version of this map from the CUNY Mapping Service at the City University of New York’s Graduate Center.
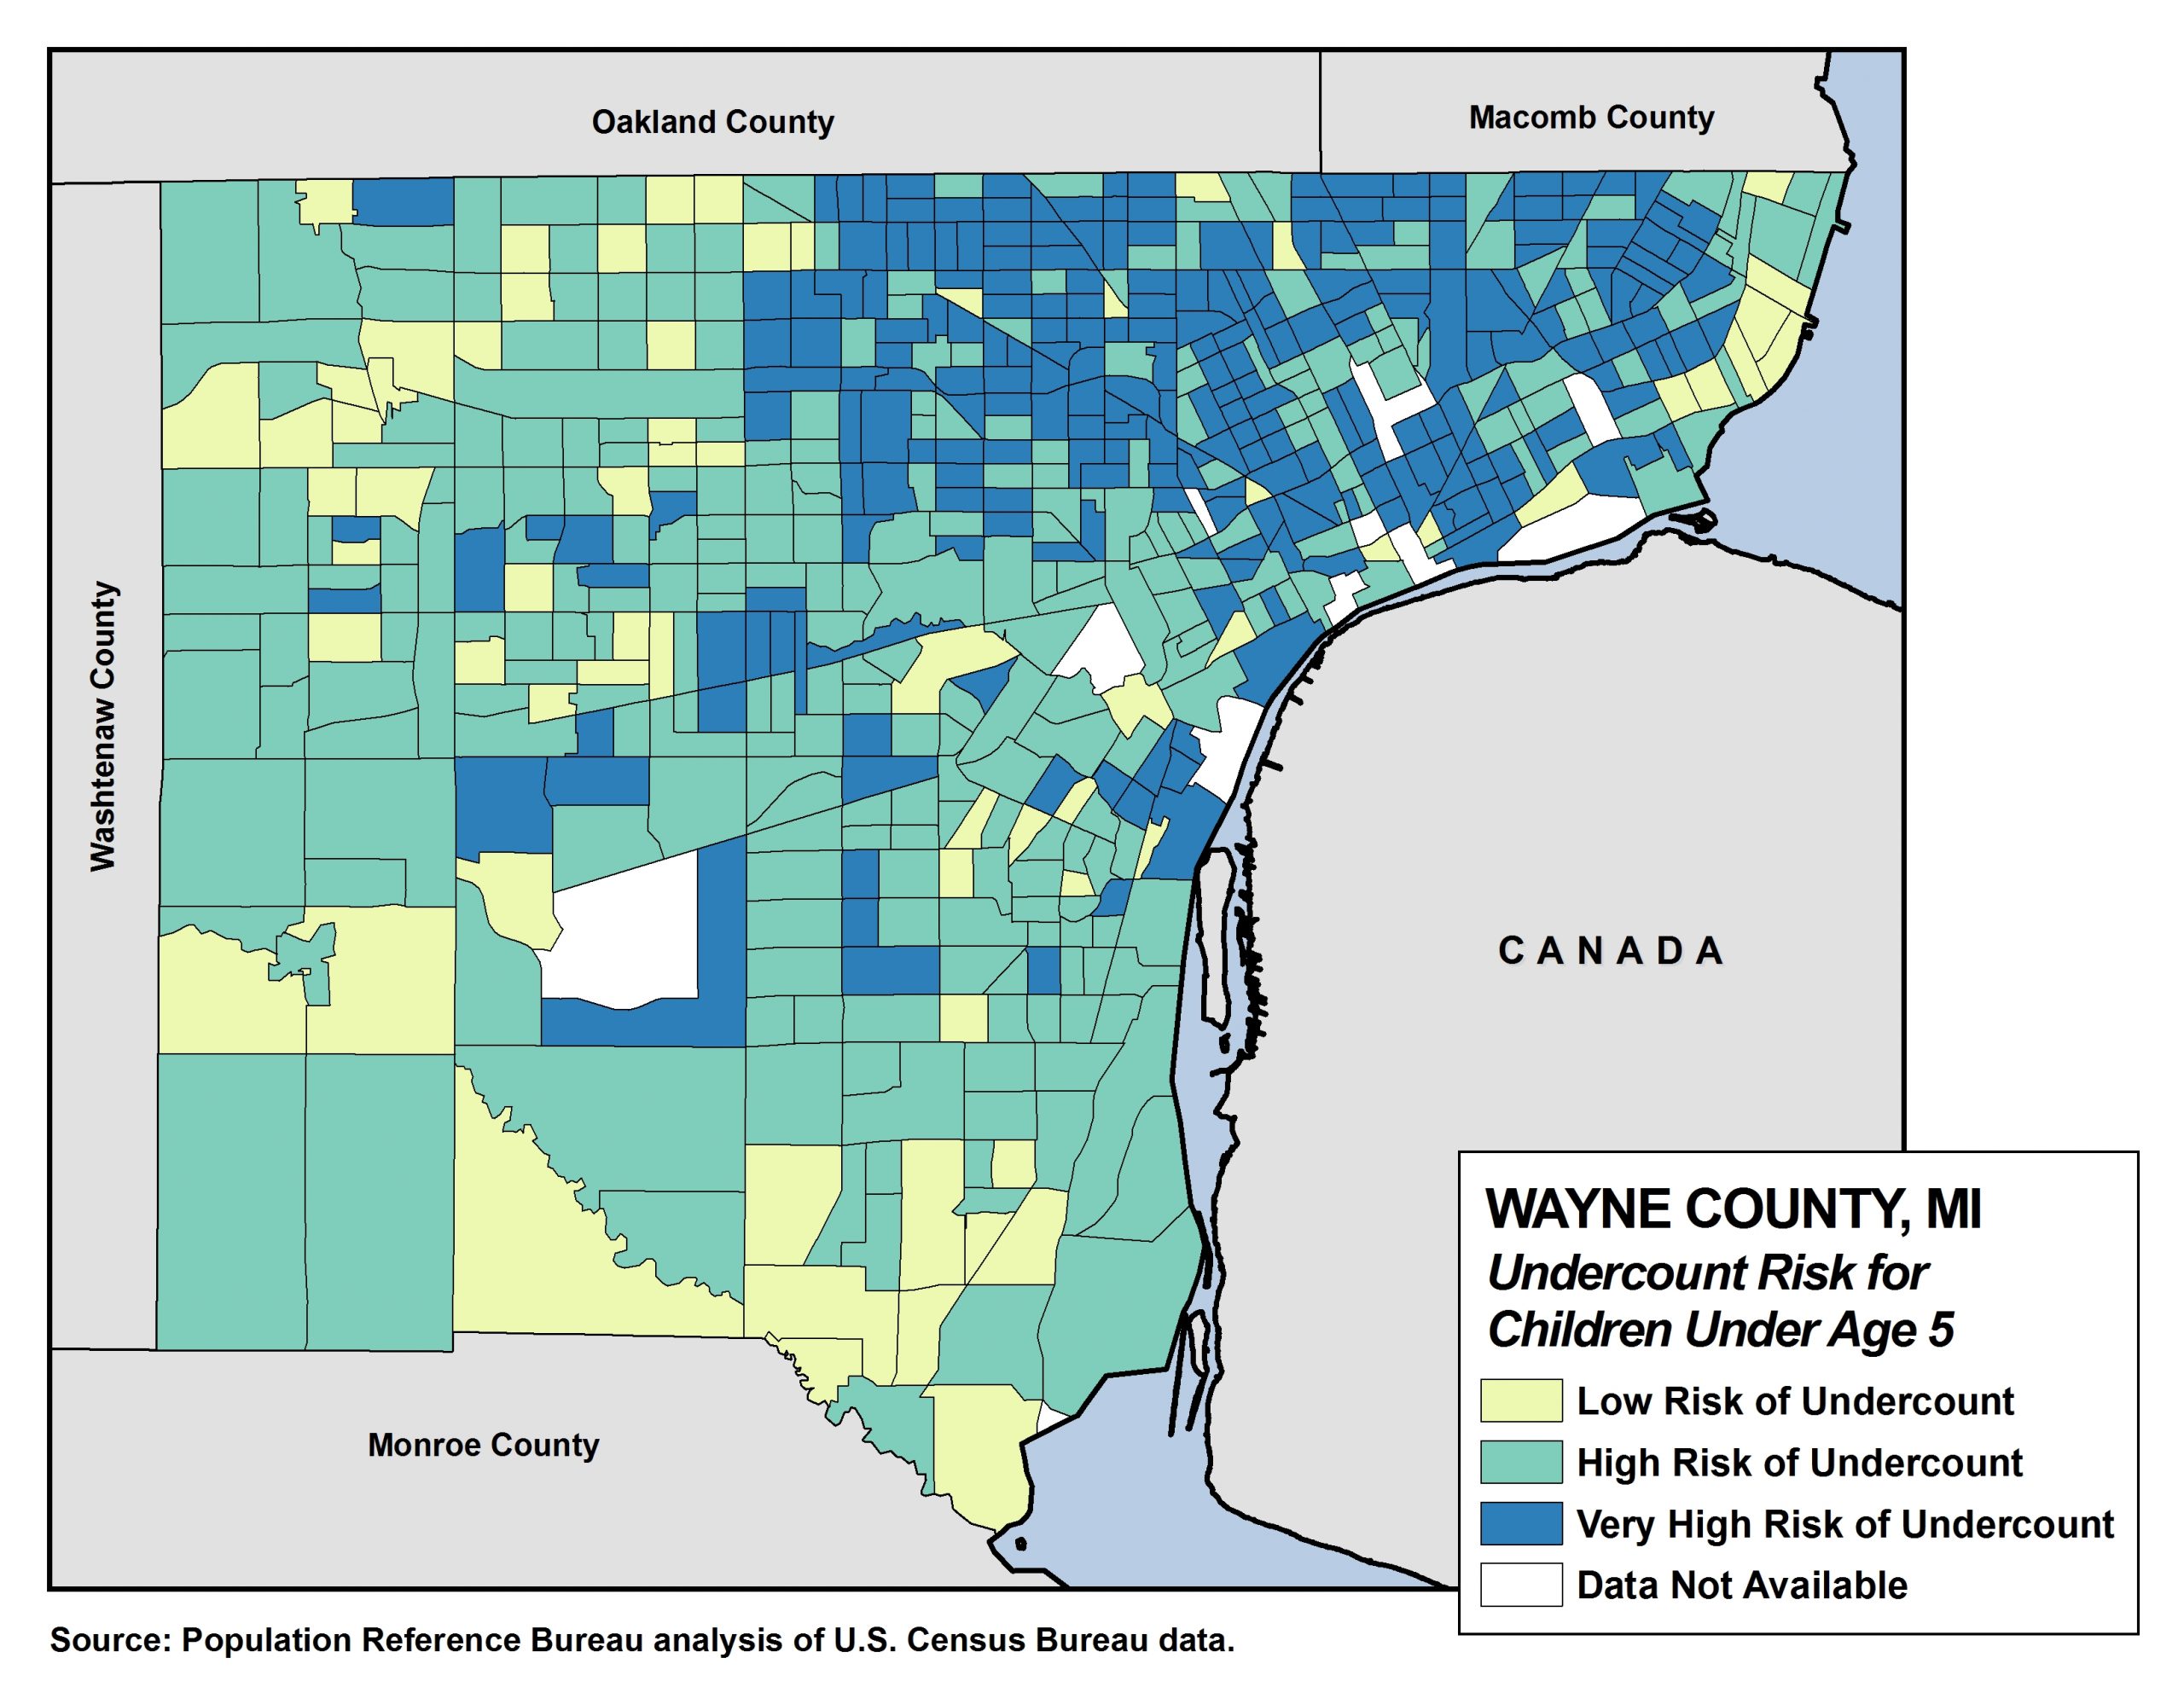
In Wayne County, Michigan, 39% of children under age 5 live in tracts with a very high risk of undercounting young children, according to PRB’s analysis of data from the U.S. Census Bureau.
| wdt_ID | Key Factors Predicting the Undercount of Young Children | United States | NV | All tracts in Clark County, NV | Tracts in Clark County, NV w/ very high risk of undercounting |
|---|---|---|---|---|---|
| 1 | Children under age 5 living in families with incomes below 100% of the poverty level (%) | 22 | 23 | 24 | 30 |
| 2 | Adults ages 18 to 34 with less than a high school diploma or GED (%) | 12 | 15 | 15 | 16 |
| 3 | Children under age 18 living in female-headed households with no spouse present (%) | 25 | 26 | 27 | 38 |
| 4 | Children under age 6 living with grandparent householders (%) | 11 | 11 | 11 | 20 |
| 5 | Households that are limited English speaking (%) | 4 | 6 | 7 | 11 |
| 6 | Children under age 6 living in immigrant families (%) | 25 | 34 | 37 | 52 |
| 7 | Population living in renter-occupied housing units (%) | 35 | 44 | 47 | 52 |
Click here for an interactive version of this map from the CUNY Mapping Service at the City University of New York’s Graduate Center.
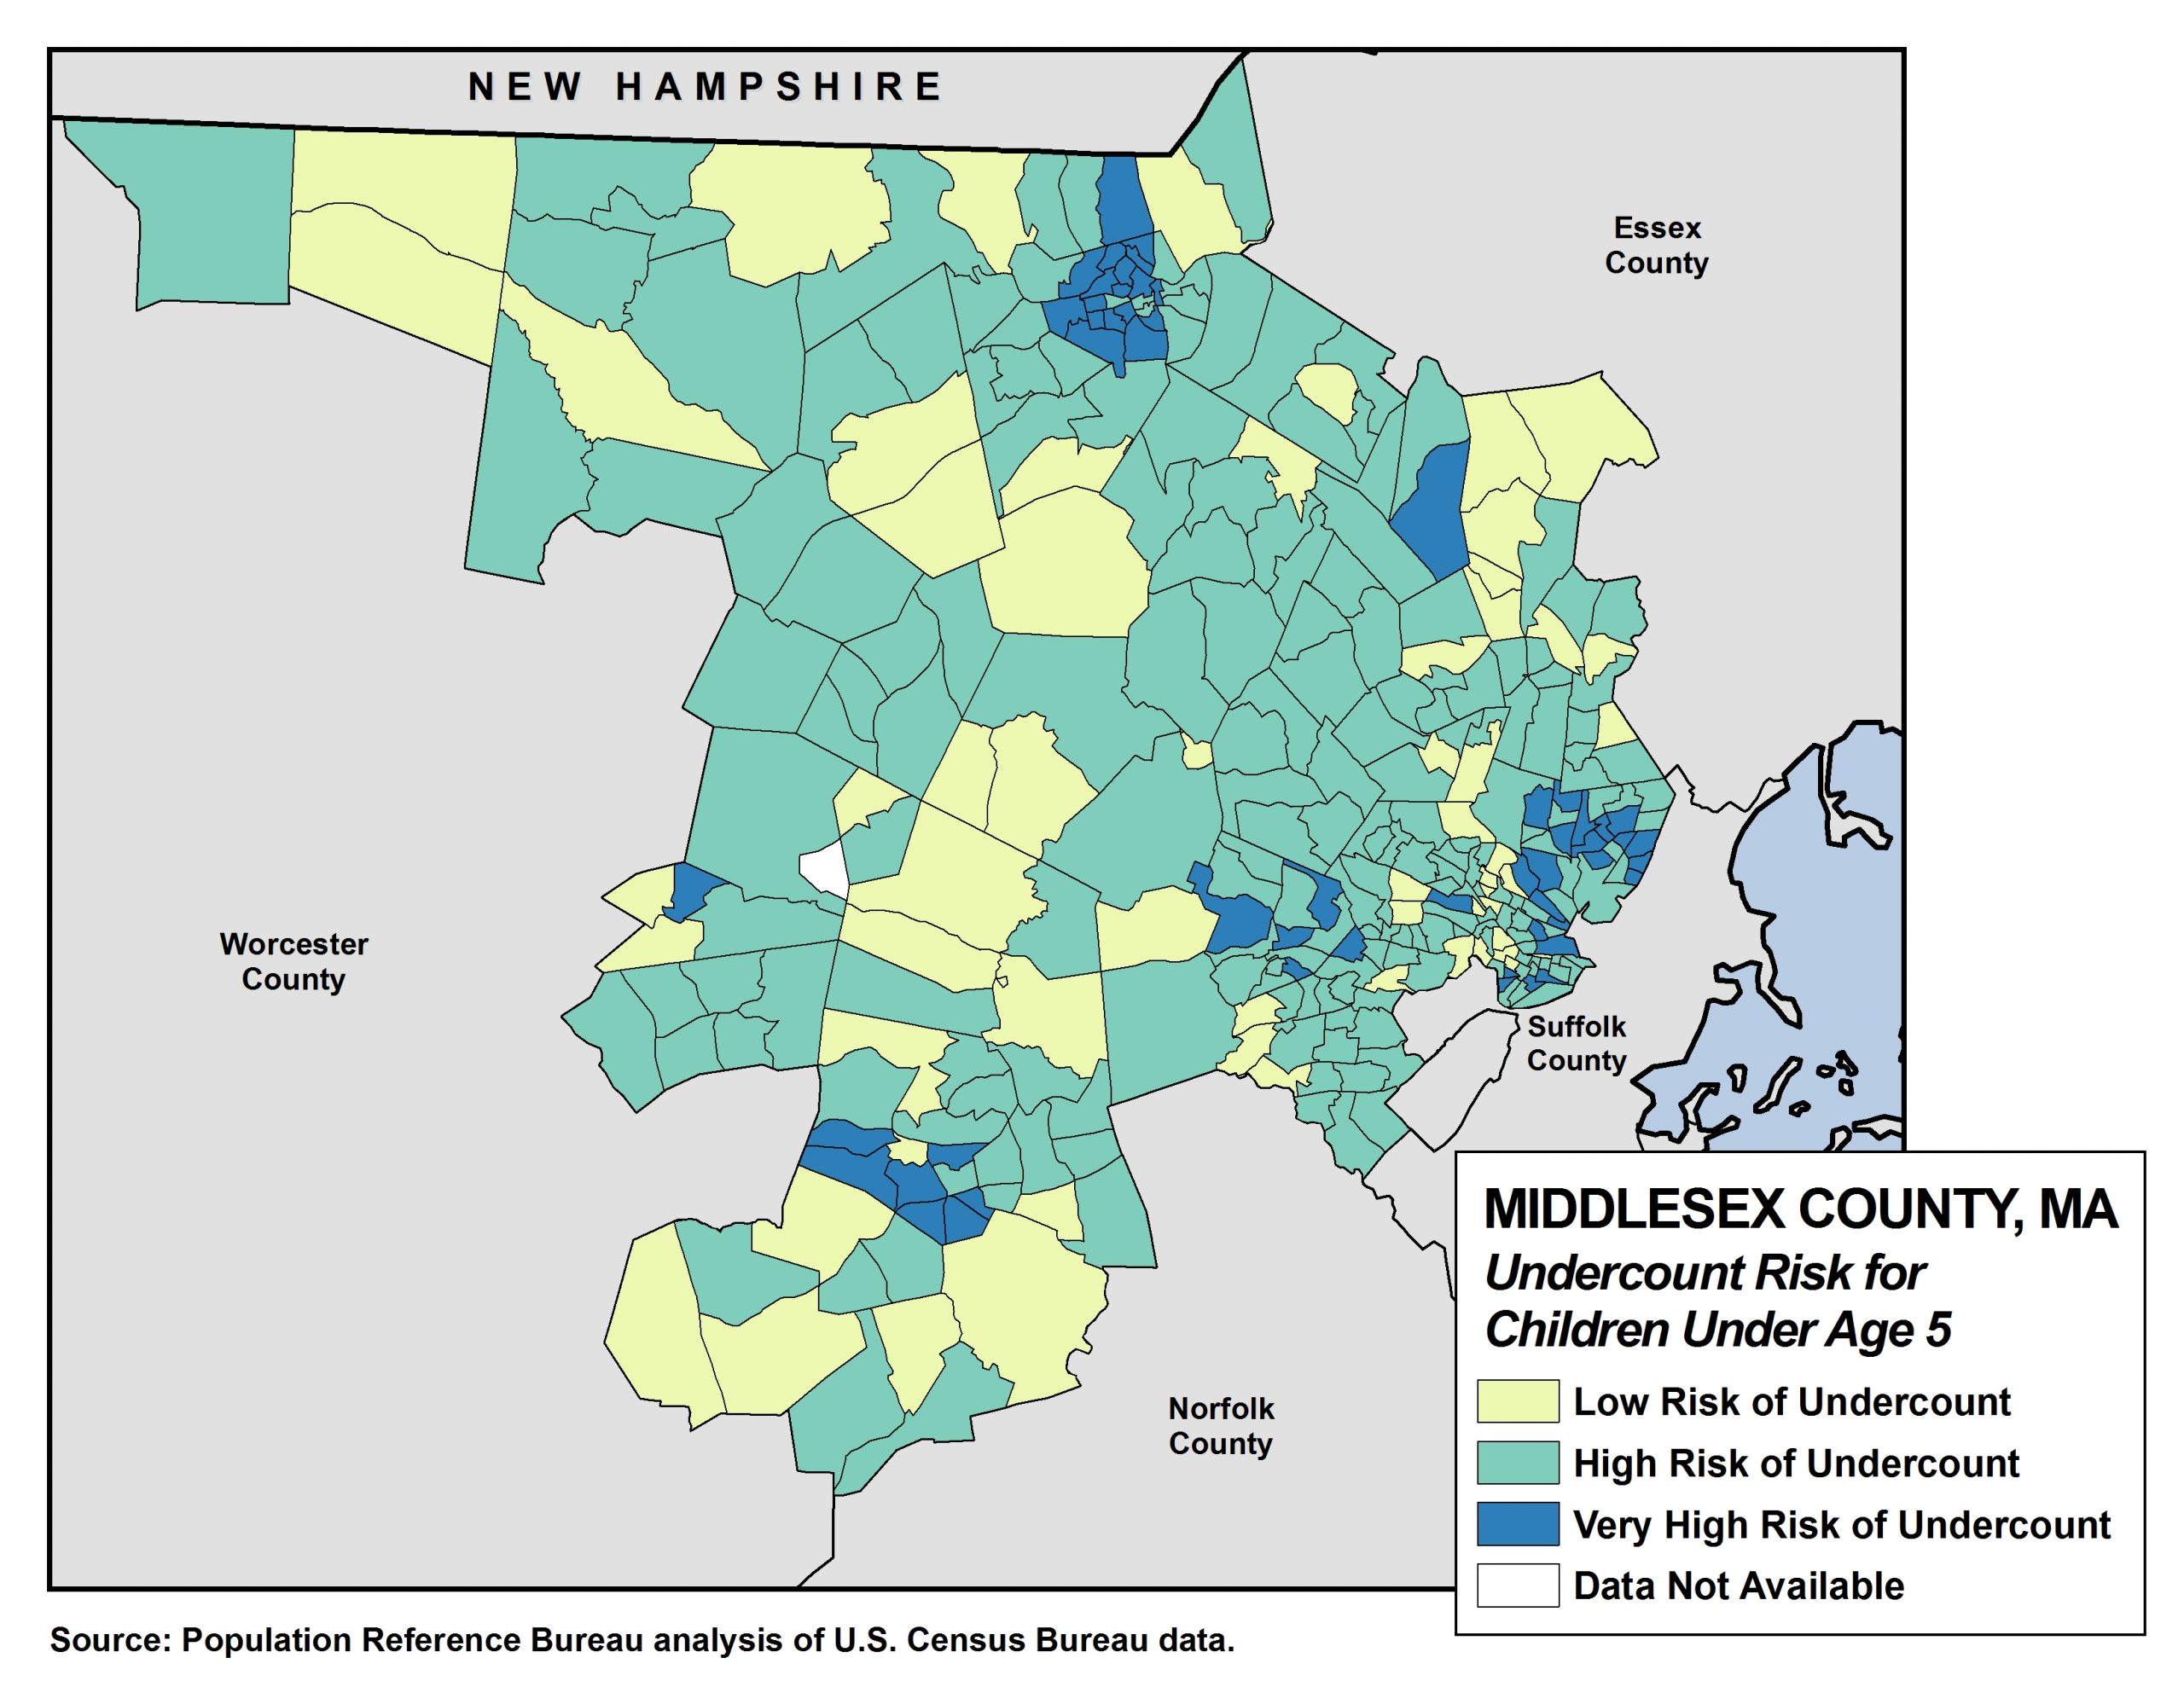
In Middlesex County, Massachusetts, 18% of children under age 5 live in tracts with a very high risk of undercounting young children, according to PRB’s analysis of data from the U.S. Census Bureau.
| wdt_ID | Key Factors Predicting the Undercount of Young Children | United States | MA | All tracts in Middlesex County, MA | Tracts in Middlesex County, MA w/ very high risk of undercounting |
|---|---|---|---|---|---|
| 1 | Children under age 5 living in families with incomes below 100% of the poverty level (%) | 22 | 16 | 11 | 27 |
| 2 | Adults ages 18 to 34 with less than a high school diploma or GED (%) | 12 | 8 | 6 | 8 |
| 3 | Children under age 18 living in female-headed households with no spouse present (%) | 25 | 25 | 17 | 37 |
| 4 | Children under age 6 living with grandparent householders (%) | 11 | 9 | 6 | 12 |
| 5 | Households that are limited English speaking (%) | 4 | 6 | 6 | 14 |
| 6 | Children under age 6 living in immigrant families (%) | 25 | 31 | 39 | 60 |
| 7 | Population living in renter-occupied housing units (%) | 35 | 34 | 33 | 56 |
Click here for an interactive version of this map from the CUNY Mapping Service at the City University of New York’s Graduate Center.

In Philadelphia, Pennsylvania, 64% of children under age 5 live in tracts with a very high risk of undercounting young children, according to PRB’s analysis of data from the U.S. Census Bureau.
| wdt_ID | Key Factors Predicting the Undercount of Young Children | United States | PA | All tracts in Philadelphia, PA | Tracts in Philadelphia, PA w/ very high risk of undercounting |
|---|---|---|---|---|---|
| 1 | Children under age 5 living in families with incomes below 100% of the poverty level (%) | 22 | 21 | 36 | 44 |
| 2 | Adults ages 18 to 34 with less than a high school diploma or GED (%) | 12 | 10 | 11 | 13 |
| 3 | Children under age 18 living in female-headed households with no spouse present (%) | 25 | 26 | 49 | 60 |
| 4 | Children under age 6 living with grandparent householders (%) | 11 | 11 | 18 | 22 |
| 5 | Households that are limited English speaking (%) | 4 | 2 | 7 | 9 |
| 6 | Children under age 6 living in immigrant families (%) | 25 | 13 | 23 | 23 |
| 7 | Population living in renter-occupied housing units (%) | 35 | 28 | 45 | 47 |
Explore the interactive HTC 2020 map developed by the CUNY Mapping Service at the City University of New York’s (CUNY) Graduate Center. This map includes tract-level data on the risk of undercounting young children for 689 large counties distributed across the United States.
Source: The Census 2020 Hard to Count map application at www.censushardtocountmaps2020.us was developed by the CUNY Mapping Service at the City University of New York's (CUNY) Graduate Center.
 ">
">
 ">
">
 ">
">