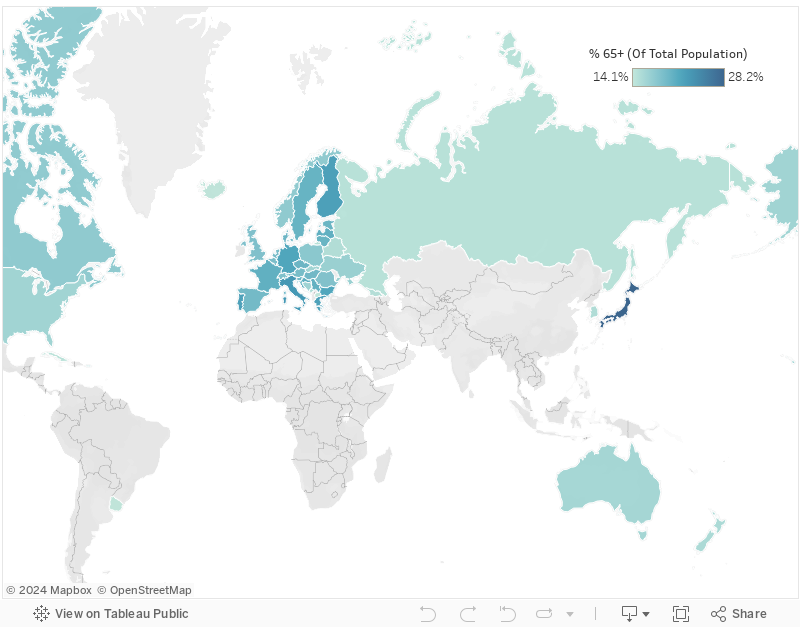
Countries With the Oldest Populations in the World

Asia and Europe are home to some of the world’s oldest populations, those ages 65 and above. At the top is Japan at 28 percent, followed by Italy at 23 percent. Finland, Portugal, and Greece round out the top five at just under 22 percent.
Southern Europe, which includes such countries Croatia, Greece, Italy, Malta, Portugal, Serbia, Slovenia and Spain, is the oldest region in the world with 21 percent of the population ages 65+.
Twelve percent of China’s population is age 65 or above. That share is 16 percent in the United States, 6 percent in India, and 3 percent in Nigeria.
Top 50 Countries With the Largest Number of Older Adults
| wdt_ID | Rank | Country | # 65+ (in millions) | % 65+ (of total population) | # total population (in millions) |
|---|---|---|---|---|---|
| 1 | 1 | China | 166.37 | 11.9 | 1398.03 |
| 2 | 2 | India | 84.9 | 6.1 | 1391.89 |
| 3 | 3 | United States | 52.76 | 16 | 329.15 |
| 4 | 4 | Japan | 35.58 | 28.2 | 126.18 |
| 5 | 5 | Russian Federation | 21.42 | 14.6 | 146.73 |
| 6 | 6 | Brazil | 17.79 | 8.5 | 209.33 |
| 7 | 7 | Germany | 17.78 | 21.4 | 83.1 |
| 8 | 8 | Indonesia | 15.16 | 5.6 | 268.42 |
| 9 | 9 | Italy | 13.76 | 22.8 | 60.34 |
| 10 | 10 | France | 13.16 | 20.3 | 64.83 |
| 11 | 11 | United Kingdom | 12.24 | 18.3 | 66.83 |
| 12 | 12 | Pakistan | 9.31 | 4.3 | 216.57 |
| 13 | 13 | Mexico | 9.17 | 7.2 | 126.58 |
| 14 | 14 | Spain | 8.99 | 19.1 | 47.07 |
| 15 | 15 | Bangladesh | 8.35 | 5.1 | 163.67 |
| 16 | 16 | South Korea | 7.83 | 15.1 | 51.85 |
| 17 | 17 | Thailand | 7.61 | 11.5 | 66.37 |
| 18 | 18 | Turkey | 7.27 | 8.8 | 82.61 |
| 19 | 19 | Ukraine | 6.94 | 16.5 | 42.04 |
| 20 | 20 | Poland | 6.72 | 17.5 | 38.4 |
| 21 | 21 | Viet Nam | 6.72 | 7 | 95.66 |
| 22 | 22 | Canada | 6.44 | 17.2 | 37.41 |
| 23 | 23 | Philippines | 5.51 | 5.1 | 108.12 |
| 24 | 24 | Nigeria | 5.43 | 2.7 | 200.96 |
| 25 | 25 | Iran | 5.12 | 6.1 | 83.91 |
| 26 | 26 | Argentina | 5.1 | 11.4 | 44.94 |
| 27 | 27 | Colombia | 4.63 | 11.4 | 44.94 |
| 28 | 28 | Australia | 4 | 15.8 | 25.31 |
| 29 | 29 | Ethiopia | 3.92 | 3.5 | 112.08 |
| 30 | 30 | Egypt | 3.86 | 3.9 | 99.06 |
| 31 | 31 | Romania | 3.52 | 18.2 | 19.36 |
| 32 | 32 | South Africa | 3.51 | 6 | 58.62 |
| 33 | 33 | Taiwan | 3.27 | 13.9 | 23.59 |
| 34 | 34 | Netherlands | 3.27 | 18.9 | 17.34 |
| 35 | 35 | Myanmar | 3.19 | 5.9 | 54.05 |
| 36 | 36 | Algeria | 2.67 | 6.2 | 43.41 |
| 37 | 37 | Peru | 2.66 | 8.4 | 31.78 |
| 38 | 38 | Democratic Republic of the Congo | 2.6 | 3 | 86.79 |
| 39 | 39 | Morocco | 2.53 | 7.1 | 35.59 |
| 40 | 40 | North Korea | 2.44 | 9.5 | 25.67 |
| 41 | 41 | Greece | 2.33 | 21.8 | 10.7 |
| 42 | 42 | Chile | 2.26 | 11.8 | 19.11 |
| 43 | 43 | Portugal | 2.24 | 21.8 | 10.27 |
| 44 | 44 | Belgium | 2.15 | 18.7 | 11.46 |
| 45 | 45 | Malaysia | 2.11 | 6.4 | 32.75 |
| 46 | 47 | Sweden | 2.05 | 19.9 | 10.29 |
| 47 | 48 | Venezuala | 1.95 | 6.8 | 28.52 |
| 48 | 49 | Hungary | 1.89 | 19.3 | 9.77 |
| 49 | 50 | Sri Lanka | 1.71 | 7.8 | 21.9 |
Sources: United Nations Population Division, World Population Prospects 2019, https://population.un.org/wpp/Download/Standard/Population/, and Toshiko Kaneda, Charlotte Greenbaum, and Kaitlyn Patierno, 2019 World Population Data Sheet (Washington, DC: Population Reference Bureau, 2019).
Top 50 Countries With the Largest Percentage of Older Adults
Top 50 Countries With the Largest Percentage of Older Adults
| wdt_ID | - | Country | % 65+* | Age 65-74 | Age 75-84 | Age 85 and over | 65+ Pop. (in Millions) | Total (in Millions) |
|---|---|---|---|---|---|---|---|---|
| 1 | 1 | Japan | 28.2 | 50 | 34 | 16 | 35.58 | 126.18 |
| 2 | 2 | Italy | 22.8 | 49 | 35 | 16 | 13.76 | 60.34 |
| 3 | 3 | Finland | 21.9 | 58 | 30 | 12 | 1.21 | 5.52 |
| 4 | 4 | Portugal | 21.8 | 51 | 35 | 14 | 2.24 | 10.27 |
| 5 | 5 | Greece | 21.8 | 48 | 35 | 17 | 2.33 | 10.70 |
| 6 | 6 | Germany | 21.4 | 47 | 39 | 14 | 17.78 | 83.10 |
| 7 | 7 | Bulgaria | 21.3 | 59 | 31 | 9 | 1.49 | 6.98 |
| 8 | 8 | Croatia | 20.4 | 54 | 34 | 12 | 0.83 | 4.05 |
| 9 | 9 | France | 20.3 | 54 | 29 | 17 | 13.16 | 64.83 |
| 10 | 10 | Latvia | 20.3 | 50 | 36 | 15 | 0.39 | 1.91 |
| 11 | 11 | Serbia | 20.2 | -- | -- | -- | 1.40 | 6.94 |
| 12 | 12 | Sweden | 19.9 | 54 | 33 | 13 | 2.05 | 10.29 |
| 13 | 13 | Lithuania | 19.8 | 49 | 36 | 15 | 0.55 | 2.79 |
| 14 | 14 | Estonia | 19.8 | 50 | 36 | 13 | 0.26 | 1.33 |
| 15 | 15 | Denmark | 19.6 | 58 | 31 | 11 | 1.14 | 5.82 |
| 16 | 16 | Czechia | 19.6 | 61 | 29 | 10 | 2.09 | 10.67 |
| 17 | 17 | Slovenia | 19.6 | 54 | 33 | 13 | 0.41 | 2.09 |
| 18 | 18 | Hungary | 19.3 | 59 | 31 | 10 | 1.89 | 9.77 |
| 19 | 19 | Malta | 19.2 | 60 | 30 | 10 | 0.10 | 0.50 |
| 20 | 20 | Spain | 19.1 | 49 | 33 | 18 | 8.99 | 47.07 |
| 21 | 21 | Netherlands | 18.9 | 58 | 31 | 12 | 3.27 | 17.34 |
| 22 | 22 | Austria | 18.8 | 50 | 37 | 13 | 1.67 | 8.88 |
| 23 | 23 | Belgium | 18.7 | 53 | 32 | 15 | 2.15 | 11.46 |
| 24 | 24 | United Kingdom | 18.3 | 54 | 32 | 14 | 12.24 | 66.83 |
| 25 | 25 | Switzerland | 18.3 | 53 | 33 | 14 | 1.57 | 8.57 |
| 26 | 26 | Romania | 18.2 | 58 | 32 | 11 | 3.52 | 19.36 |
| 27 | 27 | San Marino | 18 | -- | -- | -- | 0.01 | 0.03 |
| 28 | 28 | Poland | 17.5 | 60 | 28 | 12 | 6.72 | 38.40 |
| 29 | 29 | Liechtenstein | 17.5 | -- | -- | -- | 0.01 | 0.04 |
| 30 | 30 | Norway | 17.2 | 50 | 30 | 13 | 0.92 | 5.34 |
| 31 | 31 | Canada | 17.2 | 58 | 29 | 13 | 6.44 | 37.41 |
| 32 | 32 | Ukraine | 16.5 | 57 | 34 | 9 | 6.94 | 42.04 |
| 33 | 33 | Hong Kong, China | 16.4 | 58 | 27 | 15 | 1.23 | 7.52 |
| 34 | 34 | Bosnia-Herzegovina | 16.1 | 61 | 32 | 7 | 0.56 | 3.49 |
| 35 | 35 | Slovakia | 16 | 62 | 29 | 9 | 0.87 | 5.45 |
| 36 | 36 | United States | 16 | 58 | 29 | 13 | 52.76 | 329.15 |
| 37 | 37 | New Zealand | 15.3 | 58 | 30 | 12 | 0.76 | 4.97 |
| 38 | 39 | Barbados | 15.3 | 56 | 30 | 14 | 0.04 | 0.29 |
| 39 | 40 | Montenegro | 15.2 | 61 | 30 | 9 | 0.09 | 0.62 |
| 40 | 41 | South Korea | 15.1 | 58 | 33 | 9 | 7.83 | 51.85 |
| 41 | 42 | Belarus | 15 | 56 | 33 | 11 | 1.42 | 9.47 |
| 42 | 43 | Georgia | 14.8 | 58 | 33 | 9 | 0.59 | 4.00 |
| 43 | 44 | Russian Federation | 14.6 | 59 | 31 | 10 | 21.42 | 146.73 |
| 44 | 45 | Cuba | 14.4 | 57 | 32 | 11 | 1.62 | 11.21 |
| 45 | 46 | Andorra | 14.4 | -- | -- | -- | 0.01 | 0.08 |
| 46 | 47 | Luxembourg | 14.4 | 55 | 31 | 14 | 0.09 | 0.62 |
| 47 | 48 | Iceland | 14.2 | 58 | 29 | 13 | 0.05 | 0.36 |
| 48 | 49 | Uruguay | 14.2 | 52 | 32 | 16 | 0.50 | 3.52 |
| 49 | 50 | North Macedonia | 14.1 | 64 | 30 | 6 | 0.29 | 2.08 |
Sources: United Nations Population Division, World Population Prospects 2019, https://population.un.org/wpp/Download/Standard/Population/, and Toshiko Kaneda, Charlotte Greenbaum, and Kaitlyn Patierno, 2019 World Population Data Sheet (Washington, DC: Population Reference Bureau, 2019).
Which Countries Have the Largest Share of People Ages 75+? Ages 85+?
| wdt_ID | Rank | Country | % 65+ (of total population) | # 65+ (in millions) | # total population (in millions) |
|---|---|---|---|---|---|
| 1 | 1 | Japan | 28,20 | 3.558,00 | 12.618,00 |
| 2 | 2 | Italy | 22,80 | 1.376,00 | 6.034,00 |
| 3 | 3 | Finland | 21,90 | 121,00 | 552,00 |
| 4 | 4 | Portugal | 21,80 | 224,00 | 1.027,00 |
| 5 | 5 | Greece | 21,80 | 233,00 | 1.070,00 |
| 6 | 6 | Germany | 21,40 | 1.778,00 | 8.310,00 |
| 7 | 7 | Bulgaria | 21,30 | 149,00 | 698,00 |
| 8 | 8 | Croatia | 20,40 | 83,00 | 405,00 |
| 9 | 9 | France | 20,30 | 1.316,00 | 6.483,00 |
| 10 | 10 | Latvia | 20,30 | 39,00 | 191,00 |
| 11 | 11 | Serbia | 20,20 | 140,00 | 694,00 |
| 12 | 12 | Sweden | 19,90 | 205,00 | 1.029,00 |
| 13 | 13 | Lithuania | 19,80 | 55,00 | 279,00 |
| 14 | 14 | Estonia | 19,80 | 26,00 | 133,00 |
| 15 | 15 | Denmark | 19,60 | 114,00 | 582,00 |
| 16 | 16 | Czech Republic | 19,60 | 209,00 | 1.067,00 |
| 17 | 17 | Slovenia | 19,60 | 41,00 | 209,00 |
| 18 | 18 | Hungary | 19,30 | 189,00 | 977,00 |
| 19 | 19 | Malta | 19,20 | 10,00 | 50,00 |
| 20 | 20 | Spain | 19,10 | 899,00 | 4.707,00 |
| 21 | 21 | Netherlands | 18,90 | 327,00 | 1.734,00 |
| 22 | 22 | Austria | 18,80 | 167,00 | 888,00 |
| 23 | 23 | Belgium | 18,70 | 215,00 | 1.146,00 |
| 24 | 24 | United Kingdom | 18,30 | 1.224,00 | 6.683,00 |
| 25 | 25 | Switzerland | 18,30 | 157,00 | 857,00 |
| 26 | 26 | Romania | 18,20 | 352,00 | 1.936,00 |
| 27 | 27 | San Marino | 18,00 | 1,00 | 3,00 |
| 28 | 28 | Poland | 17,50 | 672,00 | 3.840,00 |
| 29 | 29 | Liechtenstein | 17,50 | 1,00 | 4,00 |
| 30 | 30 | Norway | 17,20 | 92,00 | 534,00 |
| 31 | 31 | Canada | 17,20 | 644,00 | 3.741,00 |
| 32 | 32 | Ukraine | 16,50 | 694,00 | 4.204,00 |
| 33 | 33 | Hong Kong, China SAR | 16,40 | 123,00 | 752,00 |
| 34 | 34 | Bosnia-Herzegovina | 16,10 | 56,00 | 349,00 |
| 35 | 35 | Slovakia | 16,00 | 87,00 | 545,00 |
| 36 | 36 | United States | 16,00 | 5.276,00 | 32.915,00 |
| 37 | 37 | Australia | 15,80 | 400,00 | 2.331,00 |
| 38 | 38 | New Zealand | 15,30 | 76,00 | 497,00 |
| 39 | 39 | Barbados | 15,30 | 4,00 | 29,00 |
| 40 | 40 | Montenegro | 15,20 | 9,00 | 62,00 |
| 41 | 41 | South Korea | 15,10 | 783,00 | 5.185,00 |
| 42 | 42 | Belarus | 15,00 | 142,00 | 947,00 |
| 43 | 43 | Georgia | 14,80 | 59,00 | 400,00 |
| 44 | 44 | Russian Federation | 14,60 | 2.142,00 | 14.673,00 |
| 45 | 45 | Cuba | 14,40 | 162,00 | 1.121,00 |
| 46 | 46 | Andorra | 14,40 | 1,00 | 8,00 |
| 47 | 47 | Luxembourg | 14,40 | 9,00 | 62,00 |
| 48 | 48 | Iceland | 14,20 | 5,00 | 36,00 |
| 49 | 49 | Uruguay | 14,20 | 50,00 | 352,00 |
| 50 | 50 | North Macedonia | 14,10 | 29,00 | 208,00 |
*Breakdown of 65+ population (totaling 100%) across three columns show the share of 65-74, 75-84, and 85+
Sources: United Nations Population Division, World Population Prospects 2019, https://population.un.org/wpp/Download/Standard/Population/, and Toshiko Kaneda, Charlotte Greenbaum, and Kaitlyn Patierno, 2019 World Population Data Sheet (Washington, DC: Population Reference Bureau, 2019).
Related Posts
Why Americans Are Delaying Parenthood
Four studies offer new insights on the decision to have kids in a low birth rate era.

Power and Partnership: Supporting Youth Through the PACE Project
PACE’s approach to listening to and meaningfully supporting youth partners’ goals has developed into an intentional model.

Adolescents and Youth Are Key to Fully Achieving Universal Health Coverage
In 2021, adolescents and youth between ages 10 and 24 are estimated to make up approximately 24% of the world’s population.

Aging and Health in China: What Can We Learn From the World’s Largest Population of Older People?
The United Nations projects that there will be 366 million older Chinese adults by 2050, which is substantially larger than the current total U.S. population of 331 million.